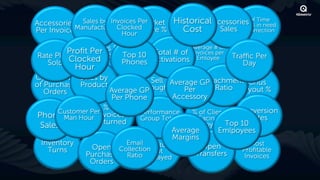
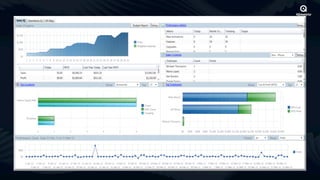
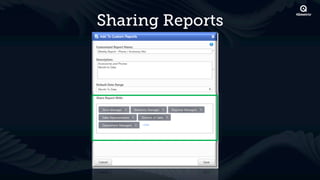
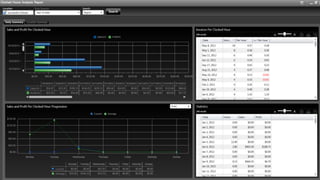
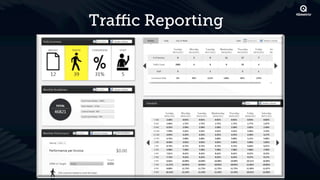
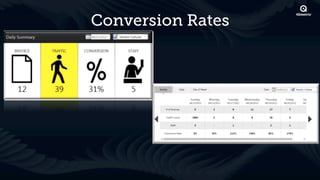
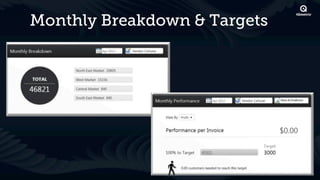
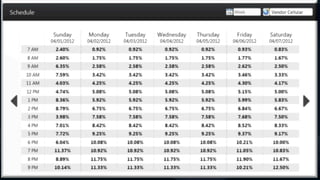
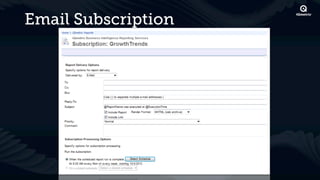
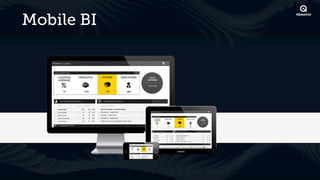
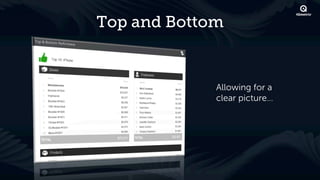
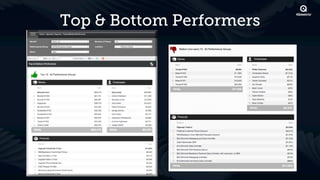
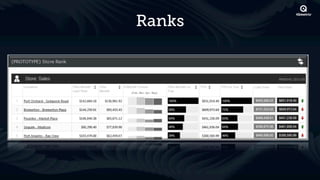
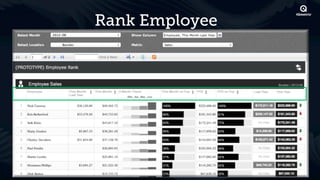
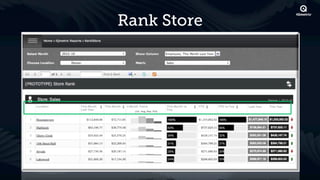
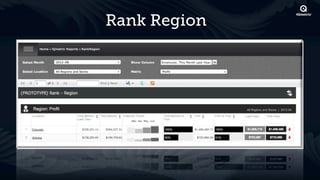
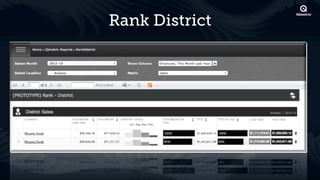
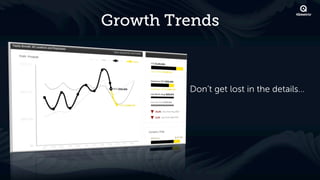
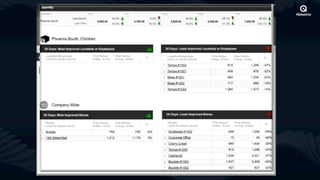
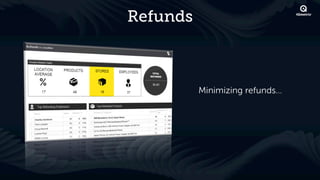
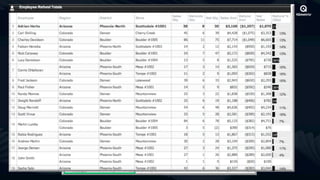
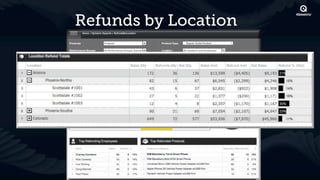
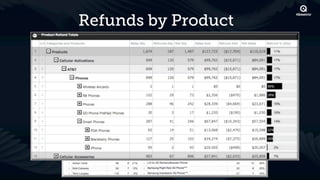
High Impact Reporting for a
   Successful Business
  with Kris Rogers & Megan Howse
Agenda

What Metrics Mean to You…
What Metrics Mean to Us…
The High Impact RQ4 Reports
New Business Intelligence!
What do Metrics mean to Your Business?


           How you gather, manage,
           and use information
           will determine whether
           you win or lose.
           – Bill Gates
Market Historical
Accessories Sales by Invoices Per               Accessories of in need
                                                           % Time
                                                        Sheets
Per Invoice Manufacturer Clocked
                          Hour
                               Share %   Cost      Sales of Correction

        Profit Per Per
               Sales                         Average # of
Rate Plans      Invoice Top 10 Total # of    invoices per
                                                            Traffic Per
   Sold Clocked
                                               Emloyee
                       Phones Activations                      Day
           Hour
Cycle Time Sales by              Sell Average GPAttachment Bonus
of Purchase Product
   Orders            Average Through % Per
                             GP                      Ratio Payout %
                      Per Phone         Accessory
       Customer Per
                    % of                                   Conversion
                             Performance     % of Client
 Phone Man Hour Invoices     Group Totals      Facing          Rates
  Sales          Returned                     Emloyees  Top 10
                                        Average       Emlpoyees
                                        Margins
  Inventory               Email of Stock
                              %                 Open           Most
    Turns        Open Collection Not                        Profitable
              Purchase RatioDisplayed         Transfers      Invoices
                Orders
The
story of
Accelerated
                                                                                          Profit

                 Expenses
                                                                                         } Profit


                                                                                      Profit

                                                                                          Profit

                                                                                         Expenses


1 2 3 4 5 6 7 8 9 10 11 12 13 14 15 16 17 18 19 20 21 22 23 24 25 26 27 28 29 30 31

                            Days of the Month
Now for the HOW…
Customizing Your
  RQ4 Reports
Sharing Reports
Performance Groups
Milestones
Sales
GP
   And your
Accessory Sales
Accessories per Location
Profit
In case you’re interested….

On average, RQ4 users
   GP/accessory is

            (2011)
Monitoring Profit by
    Accessory
Taking Advantage of
   Compatibility
In 2011 only 17% of
     you used
   Compatibility
Today…..
Have more than 25%
compatibility setup?


           $2.91
            GP
Have more than 85%
compatibility setup?


           $5.01
            GP
The Activation Gross
   Profit Report
Devices and Plans
Refunds
Discounting
Inventory
How much are you writing off now?
                      1-3 times a
                         week

          1-3 times   $443.18        1+ a day
           month

        $687.44                     $310.41

                       Average
     Count less
   than 1 month
                      $749.53        2 + Day
                       location      $151.31
   $810.81            Per month
10 Stores and counting Less than once a month
               $8,108 per month

    10 Stores and counting 1 time per day
              $3,104 per month
Why are you writing
  off Inventory?
Aging Inventory
Invoices and Sales
Per Clocked Hour
Login Audit
PocketRQ
Quick Access to key reports
Traffic Reporting
Traffic Reporting
Conversion Rates
Monthly Breakdown & Targets
Business Intelligence
Email Subscription
Mobile BI
Top and Bottom


             Allowing for a
             clear picture…
Top & Bottom Performers
Ranks
Rank Employee
Rank Store
Rank Region
Rank District
Growth Trends


         Don’t get lost in the details…
Refunds


          Minimizing refunds…
Refunds By Employee
Refunds by Location
Refunds by Product
In Summary
Focus on your Goals & Destinations
Look at the Big Picture!
Maximize Profit by Increasing Revenue
Use RQ4 to help you get there!
Look forward to advancements in the Future…
iQmetrix.com | 1.866.iQmetrix


       © 2011 iQmetrix. All right reserved. iQmetrix, the iQmetrix logo, RQ4 and other trademarks, service marks, and
designs referenced in this material are the exclusive property of iQmetrix Software Development Corp. and/or its subsidiaries.

High Impact Reporting with Kris and Megan