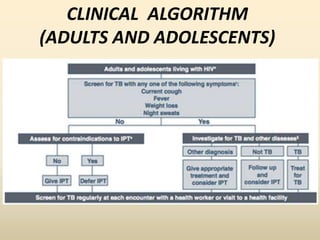
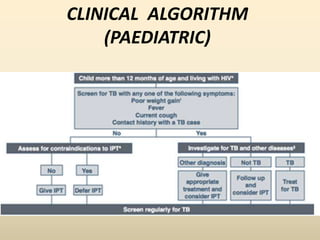
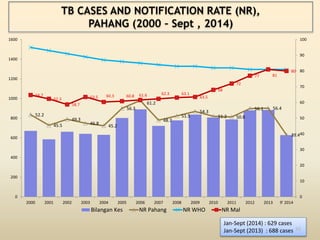
PENGENALAN PROGRAM 3i 
1.Intensified Case Finding 
2.Isoniazid Prophylaxis Therapy 
3.Infection Control for Tb
 Program yang diadaptasi daripada saranan 
WHO 
 Meningkatkan pengesanan kes melalui 
saringan di kalangan golongan berisiko 
tinggi 
 Mengawal penularan penyakit tibi melalui 
kawalan infeksi 
 Mengurangkan risiko golongan berisiko 
dari mendapat penyakit tibi
PENGENALAN PROGRAM 3i
Intensified Case Findings(ICF) 
• Garispanduan WHO 
– “find as many cases as 
possible, as early as possible” 
– Systematic Screening of Active 
TB, 2013 – Facility Initiated 
• Inisiatif di peringkat negeri 
– ICF dalam Komuniti 
– TB Combi 
– HASRAT 
• Pekeliling daripada Program 
– IPT , pemeriksaan TB di 
kalangan pesakit HIV 
– Garispanduan Saringan Tibi di 
Penjara
Isonazid Prophyalxis Therapy(IPT) 
TBHIV 2013 
Malaysia 
- HIV-positive 
screened 
for TB 7017 
- HIV-positive 
provided 
IPT 1220
Infection Control (IC) 
• Garispanduan WHO 
– TB IC: from everybody’s 
problem to nobody’s business 
• Pekeliling daripada Program
INTENSIFIED CASE FINDING
KEY RECOMMENDATIONS
INTENSIFIED CASE FINDING (ICF) 
• Intensified Case Finding (ICF) is an activity, recommended 
by the WHO, intended to detect possible TB cases as 
early as possible among people living with HIV – usually by 
using a simple questionnaire for the signs and symptoms of 
TB. 
• ICF: Intensified Case Finding for TB means regularly 
screening all people with or at high risk of HIV or in 
congregate setting for the symptoms and signs of TB, 
followed promptly with diagnosis and treatment, and then 
doing the same for household contacts. 
November 17, 2014 
MESY. TWG BIL 2/2014, CROWN GARDEN 
HOTEL, KELANTAN
ICF Goals 
• Reduce morbidity and mortality 
 More intensive case-finding leads to fewer TB deaths and less 
severe post-TB complications 
 Focus on those most at risk of severe morbidity 
• Reduce TB transmission 
 General community 
 Institutional settings 
 Marginalised populations 
• Increase case-finding 
 Target high risk groups 
 Community-wide approach 
November 17, 2014 
MESY. TWG BIL 2/2014, CROWN GARDEN 
HOTEL, KELANTAN
CLINICAL ALGORITHM 
(ADULTS AND ADOLESCENTS)
CLINICAL ALGORITHM 
(PAEDIATRIC)
November 17, 2014 
MESY. TWG BIL 2/2014, CROWN GARDEN 
HOTEL, KELANTAN
November 17, 2014 
MESY. TWG BIL 2/2014, CROWN GARDEN 
HOTEL, KELANTAN
ICF OPPORTUNITY 
• Screening of high risk groups 
Symptomatic out pt, 
PLHIV, 
Diabetes, 
HCW 
• Screening in institutions 
Prisons 
PUSPEN 
Old folk homes 
• Screening in community 
High prevalence TB locality 
November 17, 2014 
MESY. TWG BIL 2/2014, CROWN GARDEN 
HOTEL, KELANTAN
GARISPANDUAN SARINGAN TIBI DI 
PENJARA 
• Di terbitkan pada tahun 
2006 dengan kerjasama 
Jabatan Penjara Malaysia 
• Bertujuan untuk 
meningkatkan pencegahan 
dan pengawalan penyakit 
Tibi di Institusi penjara 
• Meningkatkan promosi 
kesihatan di kalangan 
banduan dan kakitangan 
penjara 
• Masih digunapakai sehingga 
kini
What factors determine the yield 
and cost-effectiveness of ACF? 
Factor 1. TB prevalence among the target 
Higher prevalence – higher yield 
Factor 2. Diagnostic algorithms 
More comprehensive screening- higher cost 
&yield 
November 17, 2014 
MESY. TWG BIL 2/2014, CROWN GARDEN 
HOTEL, KELANTAN
November 17, 2014 
MESY. TWG BIL 2/2014, CROWN GARDEN 
HOTEL, KELANTAN
November 17, 2014 
MESY. TWG BIL 2/2014, CROWN GARDEN 
HOTEL, KELANTAN
ICF ACTIVITY I(3)T 
IDENTIFY 
TRAIN 
TRACE 
TREAT 
• Identify the localities with high 
burden of TB 
• Conduct training to the staff & 
community volunteers 
• House to house visit- TB 
screening & refer for positive 
symptoms 
• Ensure treatment is given for 
positive TB 
November 17, 2014 
MESY. TWG BIL 2/2014, CROWN GARDEN 
HOTEL, KELANTAN
ICF-PROCESS 
1. Survey your data 
2. Analyze -? High TB burden district- ? Localilities 
3. Start planning your ICF project – 
- Approval fr. TKPK KA, PKD, Local leaders 
-Conduct meeting with local leaders 
-Design your action plan- Gantt chart, budgetting, 
training, ICF form 
4. Conduct the training course 
5. Start ICF- house to house visit, TB screening, refer 
positive symptoms to nearby clinic. 
6. Writing the report 
November 17, 2014 
MESY. TWG BIL 2/2014, CROWN GARDEN 
HOTEL, KELANTAN
Syor 
1) Pelaksanaan garispanduan sediaada diperkukuh 
2) Revisit dan operasikan pekeliling /garispanduan di 
peringkat negeri dan daerah 
3) Merangka tanggungjawab pelbagai stakehodler 
yang berkaitan
TOP 5 COMMUNICABLE DISEASE, 
Disease 
MALAYSIA (2011- 2013) 
2011 2012 2013 
Incidence 
Rate 
Mortality 
Rate 
Incidence 
Rate 
Mortality 
Rate 
Incidence 
Rate 
Mortality 
Rate 
Dengue Fever 63.75 0 72.20 0 143.27 0.21 
Tuberculosis 7 1 . 3 5 5.68 77.41 4.82 81.0 5.4 
Hand, Food & 
24.17 0 24.17 0 78.52 0.0 
Mouth Diseases 
Food Poisoning 5 6 . 2 5 0.03 56.25 0.03 47.79 0.04 
Malaria 18.32 0.06 16.11 0.05 1.30 0.01 
Source: MOH 
27 
Note: 
*Incidence Rate was per 100,000 population except for Malaria per 10,000 population 
*Mortality Rate was per 100,000 population except for Malaria per 10,000 population
28 
DISTRIBUTION OF TB CASES BY STATE : 
(2011- JUNE, 2014) 
Sbh Sel Srk Jhr KL Prk Klt Kdh PP Phg Trg Mlk NS Pls Lbn 
5000 
4500 
4000 
3500 
3000 
2500 
2000 
1500 
1000 
500 
0 
2011 3794 3242 2056 2038 1907 1309 1448 1084 1126 788 667 511 449 141 106 
2012 4426 3560 2430 2046 1906 1554 1436 1174 1245 890 733 546 480 185 99 
2013 4526 4148 2673 2248 1967 1573 1402 1169 1272 884 770 548 631 160 99 
06'2014 2337 2003 1398 1089 886 809 722 607 601 422 385 295 281 62 48 
TB Cases
29 
DISTRIBUTION OF CDR ACCORDING TO STATES, 
50 
(JAN-JUNE, 2014) 
48 48 48 47 45 
44 44 43 42 41 40 39 39 
34 
44 
60 
50 
40 
30 
20 
10 
0 
% 
CDR (%) Target
PENCAPAIAN PEMERIKSAAN KONTAK TIBI PADA SARINGAN 
PERTAMA JAN-SEPT 2014 
NEGERI SASARAN PEMERIKSAAN 
KONTAK 
BIL KONTAK DIPERIKSA %PEMERIKSAAN KONTAK 
(>70%) 
JOHOR 14810 5574 38 
KEDAH 9160 2317 25 
KELANTAN 10330 8245 80 
MELAKA 4780 2575 54 
N. SEMBILAN 4510 2187 48 
PAHANG 6290 1623 26 
PERAK 11550 9822 85 
PERLIS 910 500 55 
P. PINANG 9040 3332 37 
SABAH 34630 26751 77 
SARAWAK 20930 14423 71 
SELANGOR 29130 32039 110 
TERENGGANU 5400 2313 43 
WPKL 13330 3385 25 
WP LABUAN 700 456 65 
MALAYSIA 174960 115542 66
TBHIV (%) IN TB CASES, MALAYSIA 
(2000- June,2014) 
No.of cases %TBHIV 
16 
12 
8 
4 
31 
11,945 
5.8 
692 
0 
25,000 
20,000 
15,000 
10,000 
5,000 
0 
No.TB Cases No.of new TB Cases with HIV Positive %TBHIV in TB cases
COHORT ANALYSIS AMONG MALAYSIAN 
(JAN-JUNE, 2013) 
NEGERI Sembuh 
(%) 
Sempurna 
(%) 
Terhenti (%) Gagal 
(%) 
Mati (%) Pindah 
Keluar& 
Hilang (%) 
Tukar 
Diagnosa 
(%) 
Masih 
Dalam 
Rawatan (%) 
JOHOR 406 (43.1) 354 (37.6) 21 (2.2) 0 101 (10.7) 9 (1) 17 (1.8) 33 (3.5) 
KEDAH 230 (43.6) 132 (25) 44 (8.3) 0 69 (13.1) 5 (0.9) 8 (1.5) 40 (7.6) 
KELANTAN 320 (45) 183 (25.7) 41 (5.8) 2 (0.3) 77 (10.8) 1 (0.1) 42 (5.9) 42 (5.9) 
MELAKA 134 (53) 65 (25.7) 10 (4.0) 0 25 (9.9) 0 6 (2.4) 13 (5.1) 
N.SEMBILAN 126 (44.1) 61 (21.3) 10 (3.5) 0 42 (14.7) 5 (1.7) 5 (1.7) 37 (12.9) 
PAHANG 181 (43.8) 104 (25.2) 19 (4.6) 0 64 (15.5) 2 (0.5) 9 (2.2) 34 (8.2) 
PERAK 349 (49.7) 184 (26.2) 38 (5.4) 0 82 (11.7) 6 (0.9) 26 (3.7) 17 (2.4) 
PERLIS 33 (45.8) 19 (26.4) 1(1.4) 0 11 (15.3) 2 (2.8) 1 (1.4) 5 (6.9) 
P.PINANG 269 (47.2) 178 (31.2) 25 (4.4) 0 69 (12.1) 3 (0.5) 20 (3.5) 6 (1.1) 
SABAH 940 (59.9) 365 (23.3) 39 (2.5) 2 (0.1) 124 (7.9) 20 (1.3) 25 (1.6) 54 (3.4) 
SARAWAK 601 (51.1) 364 (31) 23 (2) 3 (0.3) 116 (9.9) 2 (0.2) 47 (4.0) 20 (1.7) 
SELANGOR 617 (37.5) 461 (28) 69 (4.2) 0 113 (6.9) 15 (0.9) 15 (0.9) 268 (16.3) 
TERENGGANU 198 (50.6) 83 (21.2) 13 (3.3) 3 (0.8) 71 (18.2) 1(0.3) 3 (0.8) 19 (4.9) 
WPKL 118 (23.1) 158 (30.9) 38 (7.4) 0 38 (7.4) 6 (1.2) 1(0.2) 92 (18) 
WP LABUAN 15 (48.4) 7 (22.6) 3 (9.7) 0 3 (9.7) 0 1(3.2) 2 (6.5) 
MALAYSIA 4537 (46.3) 2718 (27.7) 394 (4.0) 10 (0.1) 1005 (10.3) 77 (0.8) 226 (2.3) 682 (7) 
32
TB CASES AND NOTIFICATION RATE (NR), 
PAHANG (2000 – Sept , 2014) 
Jan-Sept (2014) : 629 cases 
Jan-Sept (2013) : 688 cases 
52.2 
45.5 
49.3 
46.8 
45.2 
56.3 
61.2 
48.7 
51.5 
54.3 
51.2 50.8 
56.1 56.4 
100 
90 
80 
70 
60 
50 
40 
39.4 
64.7 
62.3 
58.7 
63.5 60.3 60.8 61.6 62.3 63.1 
63.5 
68 
72 
77 81 
80 
30 
20 
10 
0 
1600 
1400 
1200 
1000 
800 
600 
400 
200 
0 
2000 2001 2002 2003 2004 2005 2006 2007 2008 2009 2010 2011 2012 2013 9' 2014 
Bilangan Kes NR Pahang NR WHO NR Mal 
33
TB CASES BY DETECTION METHODS 
PAHANG 2008 – 2014 
91% 
90% 93% 94% 91% 91% 
2008 2009 2010 2011 2012 2013 
89% 
Jan-Sept 
2014 
1000 
800 
600 
400 
200 
0 
Saringan 26 32 20 23 35 29 21 
Aktif 37 53 40 23 48 48 48 
Pasif 669 753 748 742 797 807 560 
34
DOT COVERAGE IMPLEMENTED IN PAHANG 
(2009 – Aug.,2014) 
120 
100 
80 
60 
40 
20 
35 
99 99 
96 
98 
78.3 
2009 2010 2011 2012 2013 Jan-Ogos 2014 
1000 
900 
800 
700 
600 
500 
400 
300 
200 
100 
Jum. Kes 838 808 788 880 884 572 
% DOT 99 99 96 98 78.3 75 
% Sasaran DOT 95 95 95 95 95 95 
75 
0 
0
TBHIV (%) IN TB CASES, PAHANG 
(2009- Sept,2014) 
98.2% 98.0% 99.4% 99.7% 
838 808 
788 
880 
87.2% 
884 629 
16% 17% 18% 
15% 
82.9% 
12% 14% 
137 134 139 131 107 86 
120% 
100% 
80% 
60% 
40% 
20% 
0% 
1000 
900 
800 
700 
600 
500 
400 
300 
200 
100 
0 
2009 2010 2011 2012 2013 9' 2014 
No. Of TB Cases TBHIV Cases %TBHIV in TB Cases HIV Sreening In TB Cases36
TB HCW ACCORDING TO JOB CATEGORY (JAN-SEPT, 2014) 
DISTRICT MO PPP JT JM JTMP PPK 
Radio-grapher 
Pharm. 
Asst. 
PPKP Others Total 
Bentong 0 
Bera 0 
C.Highland’s 0 
Jerantut 1 1 
Lipis 1 1 
Kuantan 1 2 PTM & 
PAP 
3 
Maran 1 1 
Pekan 1 1 
Raub 1- PT 1 
Rompin 1 1 
Temerloh 2 2 
PAHANG 0 2 0 3 0 3 0 0 0 3 11 
37

konsep 3I

  • 1.
    PENGENALAN PROGRAM 3i 1.Intensified Case Finding 2.Isoniazid Prophylaxis Therapy 3.Infection Control for Tb
  • 2.
     Program yangdiadaptasi daripada saranan WHO  Meningkatkan pengesanan kes melalui saringan di kalangan golongan berisiko tinggi  Mengawal penularan penyakit tibi melalui kawalan infeksi  Mengurangkan risiko golongan berisiko dari mendapat penyakit tibi
  • 3.
  • 4.
    Intensified Case Findings(ICF) • Garispanduan WHO – “find as many cases as possible, as early as possible” – Systematic Screening of Active TB, 2013 – Facility Initiated • Inisiatif di peringkat negeri – ICF dalam Komuniti – TB Combi – HASRAT • Pekeliling daripada Program – IPT , pemeriksaan TB di kalangan pesakit HIV – Garispanduan Saringan Tibi di Penjara
  • 5.
    Isonazid Prophyalxis Therapy(IPT) TBHIV 2013 Malaysia - HIV-positive screened for TB 7017 - HIV-positive provided IPT 1220
  • 6.
    Infection Control (IC) • Garispanduan WHO – TB IC: from everybody’s problem to nobody’s business • Pekeliling daripada Program
  • 8.
  • 9.
  • 10.
    INTENSIFIED CASE FINDING(ICF) • Intensified Case Finding (ICF) is an activity, recommended by the WHO, intended to detect possible TB cases as early as possible among people living with HIV – usually by using a simple questionnaire for the signs and symptoms of TB. • ICF: Intensified Case Finding for TB means regularly screening all people with or at high risk of HIV or in congregate setting for the symptoms and signs of TB, followed promptly with diagnosis and treatment, and then doing the same for household contacts. November 17, 2014 MESY. TWG BIL 2/2014, CROWN GARDEN HOTEL, KELANTAN
  • 11.
    ICF Goals •Reduce morbidity and mortality  More intensive case-finding leads to fewer TB deaths and less severe post-TB complications  Focus on those most at risk of severe morbidity • Reduce TB transmission  General community  Institutional settings  Marginalised populations • Increase case-finding  Target high risk groups  Community-wide approach November 17, 2014 MESY. TWG BIL 2/2014, CROWN GARDEN HOTEL, KELANTAN
  • 12.
  • 13.
  • 14.
    November 17, 2014 MESY. TWG BIL 2/2014, CROWN GARDEN HOTEL, KELANTAN
  • 15.
    November 17, 2014 MESY. TWG BIL 2/2014, CROWN GARDEN HOTEL, KELANTAN
  • 16.
    ICF OPPORTUNITY •Screening of high risk groups Symptomatic out pt, PLHIV, Diabetes, HCW • Screening in institutions Prisons PUSPEN Old folk homes • Screening in community High prevalence TB locality November 17, 2014 MESY. TWG BIL 2/2014, CROWN GARDEN HOTEL, KELANTAN
  • 19.
    GARISPANDUAN SARINGAN TIBIDI PENJARA • Di terbitkan pada tahun 2006 dengan kerjasama Jabatan Penjara Malaysia • Bertujuan untuk meningkatkan pencegahan dan pengawalan penyakit Tibi di Institusi penjara • Meningkatkan promosi kesihatan di kalangan banduan dan kakitangan penjara • Masih digunapakai sehingga kini
  • 21.
    What factors determinethe yield and cost-effectiveness of ACF? Factor 1. TB prevalence among the target Higher prevalence – higher yield Factor 2. Diagnostic algorithms More comprehensive screening- higher cost &yield November 17, 2014 MESY. TWG BIL 2/2014, CROWN GARDEN HOTEL, KELANTAN
  • 22.
    November 17, 2014 MESY. TWG BIL 2/2014, CROWN GARDEN HOTEL, KELANTAN
  • 23.
    November 17, 2014 MESY. TWG BIL 2/2014, CROWN GARDEN HOTEL, KELANTAN
  • 24.
    ICF ACTIVITY I(3)T IDENTIFY TRAIN TRACE TREAT • Identify the localities with high burden of TB • Conduct training to the staff & community volunteers • House to house visit- TB screening & refer for positive symptoms • Ensure treatment is given for positive TB November 17, 2014 MESY. TWG BIL 2/2014, CROWN GARDEN HOTEL, KELANTAN
  • 25.
    ICF-PROCESS 1. Surveyyour data 2. Analyze -? High TB burden district- ? Localilities 3. Start planning your ICF project – - Approval fr. TKPK KA, PKD, Local leaders -Conduct meeting with local leaders -Design your action plan- Gantt chart, budgetting, training, ICF form 4. Conduct the training course 5. Start ICF- house to house visit, TB screening, refer positive symptoms to nearby clinic. 6. Writing the report November 17, 2014 MESY. TWG BIL 2/2014, CROWN GARDEN HOTEL, KELANTAN
  • 26.
    Syor 1) Pelaksanaangarispanduan sediaada diperkukuh 2) Revisit dan operasikan pekeliling /garispanduan di peringkat negeri dan daerah 3) Merangka tanggungjawab pelbagai stakehodler yang berkaitan
  • 27.
    TOP 5 COMMUNICABLEDISEASE, Disease MALAYSIA (2011- 2013) 2011 2012 2013 Incidence Rate Mortality Rate Incidence Rate Mortality Rate Incidence Rate Mortality Rate Dengue Fever 63.75 0 72.20 0 143.27 0.21 Tuberculosis 7 1 . 3 5 5.68 77.41 4.82 81.0 5.4 Hand, Food & 24.17 0 24.17 0 78.52 0.0 Mouth Diseases Food Poisoning 5 6 . 2 5 0.03 56.25 0.03 47.79 0.04 Malaria 18.32 0.06 16.11 0.05 1.30 0.01 Source: MOH 27 Note: *Incidence Rate was per 100,000 population except for Malaria per 10,000 population *Mortality Rate was per 100,000 population except for Malaria per 10,000 population
  • 28.
    28 DISTRIBUTION OFTB CASES BY STATE : (2011- JUNE, 2014) Sbh Sel Srk Jhr KL Prk Klt Kdh PP Phg Trg Mlk NS Pls Lbn 5000 4500 4000 3500 3000 2500 2000 1500 1000 500 0 2011 3794 3242 2056 2038 1907 1309 1448 1084 1126 788 667 511 449 141 106 2012 4426 3560 2430 2046 1906 1554 1436 1174 1245 890 733 546 480 185 99 2013 4526 4148 2673 2248 1967 1573 1402 1169 1272 884 770 548 631 160 99 06'2014 2337 2003 1398 1089 886 809 722 607 601 422 385 295 281 62 48 TB Cases
  • 29.
    29 DISTRIBUTION OFCDR ACCORDING TO STATES, 50 (JAN-JUNE, 2014) 48 48 48 47 45 44 44 43 42 41 40 39 39 34 44 60 50 40 30 20 10 0 % CDR (%) Target
  • 30.
    PENCAPAIAN PEMERIKSAAN KONTAKTIBI PADA SARINGAN PERTAMA JAN-SEPT 2014 NEGERI SASARAN PEMERIKSAAN KONTAK BIL KONTAK DIPERIKSA %PEMERIKSAAN KONTAK (>70%) JOHOR 14810 5574 38 KEDAH 9160 2317 25 KELANTAN 10330 8245 80 MELAKA 4780 2575 54 N. SEMBILAN 4510 2187 48 PAHANG 6290 1623 26 PERAK 11550 9822 85 PERLIS 910 500 55 P. PINANG 9040 3332 37 SABAH 34630 26751 77 SARAWAK 20930 14423 71 SELANGOR 29130 32039 110 TERENGGANU 5400 2313 43 WPKL 13330 3385 25 WP LABUAN 700 456 65 MALAYSIA 174960 115542 66
  • 31.
    TBHIV (%) INTB CASES, MALAYSIA (2000- June,2014) No.of cases %TBHIV 16 12 8 4 31 11,945 5.8 692 0 25,000 20,000 15,000 10,000 5,000 0 No.TB Cases No.of new TB Cases with HIV Positive %TBHIV in TB cases
  • 32.
    COHORT ANALYSIS AMONGMALAYSIAN (JAN-JUNE, 2013) NEGERI Sembuh (%) Sempurna (%) Terhenti (%) Gagal (%) Mati (%) Pindah Keluar& Hilang (%) Tukar Diagnosa (%) Masih Dalam Rawatan (%) JOHOR 406 (43.1) 354 (37.6) 21 (2.2) 0 101 (10.7) 9 (1) 17 (1.8) 33 (3.5) KEDAH 230 (43.6) 132 (25) 44 (8.3) 0 69 (13.1) 5 (0.9) 8 (1.5) 40 (7.6) KELANTAN 320 (45) 183 (25.7) 41 (5.8) 2 (0.3) 77 (10.8) 1 (0.1) 42 (5.9) 42 (5.9) MELAKA 134 (53) 65 (25.7) 10 (4.0) 0 25 (9.9) 0 6 (2.4) 13 (5.1) N.SEMBILAN 126 (44.1) 61 (21.3) 10 (3.5) 0 42 (14.7) 5 (1.7) 5 (1.7) 37 (12.9) PAHANG 181 (43.8) 104 (25.2) 19 (4.6) 0 64 (15.5) 2 (0.5) 9 (2.2) 34 (8.2) PERAK 349 (49.7) 184 (26.2) 38 (5.4) 0 82 (11.7) 6 (0.9) 26 (3.7) 17 (2.4) PERLIS 33 (45.8) 19 (26.4) 1(1.4) 0 11 (15.3) 2 (2.8) 1 (1.4) 5 (6.9) P.PINANG 269 (47.2) 178 (31.2) 25 (4.4) 0 69 (12.1) 3 (0.5) 20 (3.5) 6 (1.1) SABAH 940 (59.9) 365 (23.3) 39 (2.5) 2 (0.1) 124 (7.9) 20 (1.3) 25 (1.6) 54 (3.4) SARAWAK 601 (51.1) 364 (31) 23 (2) 3 (0.3) 116 (9.9) 2 (0.2) 47 (4.0) 20 (1.7) SELANGOR 617 (37.5) 461 (28) 69 (4.2) 0 113 (6.9) 15 (0.9) 15 (0.9) 268 (16.3) TERENGGANU 198 (50.6) 83 (21.2) 13 (3.3) 3 (0.8) 71 (18.2) 1(0.3) 3 (0.8) 19 (4.9) WPKL 118 (23.1) 158 (30.9) 38 (7.4) 0 38 (7.4) 6 (1.2) 1(0.2) 92 (18) WP LABUAN 15 (48.4) 7 (22.6) 3 (9.7) 0 3 (9.7) 0 1(3.2) 2 (6.5) MALAYSIA 4537 (46.3) 2718 (27.7) 394 (4.0) 10 (0.1) 1005 (10.3) 77 (0.8) 226 (2.3) 682 (7) 32
  • 33.
    TB CASES ANDNOTIFICATION RATE (NR), PAHANG (2000 – Sept , 2014) Jan-Sept (2014) : 629 cases Jan-Sept (2013) : 688 cases 52.2 45.5 49.3 46.8 45.2 56.3 61.2 48.7 51.5 54.3 51.2 50.8 56.1 56.4 100 90 80 70 60 50 40 39.4 64.7 62.3 58.7 63.5 60.3 60.8 61.6 62.3 63.1 63.5 68 72 77 81 80 30 20 10 0 1600 1400 1200 1000 800 600 400 200 0 2000 2001 2002 2003 2004 2005 2006 2007 2008 2009 2010 2011 2012 2013 9' 2014 Bilangan Kes NR Pahang NR WHO NR Mal 33
  • 34.
    TB CASES BYDETECTION METHODS PAHANG 2008 – 2014 91% 90% 93% 94% 91% 91% 2008 2009 2010 2011 2012 2013 89% Jan-Sept 2014 1000 800 600 400 200 0 Saringan 26 32 20 23 35 29 21 Aktif 37 53 40 23 48 48 48 Pasif 669 753 748 742 797 807 560 34
  • 35.
    DOT COVERAGE IMPLEMENTEDIN PAHANG (2009 – Aug.,2014) 120 100 80 60 40 20 35 99 99 96 98 78.3 2009 2010 2011 2012 2013 Jan-Ogos 2014 1000 900 800 700 600 500 400 300 200 100 Jum. Kes 838 808 788 880 884 572 % DOT 99 99 96 98 78.3 75 % Sasaran DOT 95 95 95 95 95 95 75 0 0
  • 36.
    TBHIV (%) INTB CASES, PAHANG (2009- Sept,2014) 98.2% 98.0% 99.4% 99.7% 838 808 788 880 87.2% 884 629 16% 17% 18% 15% 82.9% 12% 14% 137 134 139 131 107 86 120% 100% 80% 60% 40% 20% 0% 1000 900 800 700 600 500 400 300 200 100 0 2009 2010 2011 2012 2013 9' 2014 No. Of TB Cases TBHIV Cases %TBHIV in TB Cases HIV Sreening In TB Cases36
  • 37.
    TB HCW ACCORDINGTO JOB CATEGORY (JAN-SEPT, 2014) DISTRICT MO PPP JT JM JTMP PPK Radio-grapher Pharm. Asst. PPKP Others Total Bentong 0 Bera 0 C.Highland’s 0 Jerantut 1 1 Lipis 1 1 Kuantan 1 2 PTM & PAP 3 Maran 1 1 Pekan 1 1 Raub 1- PT 1 Rompin 1 1 Temerloh 2 2 PAHANG 0 2 0 3 0 3 0 0 0 3 11 37