Download as PDF, PPTX


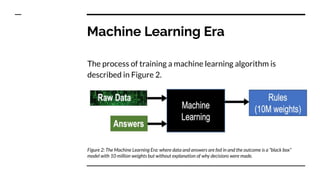


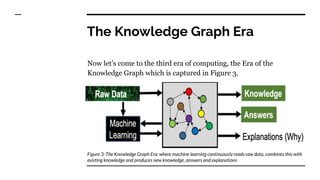
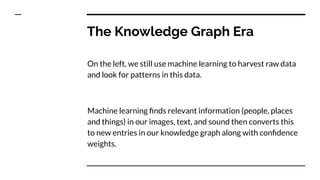


The document discusses the evolution of computing through three eras: the procedural era, where developers create step-by-step procedures; the machine learning era, characterized by training algorithms that function as black boxes; and the knowledge graph era, which integrates machine learning with existing knowledge to generate new insights and explanations. It highlights the limitations of traditional tabular data representations and emphasizes the importance of abstract representations in addressing complex data challenges. The knowledge graph era aims to facilitate continuous learning and knowledge synthesis from diverse raw data sources.