Downloaded 37 times


![Contact Information Email: [email_address] Web: http://www.mymathspace.net](https://image.slidesharecdn.com/livelyapps-091123163434-phpapp01/75/Lively-Applications-in-Precalculus-32-2048.jpg)

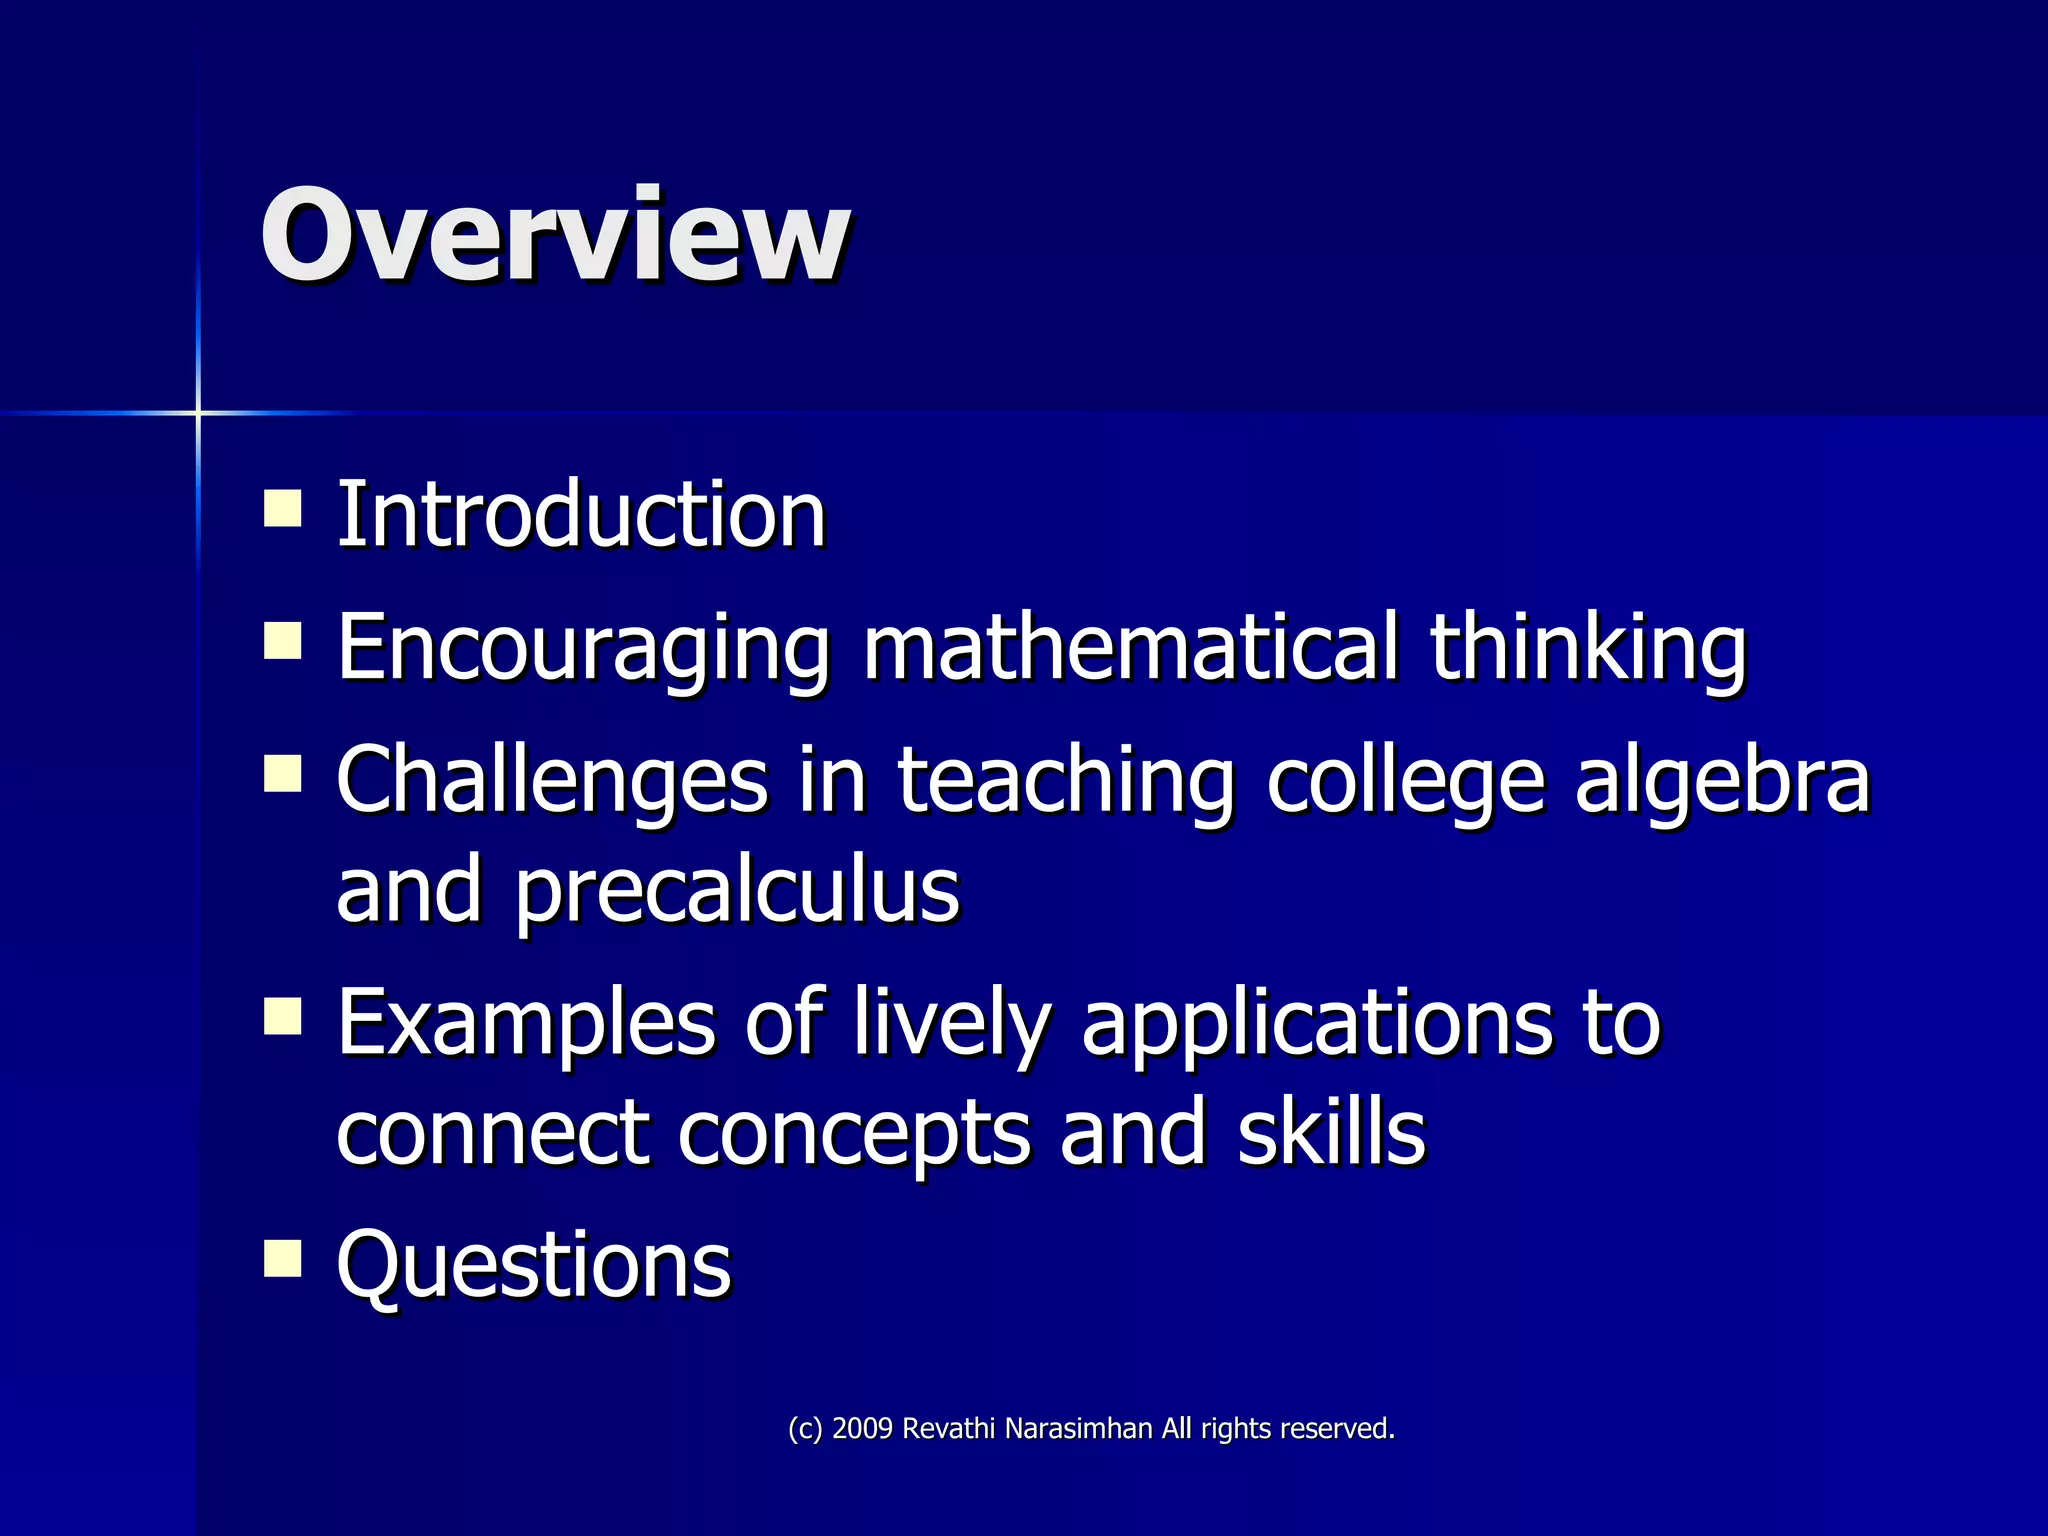
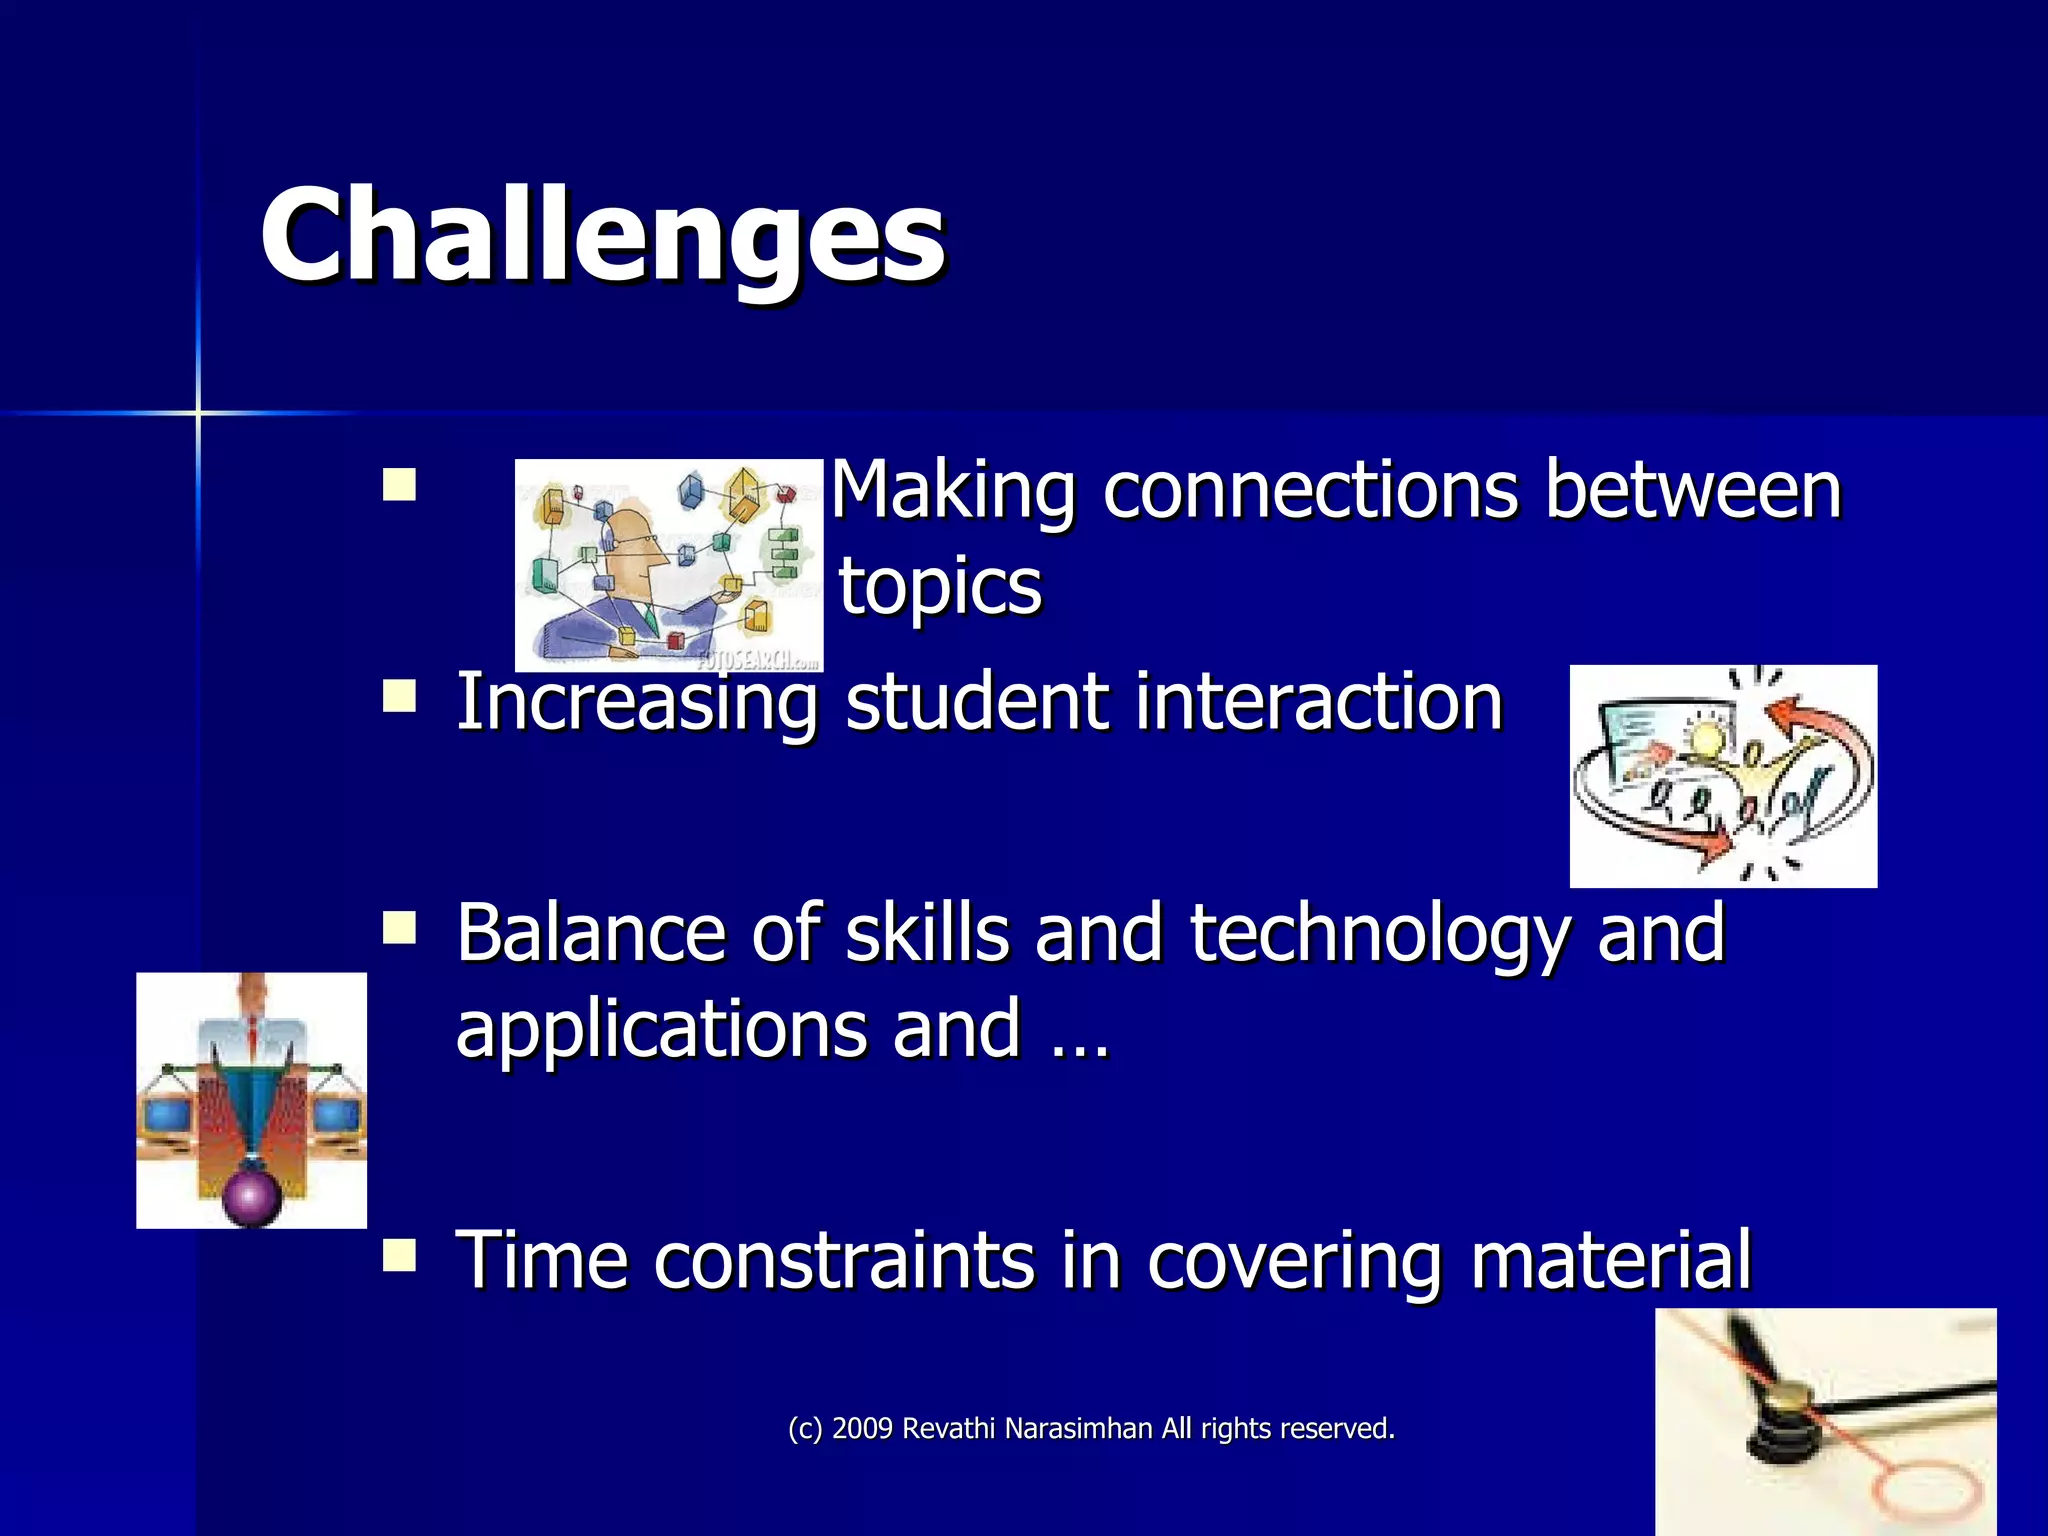
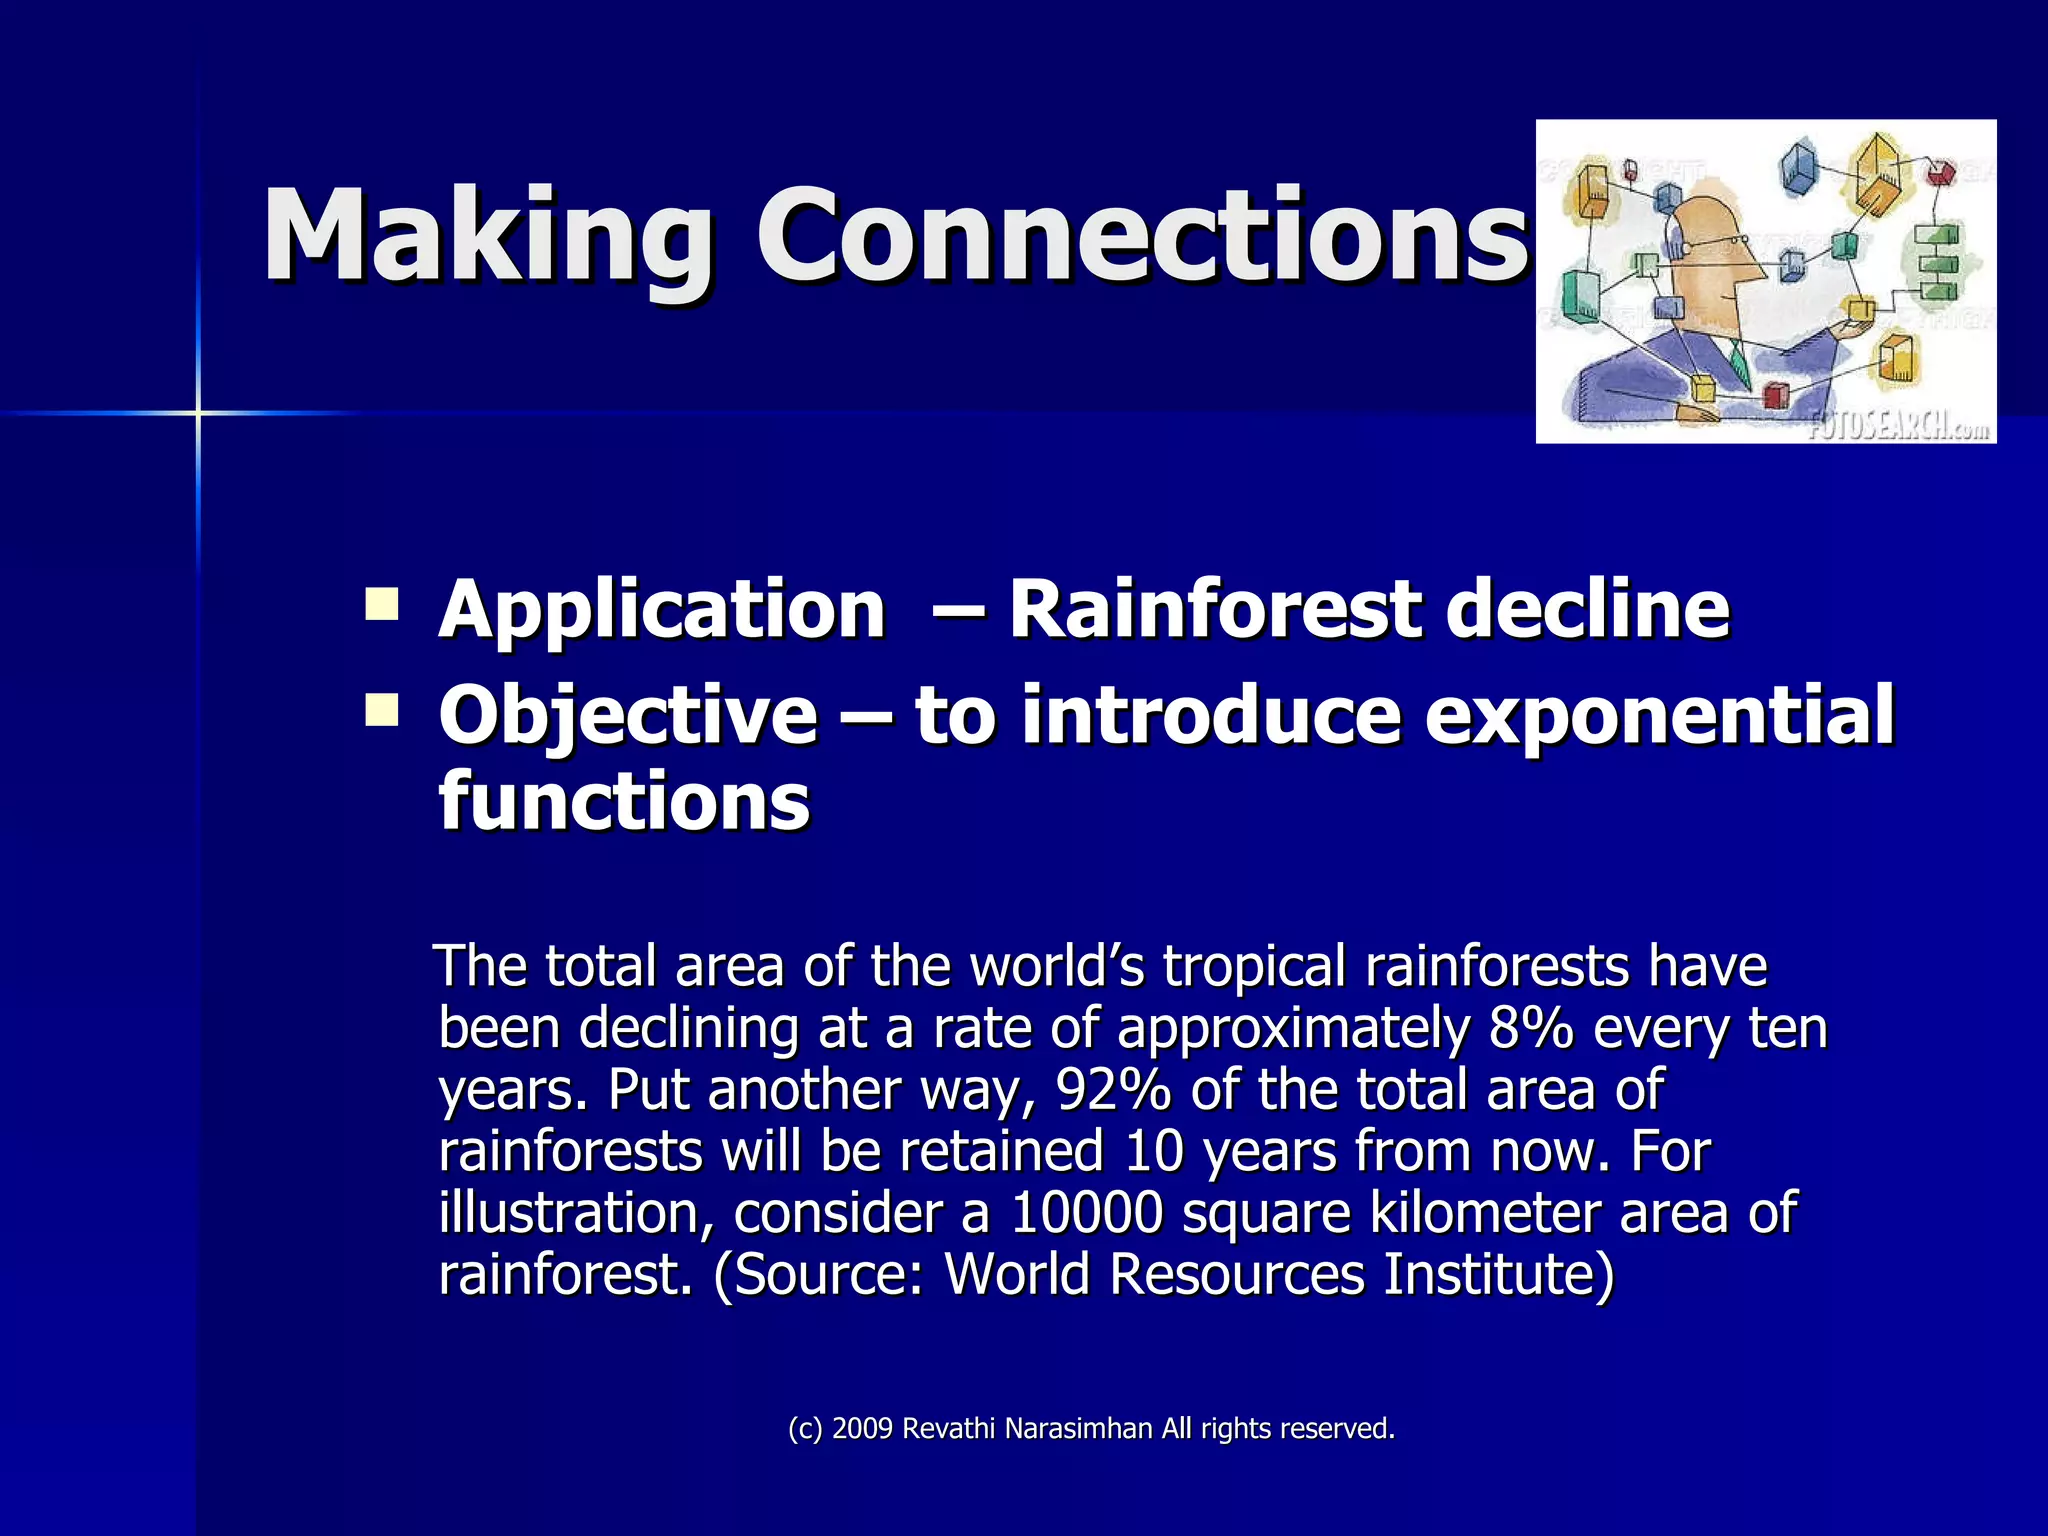
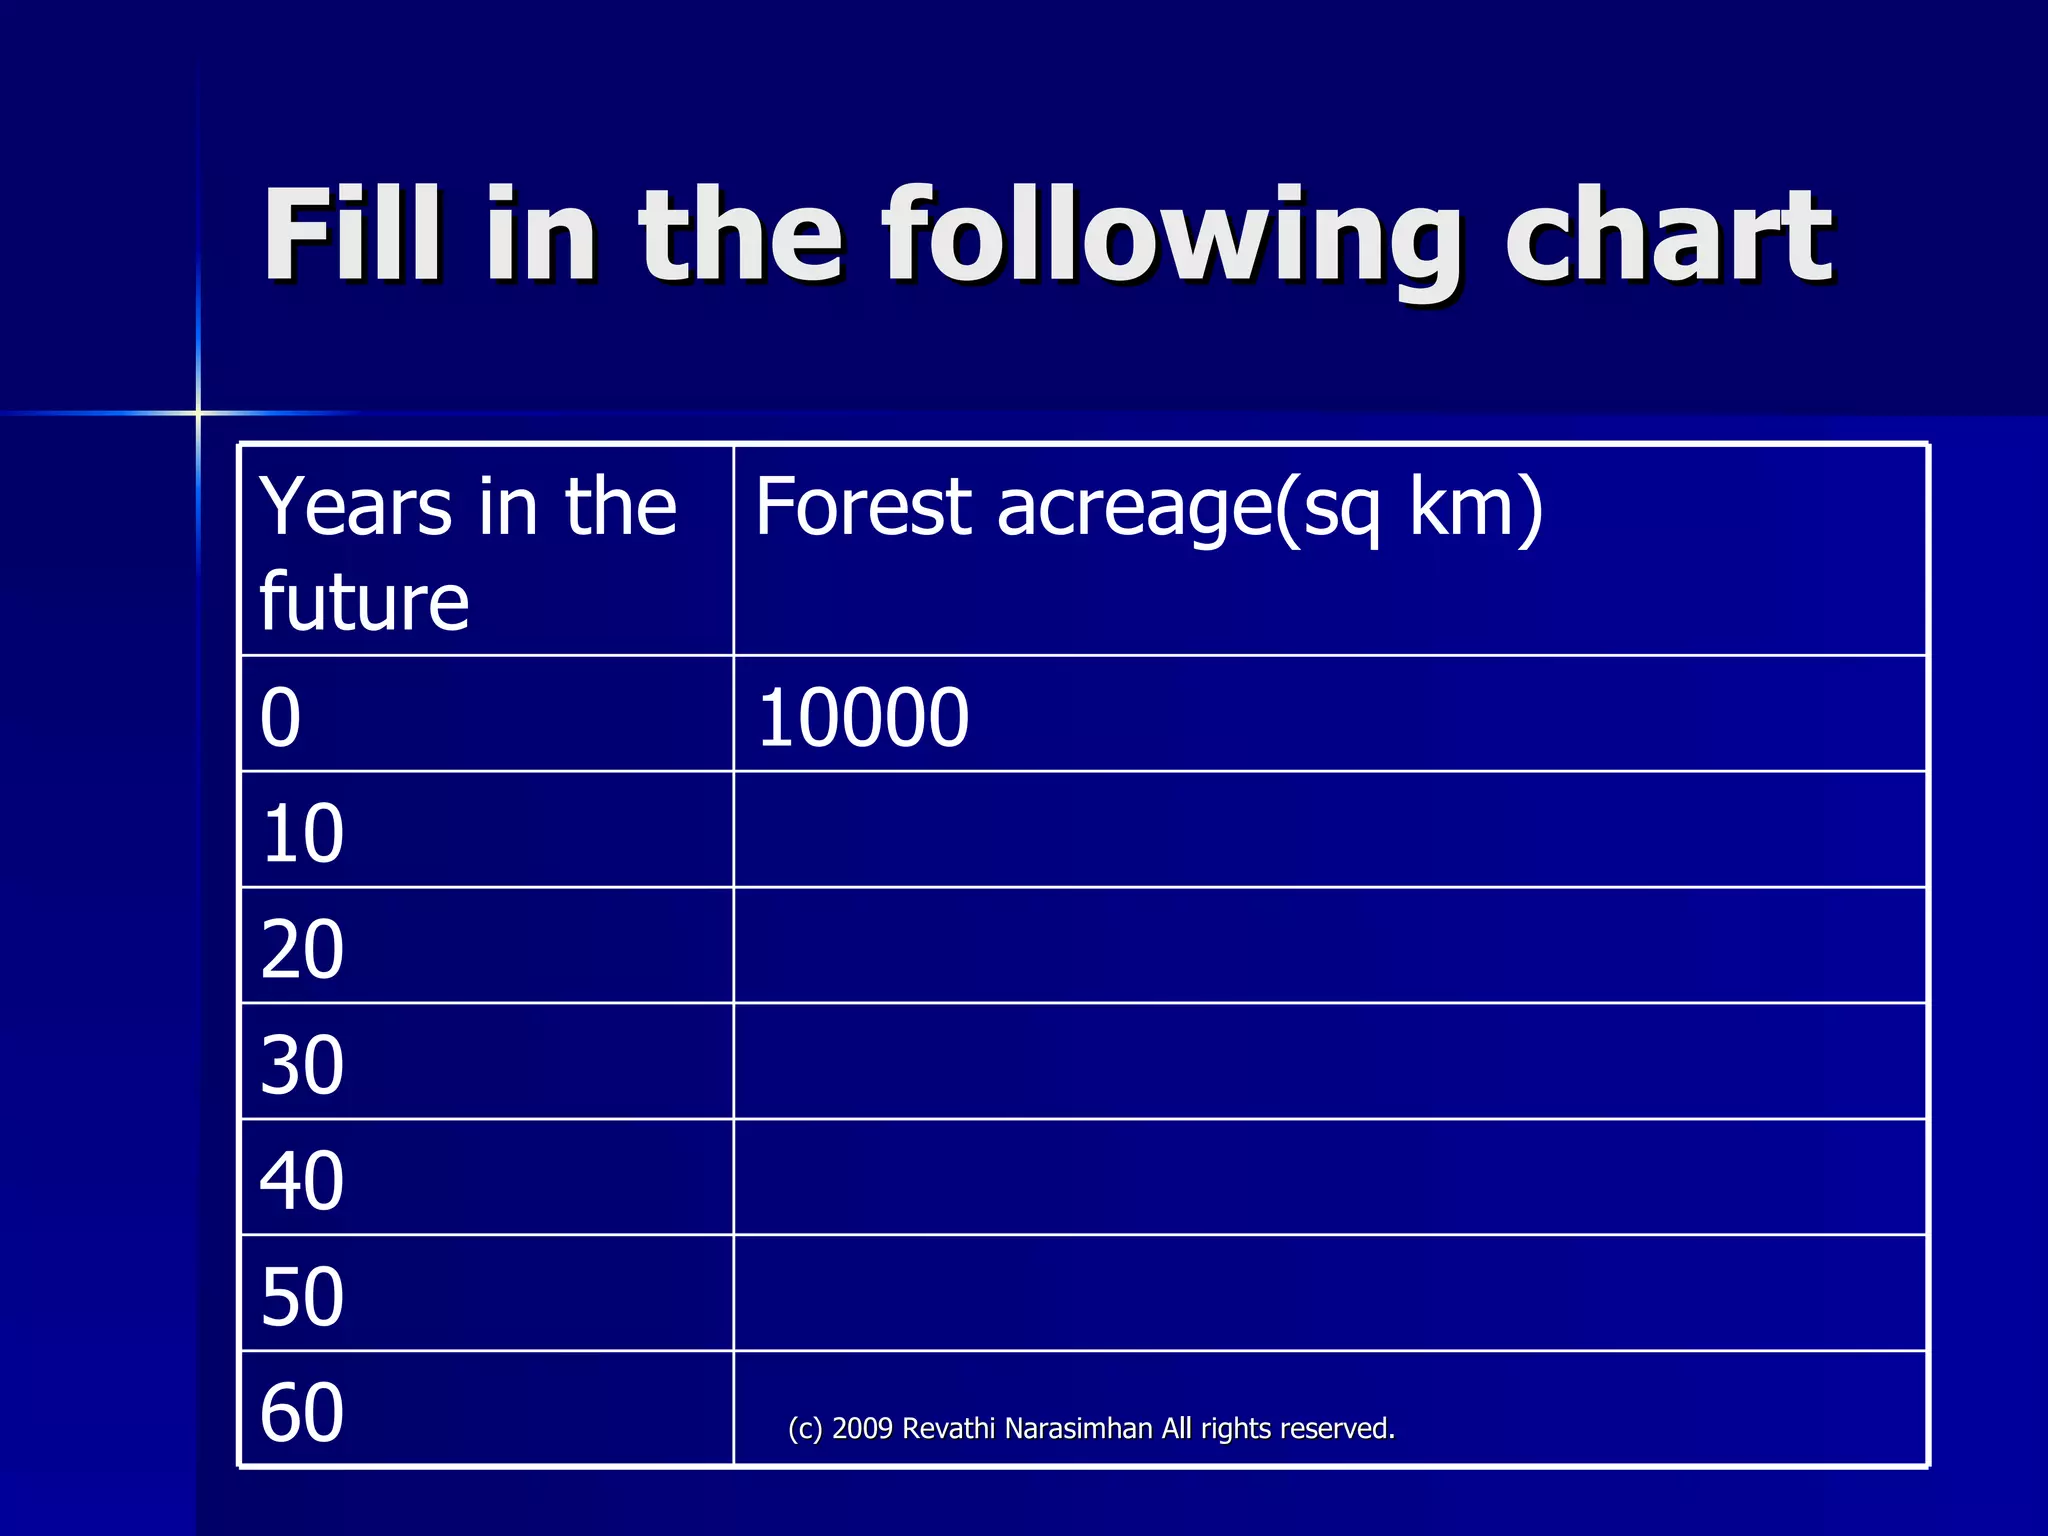
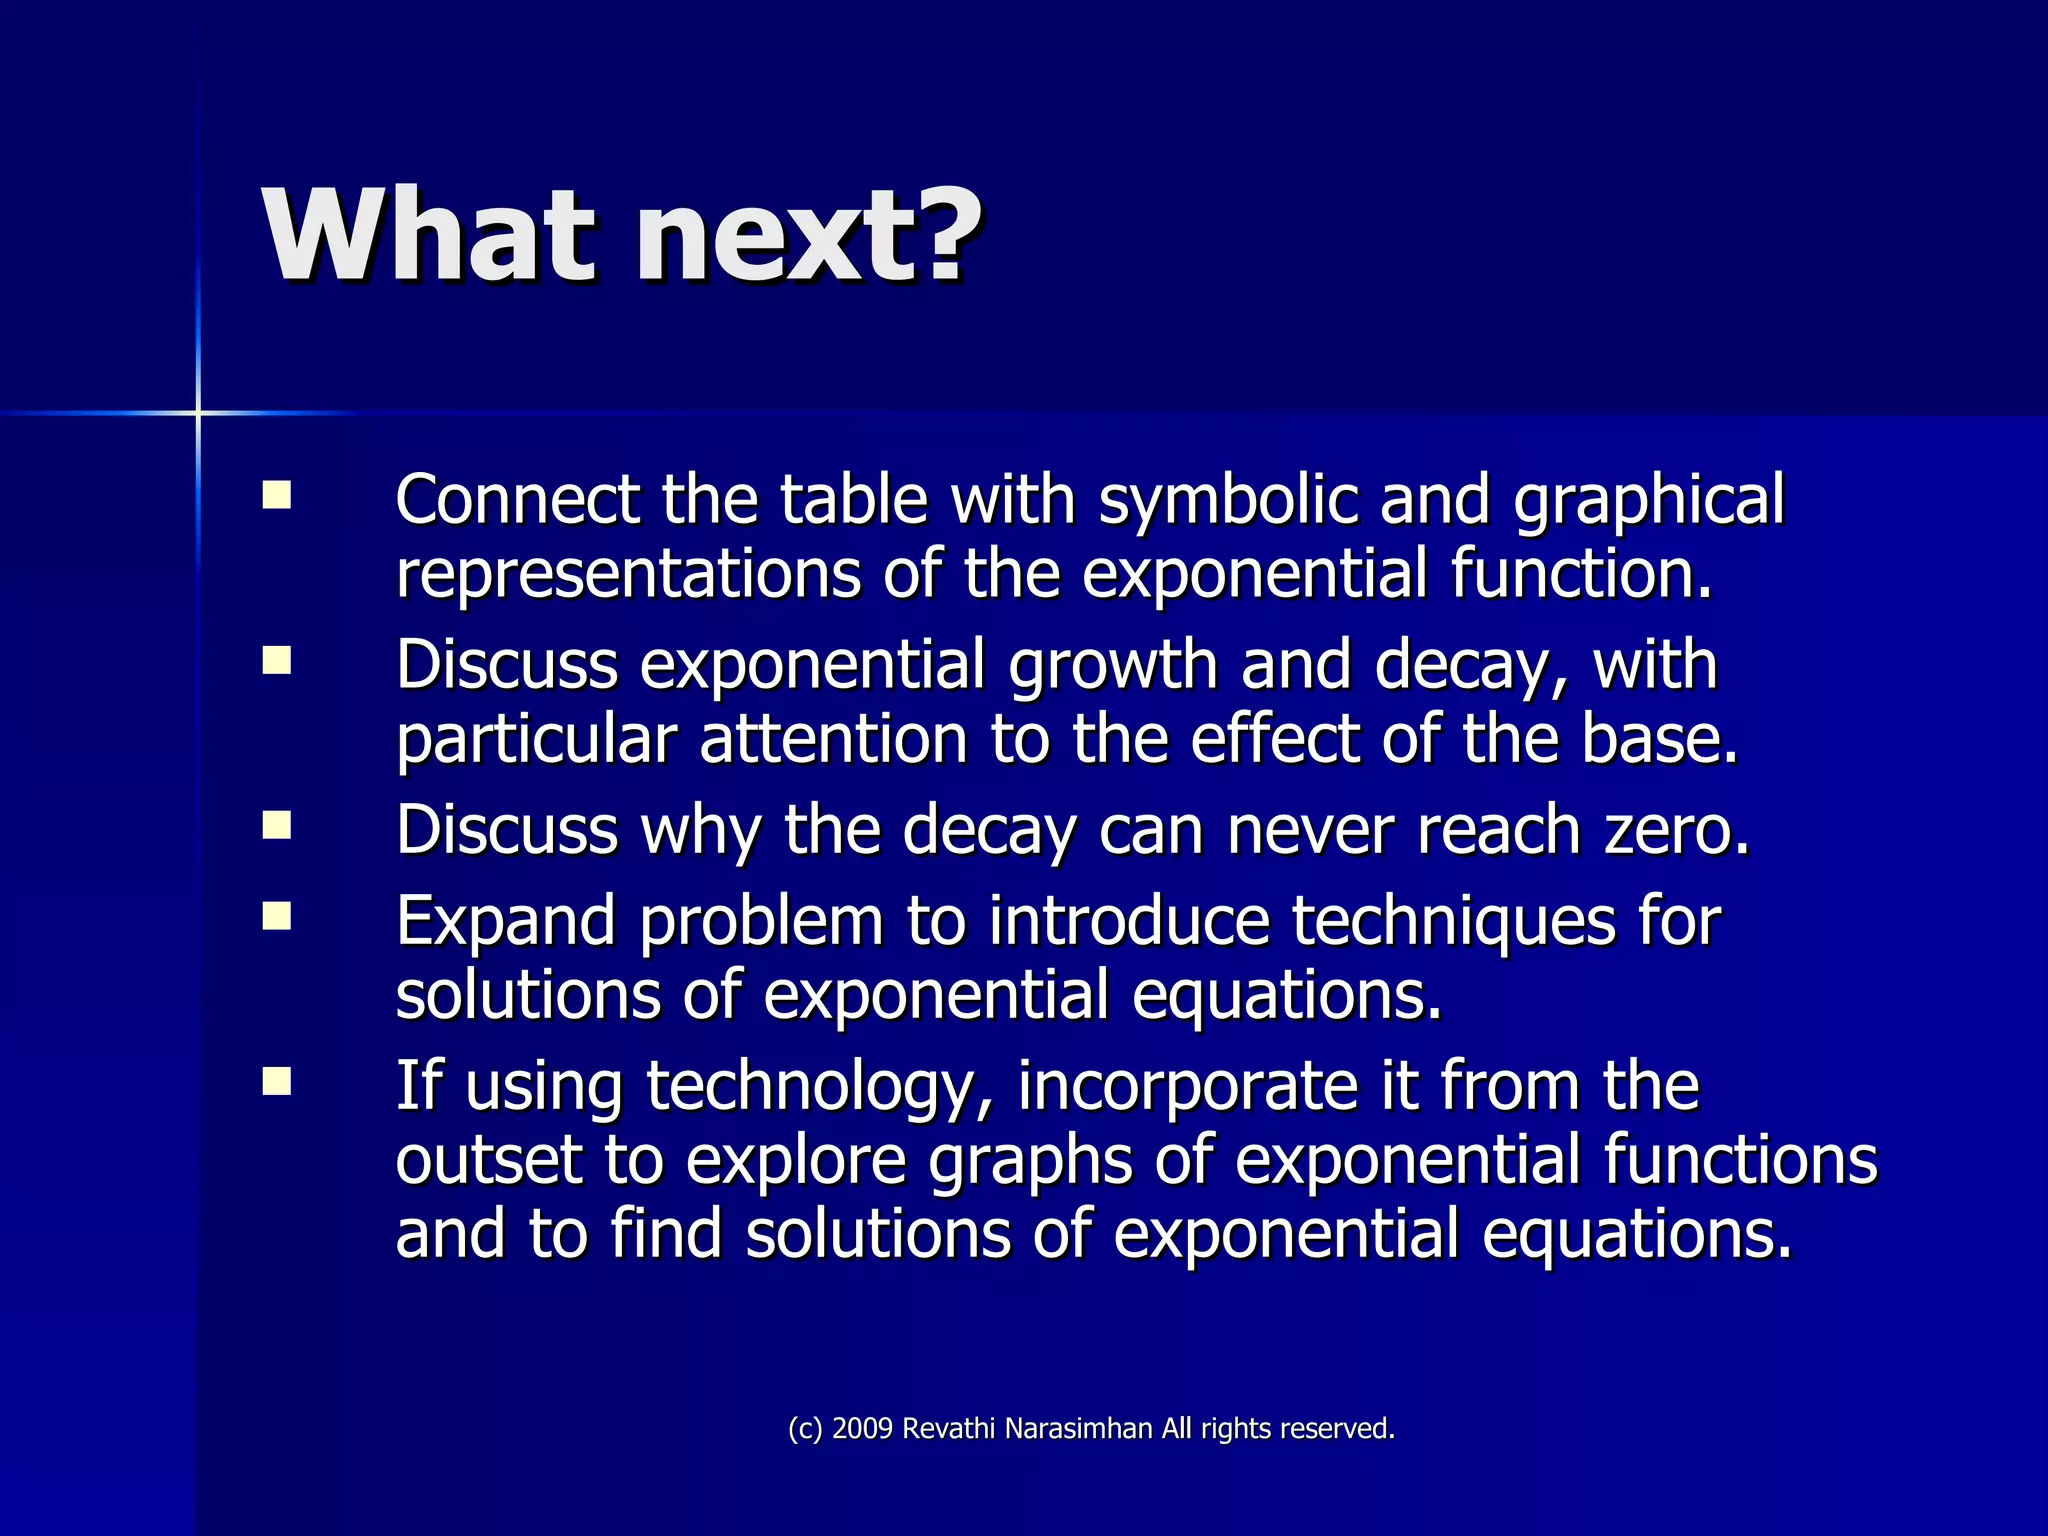
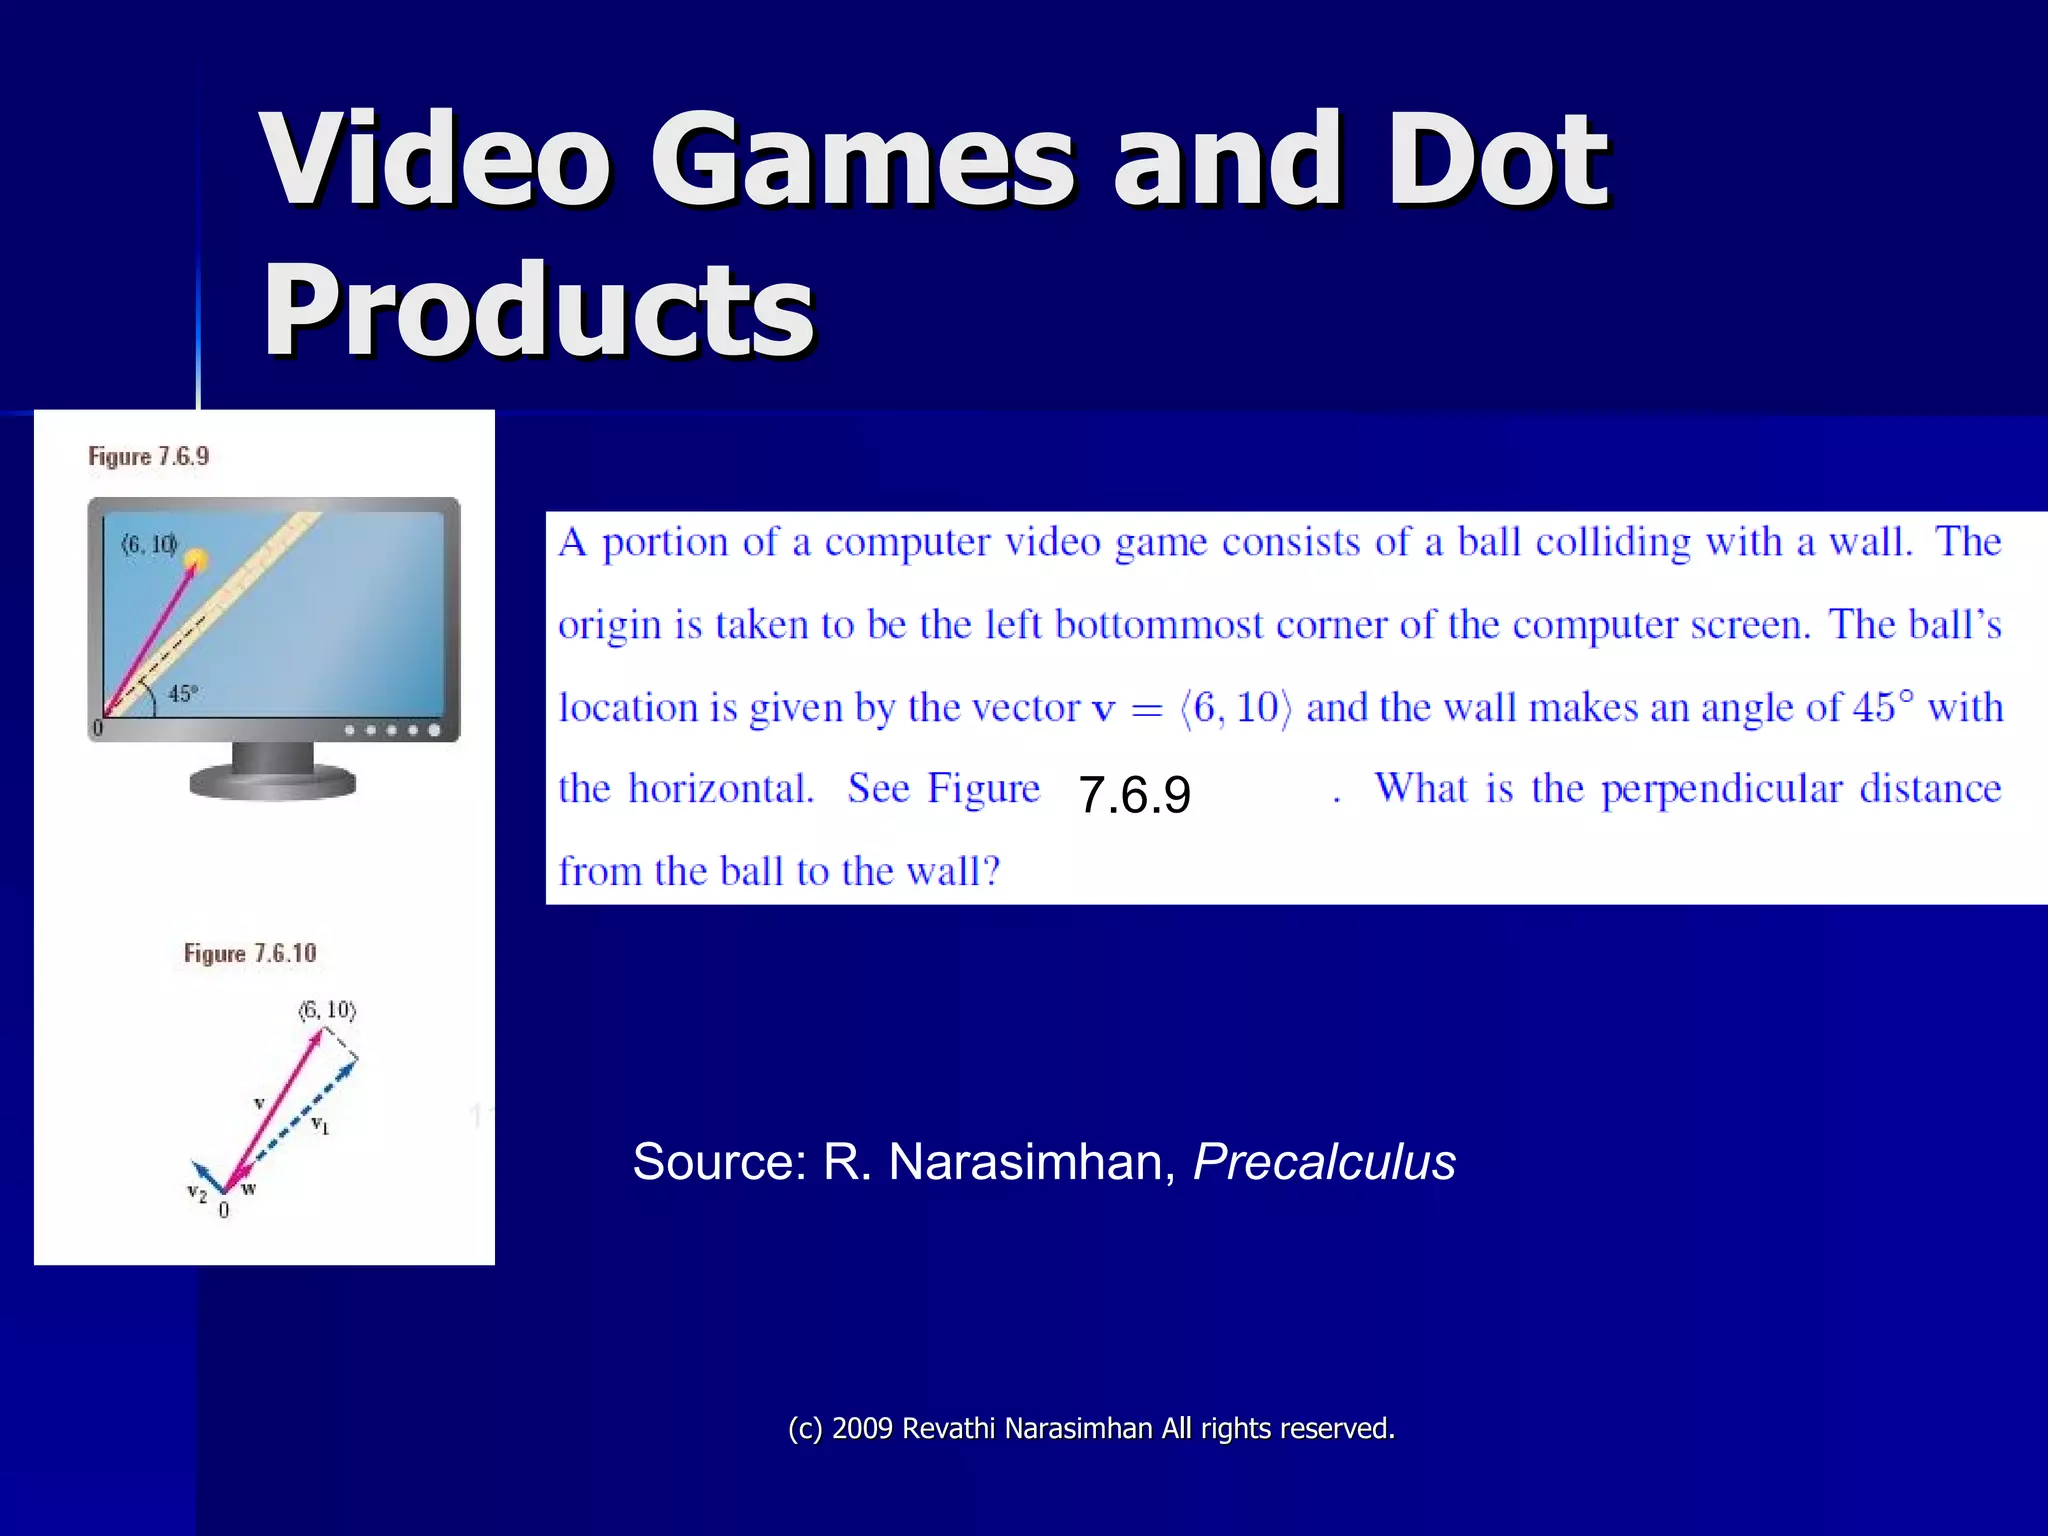
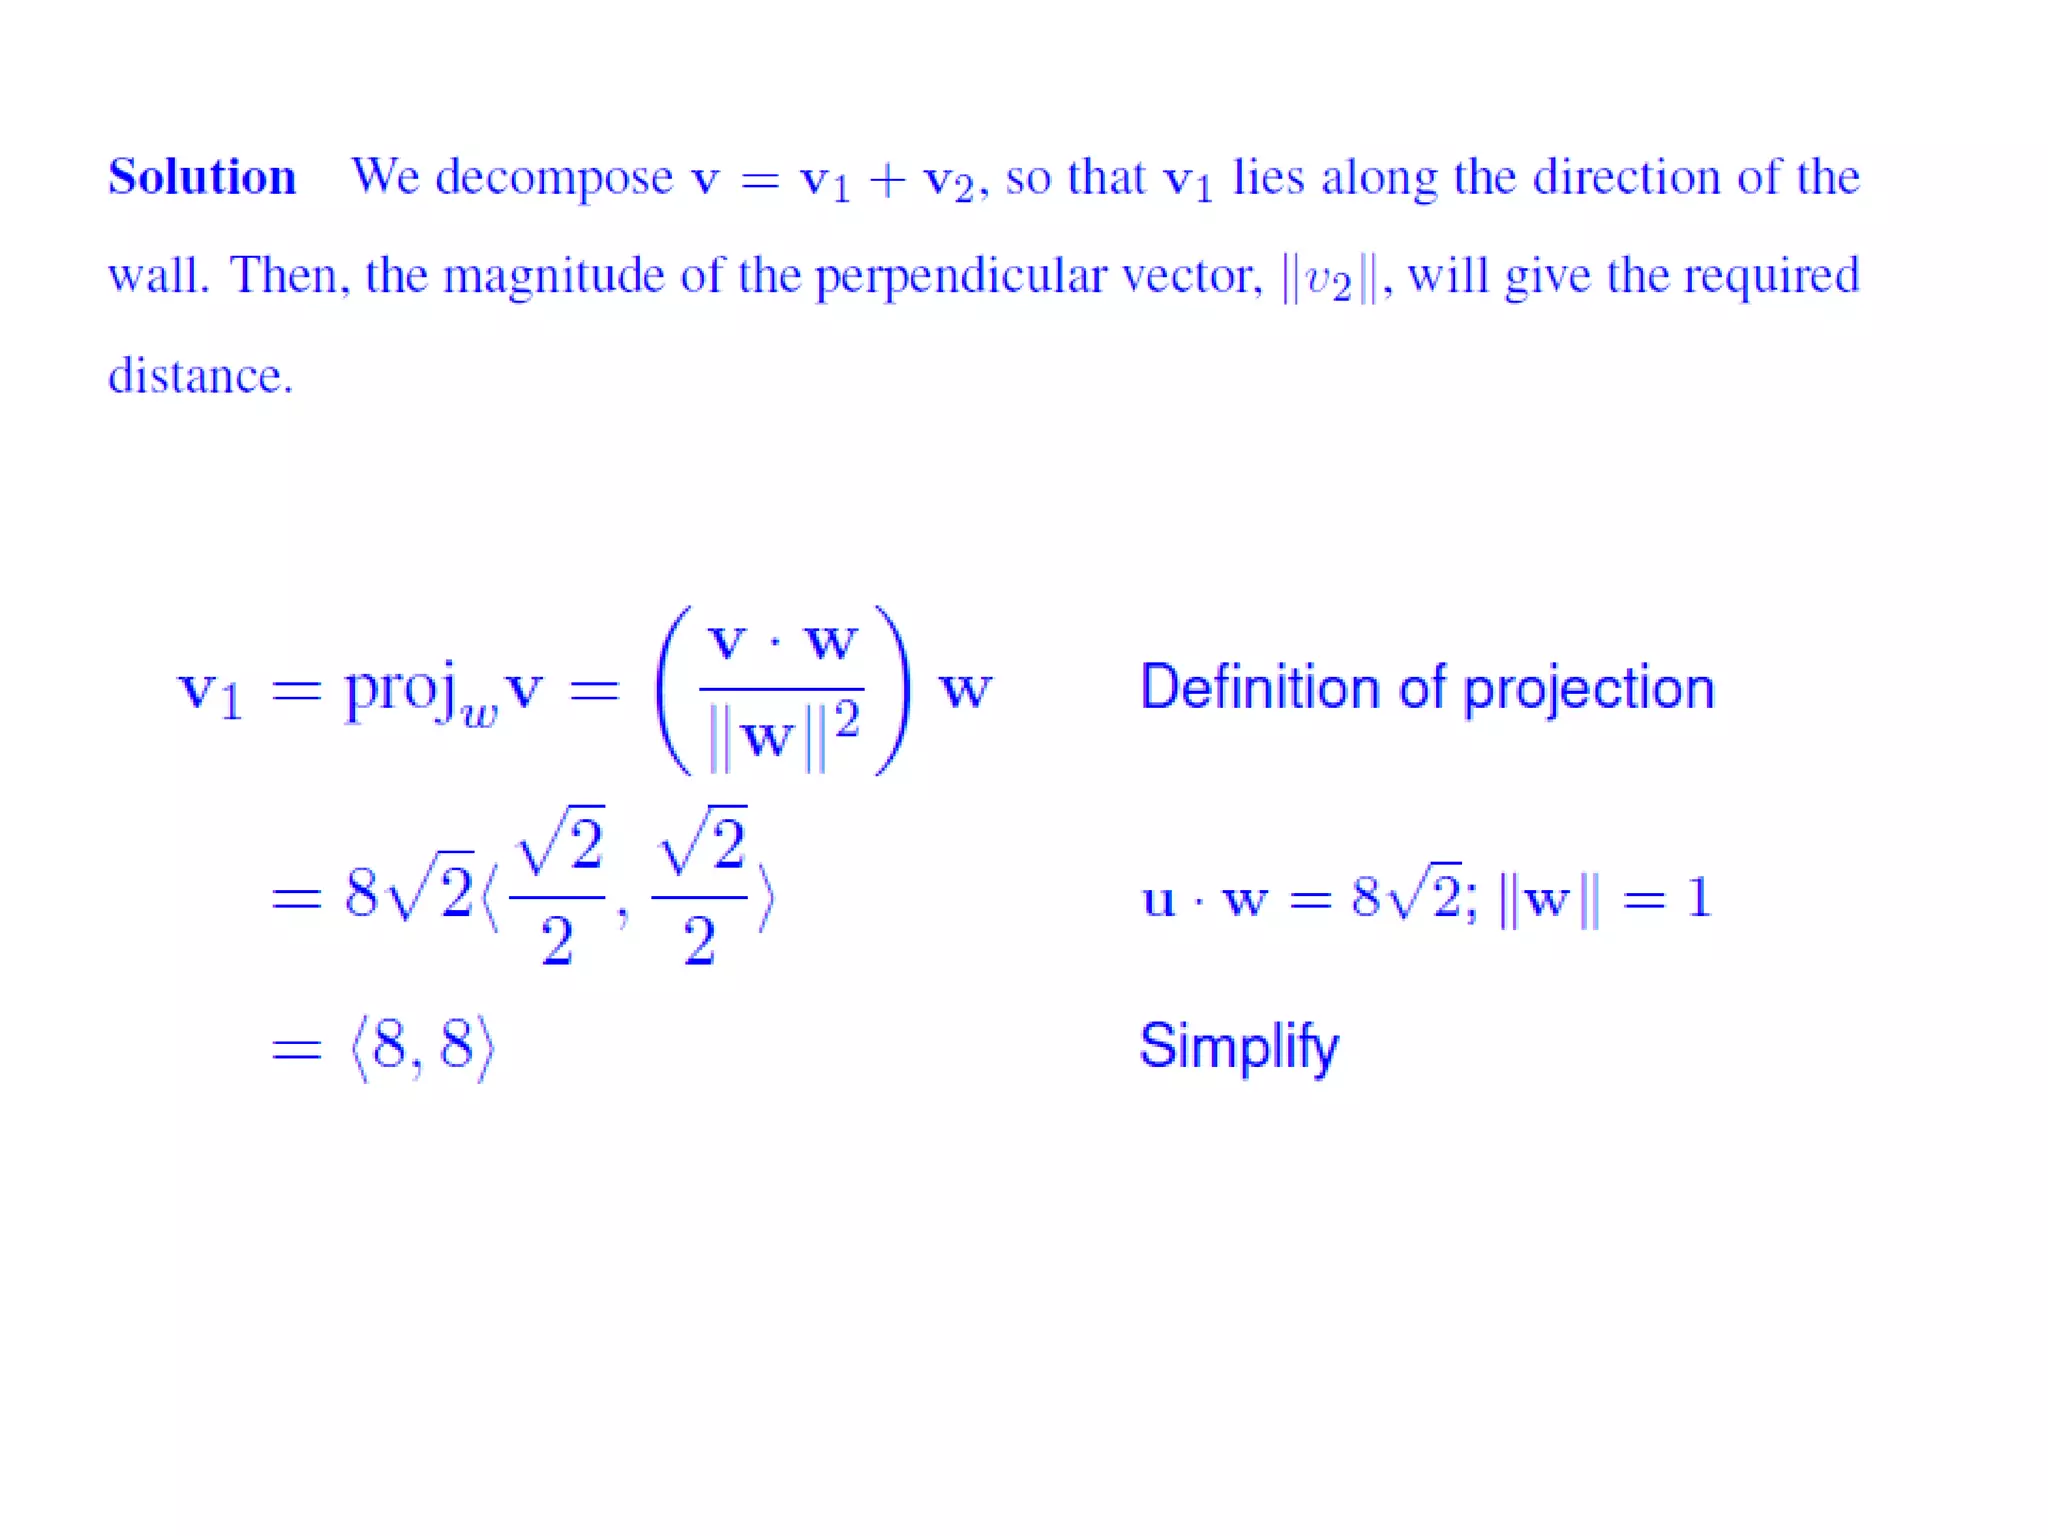
This document discusses using lively applications to introduce college algebra and precalculus topics. It provides examples of applications related to piecewise functions, exponential functions, and curve fitting. These examples start with a real-world context to engage students and introduce new concepts. The document emphasizes using applications to encourage mathematical thinking, make connections between topics, and balance conceptual understanding with skills and technology.