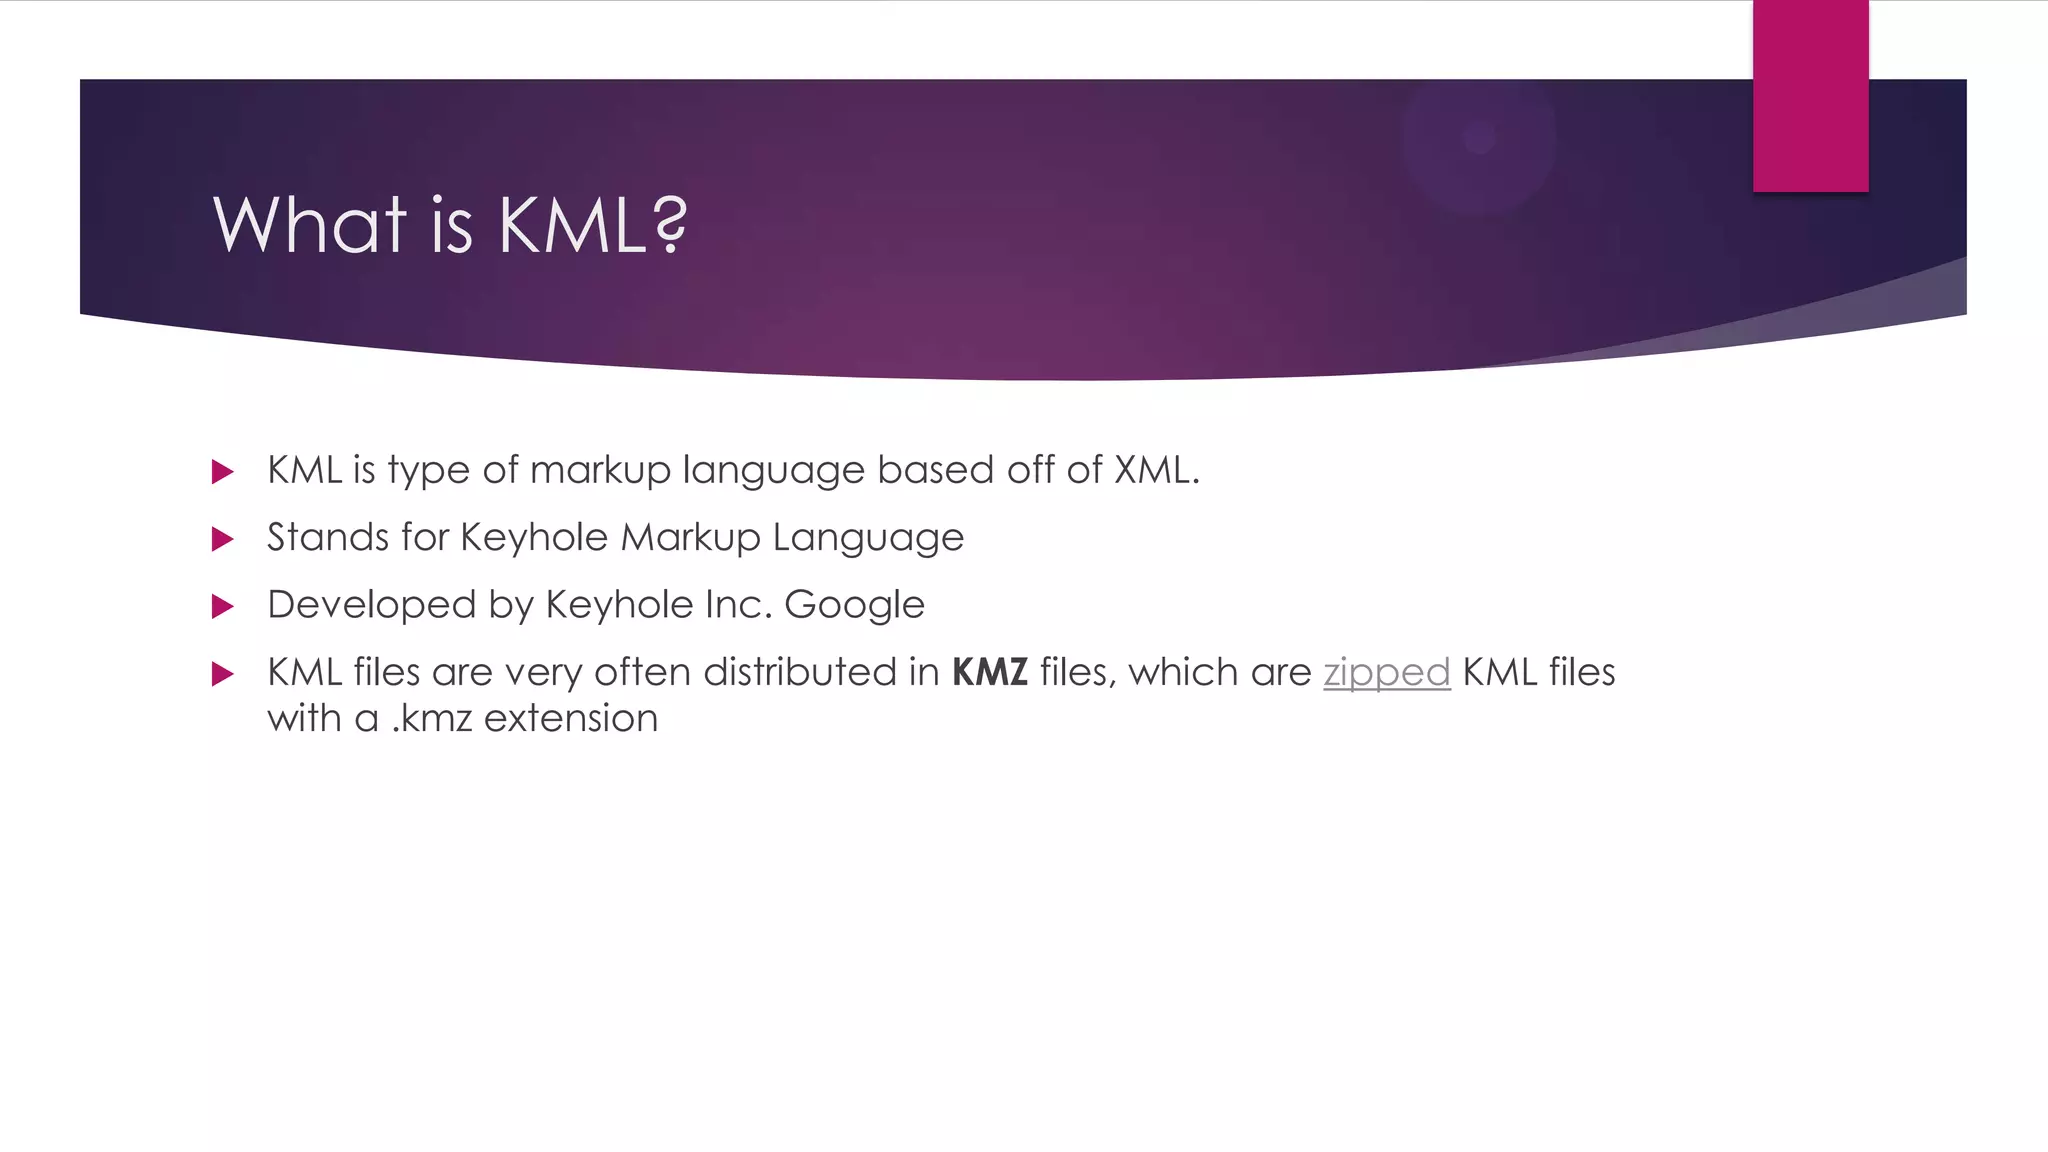
Keyhole Markup Language (KML) is an XML notation for expressing geographic annotation and visualization within Internet-based, two-dimensional maps and three-dimensional Earth browsers.
Serving earth observation data with GeoServer: addressing real world requirem...GeoSolutions
The presentation will cover GeoSolutions experience in setting up GeoServer based production systems providing access to earth observation products, with indications of technical challenges, solutions, and deployment suggestion. The presentations will cover topics such as setting up a single unified mosaic from all the available data sources, tailoring access to it to different users, determining the most appropriate stacking order, dealing with multiresolution, different coordinate systems, multiband data, SAR integration, searching for the most appropriate products using a mix of WFS, CSW and so on, serving imagery with high performance WMS and WMTS, performing small and large data extractions with WCS and WPS, closing up with deployment examples and suggestions.
XML: Introduction- Revolutions of XML-XML Basics
Defining XML Documents: DTD-XML Schema-Namespaces
XFiles: XLink – XPointer - XPath
XSL Technologies: XML with XSL (XSLT)– XSL-FO
Parsing XML using DOM - SAX - Integrating XML with database
Formatting XML on the web.
Resumo MoReq-Jus - Modelo de Requisitos para Sistemas Informatizados de Gestã...lucianobb
O Modelo de Requisitos para Sistemas Informatizados de Gestão de Processos e Documentos do Judiciário brasileiro (MoReq-Jus) estabelece condições a serem cumpridas na produção, na tramitação, na guarda, no armazenamento, na preservação, no arquivamento ou no recebimento de documentos, pelos sistemas de gestão de processos e documentos digitais, não-digitais ou híbridos, a fim de garantir a sua confiabilidade e autenticidade, assim como o seu acesso.
O MoReq-Jus estabelece processos e requisitos mínimos para um Sistema Informatizado de Gestão de Processos e Documentos (GestãoDoc), independentemente da plataforma tecnológica em que for desenvolvido e implantado.
DEFINITION :
GIS is a powerful set of tools for collecting, storing , retrieving at will, transforming and displaying spatial data from the real world for a particular set of purposes
APPLICATION AREAS OF GIS
Agriculture
Business
Electric/Gas utilities
Environment
Forestry
Geology
Hydrology
Land-use planning
Local government
Mapping
11. Military
12. Risk management
13. Site planning
14. Transportation
15. Water / Waste water industry
COMPONENTS OF GIS
DATA INPUT
SPATIAL DATA MODEL
Data Model:
It describes in an abstract way how the data is represented in an information system or in DBMS
Spatial Data Model :
The models or abstractions of reality that are intended to have some similarity with selected aspects of the real world
Creation of analogue and digital spatial data sets involves seven levels of model development and abstraction
SPATIAL DATA MODEL
Conceptual model : A view of reality
Analog model : Human conceptualization leads to analogue abstraction
Spatial data models : Formalization of analogue abstractions without any conventions
Database model : How the data are recorded in the computer
Physical computational model : Particular representation of the data structures in computer memory
Data manipulation model : Accepted axioms and rules for handling the data
SPATIAL DATA MODEL
SPATIAL DATA MODEL
Objects on the earth surface are shown as continuous and discrete objects in spatial data models
Types of data models
Raster data model
vector data models
RASTER DATA MODEL
Basic Elements :
Extent
Rows
Columns
Origin
Orientation
Resolution: pixel = grain = grid cell
Ex: Bit Map Image (BMP),Joint Photographic Expert Group (JPEG), Portable Network Graphics(PNG) etc
RASTER DATA MODEL
VECTOR DATA MODEL
Basic Elements:
Location (x,y) or (x,y,z)
Explicit, i.e. pegged to a coordinate system
Different coordinate system (and precision) require different values
o e.g. UTM as integer (but large)
o Lat, long as two floating point numbers +/-
Points are used to build more complex features
Ex: Auto CAD Drawing File(DWG), Data Interchange(exchange) File(DXF), Vector Product Format (VPF) etc
VECTOR DATA MODEL
RASTER vs VECTORRaster is faster but Vector is corrector
TESSELLATIONS OF CONTINUOUS FIELDS
Triangular Irregular Network: (TIN)
TIN is a vector data structure for representing geographical information that is continuous
Digital elevation model
TIN is generally used to create Digital Elevation Model (DEM)
DIGITAL ELEVATION MODEL
DATA STRUCTURES
Data structure tells about how the data is stored
Data organization in raster data structures
Each cell is referenced directly
Each overlay Is referenced directly
Each mapping unit is referenced directly
Each overlay is separate file with general header
Mumbai University, T.Y.B.Sc.(I.T.), Semester VI, Principles of Geographic Information System, USIT604, Discipline Specific Elective Unit 1: Introduction to GIS
Prepared as part of the IT for Business Intelligence course of MBA @VGSOM, IIT Kharagpur. The tutorial describes how to represent vector data on a map using the open source software QGIS.
A presentation and workshop presented at the 2009 Annual Conference of the American Planning Association, New Jersey Chapter. Originally presented at the Bloustein School, Rutgers-New Brunswick. Workshop materials available at http://njgeo.org/presentations/
It is a handbook of UMTS/WCDMA call flows for Handovers.
This document is originally edited by Justin MA and it is free to share to everyone who are interested.
All reference/resource are from internet. If there is any copy-right issue, please kindly inform Justin by majachang@gmail.com.
Thanks for your reading!
This slide is contributed by Wang Yaohui for Linkou Senior High school (LKSH) students.
Every teacher is welcome to use it if they want their students to create their KML project.
Please email me if you need the PPT file. Then I can send it to you.
Wang yaohui
Taipei 10 April 2007
Managing Spatial Data for Telecommunications Using FMESafe Software
Presented by Darren Sutton of Telus
Abstract:
TELUS' Geomatics group has been managing spatial data from multiple sources for over a decade using FME. FME allows us to compile data in different formats into a repository and supports our data analysis, web-based GIS and cartography services.
Optimizing Rail Data for Google Earth MashupSafe Software
Presented by Lawrence Chong of Transport Canada
Abstract:
Displaying a huge data set for Google Earth can be a challenge. The data must be properly processed for efficient display. Using FME, the KML output is structured using grouping, networklink, tiling and region for optimization.
First unit lecture for John Reiser's GIS II course offered Spring 2011 at Rowan University, Glassboro, NJ.
Materials are released under a CC BY-NC-SA 3.0 license: http://creativecommons.org/licenses/by-nc-sa/3.0/
Mappetizer "Tourist Info", "City Info", and "Travel Diary" are SVG based web mapping applications, which directly can display GPS data (GPX files).
How to create an interactive map with Leaflet.pdfRakesh Purbey
Learn how to create an interactive map using Leaflet, a powerful JavaScript library. Follow our step-by-step guide to build captivating maps for your website, enhance user engagement, and drive traffic.
Start ArcCatalog or ArcMap and open the Catalog window.
Create a connection to your database.
Right-click the table, point to New, and click Feature Class.
Type a name for the feature class.
Delivered by Peter Siebert, GIS Applications Developer at Harvard University Planning Office (UPO), on December 9th, 2009 in Lamont Library, Forum Room.
HSLayers (Help Service + OpenLayers) combines capabilities of ExtJS and OpenLayers and several helping scripts to establish truly Web GIS applications. Development started in 2007. In 2009, after 2 years of development, it was released under conditions of GNU General Public License 3.
UiPath Test Automation using UiPath Test Suite series, part 3DianaGray10
Welcome to UiPath Test Automation using UiPath Test Suite series part 3. In this session, we will cover desktop automation along with UI automation.
Topics covered:
UI automation Introduction,
UI automation Sample
Desktop automation flow
Pradeep Chinnala, Senior Consultant Automation Developer @WonderBotz and UiPath MVP
Deepak Rai, Automation Practice Lead, Boundaryless Group and UiPath MVP
JMeter webinar - integration with InfluxDB and GrafanaRTTS
Watch this recorded webinar about real-time monitoring of application performance. See how to integrate Apache JMeter, the open-source leader in performance testing, with InfluxDB, the open-source time-series database, and Grafana, the open-source analytics and visualization application.
In this webinar, we will review the benefits of leveraging InfluxDB and Grafana when executing load tests and demonstrate how these tools are used to visualize performance metrics.
Length: 30 minutes
Session Overview
-------------------------------------------
During this webinar, we will cover the following topics while demonstrating the integrations of JMeter, InfluxDB and Grafana:
- What out-of-the-box solutions are available for real-time monitoring JMeter tests?
- What are the benefits of integrating InfluxDB and Grafana into the load testing stack?
- Which features are provided by Grafana?
- Demonstration of InfluxDB and Grafana using a practice web application
To view the webinar recording, go to:
https://www.rttsweb.com/jmeter-integration-webinar
Essentials of Automations: Optimizing FME Workflows with ParametersSafe Software
Are you looking to streamline your workflows and boost your projects’ efficiency? Do you find yourself searching for ways to add flexibility and control over your FME workflows? If so, you’re in the right place.
Join us for an insightful dive into the world of FME parameters, a critical element in optimizing workflow efficiency. This webinar marks the beginning of our three-part “Essentials of Automation” series. This first webinar is designed to equip you with the knowledge and skills to utilize parameters effectively: enhancing the flexibility, maintainability, and user control of your FME projects.
Here’s what you’ll gain:
- Essentials of FME Parameters: Understand the pivotal role of parameters, including Reader/Writer, Transformer, User, and FME Flow categories. Discover how they are the key to unlocking automation and optimization within your workflows.
- Practical Applications in FME Form: Delve into key user parameter types including choice, connections, and file URLs. Allow users to control how a workflow runs, making your workflows more reusable. Learn to import values and deliver the best user experience for your workflows while enhancing accuracy.
- Optimization Strategies in FME Flow: Explore the creation and strategic deployment of parameters in FME Flow, including the use of deployment and geometry parameters, to maximize workflow efficiency.
- Pro Tips for Success: Gain insights on parameterizing connections and leveraging new features like Conditional Visibility for clarity and simplicity.
We’ll wrap up with a glimpse into future webinars, followed by a Q&A session to address your specific questions surrounding this topic.
Don’t miss this opportunity to elevate your FME expertise and drive your projects to new heights of efficiency.
Key Trends Shaping the Future of Infrastructure.pdfCheryl Hung
Keynote at DIGIT West Expo, Glasgow on 29 May 2024.
Cheryl Hung, ochery.com
Sr Director, Infrastructure Ecosystem, Arm.
The key trends across hardware, cloud and open-source; exploring how these areas are likely to mature and develop over the short and long-term, and then considering how organisations can position themselves to adapt and thrive.
State of ICS and IoT Cyber Threat Landscape Report 2024 previewPrayukth K V
The IoT and OT threat landscape report has been prepared by the Threat Research Team at Sectrio using data from Sectrio, cyber threat intelligence farming facilities spread across over 85 cities around the world. In addition, Sectrio also runs AI-based advanced threat and payload engagement facilities that serve as sinks to attract and engage sophisticated threat actors, and newer malware including new variants and latent threats that are at an earlier stage of development.
The latest edition of the OT/ICS and IoT security Threat Landscape Report 2024 also covers:
State of global ICS asset and network exposure
Sectoral targets and attacks as well as the cost of ransom
Global APT activity, AI usage, actor and tactic profiles, and implications
Rise in volumes of AI-powered cyberattacks
Major cyber events in 2024
Malware and malicious payload trends
Cyberattack types and targets
Vulnerability exploit attempts on CVEs
Attacks on counties – USA
Expansion of bot farms – how, where, and why
In-depth analysis of the cyber threat landscape across North America, South America, Europe, APAC, and the Middle East
Why are attacks on smart factories rising?
Cyber risk predictions
Axis of attacks – Europe
Systemic attacks in the Middle East
Download the full report from here:
https://sectrio.com/resources/ot-threat-landscape-reports/sectrio-releases-ot-ics-and-iot-security-threat-landscape-report-2024/
UiPath Test Automation using UiPath Test Suite series, part 4DianaGray10
Welcome to UiPath Test Automation using UiPath Test Suite series part 4. In this session, we will cover Test Manager overview along with SAP heatmap.
The UiPath Test Manager overview with SAP heatmap webinar offers a concise yet comprehensive exploration of the role of a Test Manager within SAP environments, coupled with the utilization of heatmaps for effective testing strategies.
Participants will gain insights into the responsibilities, challenges, and best practices associated with test management in SAP projects. Additionally, the webinar delves into the significance of heatmaps as a visual aid for identifying testing priorities, areas of risk, and resource allocation within SAP landscapes. Through this session, attendees can expect to enhance their understanding of test management principles while learning practical approaches to optimize testing processes in SAP environments using heatmap visualization techniques
What will you get from this session?
1. Insights into SAP testing best practices
2. Heatmap utilization for testing
3. Optimization of testing processes
4. Demo
Topics covered:
Execution from the test manager
Orchestrator execution result
Defect reporting
SAP heatmap example with demo
Speaker:
Deepak Rai, Automation Practice Lead, Boundaryless Group and UiPath MVP
Generating a custom Ruby SDK for your web service or Rails API using Smithyg2nightmarescribd
Have you ever wanted a Ruby client API to communicate with your web service? Smithy is a protocol-agnostic language for defining services and SDKs. Smithy Ruby is an implementation of Smithy that generates a Ruby SDK using a Smithy model. In this talk, we will explore Smithy and Smithy Ruby to learn how to generate custom feature-rich SDKs that can communicate with any web service, such as a Rails JSON API.
GDG Cloud Southlake #33: Boule & Rebala: Effective AppSec in SDLC using Deplo...James Anderson
Effective Application Security in Software Delivery lifecycle using Deployment Firewall and DBOM
The modern software delivery process (or the CI/CD process) includes many tools, distributed teams, open-source code, and cloud platforms. Constant focus on speed to release software to market, along with the traditional slow and manual security checks has caused gaps in continuous security as an important piece in the software supply chain. Today organizations feel more susceptible to external and internal cyber threats due to the vast attack surface in their applications supply chain and the lack of end-to-end governance and risk management.
The software team must secure its software delivery process to avoid vulnerability and security breaches. This needs to be achieved with existing tool chains and without extensive rework of the delivery processes. This talk will present strategies and techniques for providing visibility into the true risk of the existing vulnerabilities, preventing the introduction of security issues in the software, resolving vulnerabilities in production environments quickly, and capturing the deployment bill of materials (DBOM).
Speakers:
Bob Boule
Robert Boule is a technology enthusiast with PASSION for technology and making things work along with a knack for helping others understand how things work. He comes with around 20 years of solution engineering experience in application security, software continuous delivery, and SaaS platforms. He is known for his dynamic presentations in CI/CD and application security integrated in software delivery lifecycle.
Gopinath Rebala
Gopinath Rebala is the CTO of OpsMx, where he has overall responsibility for the machine learning and data processing architectures for Secure Software Delivery. Gopi also has a strong connection with our customers, leading design and architecture for strategic implementations. Gopi is a frequent speaker and well-known leader in continuous delivery and integrating security into software delivery.
Epistemic Interaction - tuning interfaces to provide information for AI supportAlan Dix
Paper presented at SYNERGY workshop at AVI 2024, Genoa, Italy. 3rd June 2024
https://alandix.com/academic/papers/synergy2024-epistemic/
As machine learning integrates deeper into human-computer interactions, the concept of epistemic interaction emerges, aiming to refine these interactions to enhance system adaptability. This approach encourages minor, intentional adjustments in user behaviour to enrich the data available for system learning. This paper introduces epistemic interaction within the context of human-system communication, illustrating how deliberate interaction design can improve system understanding and adaptation. Through concrete examples, we demonstrate the potential of epistemic interaction to significantly advance human-computer interaction by leveraging intuitive human communication strategies to inform system design and functionality, offering a novel pathway for enriching user-system engagements.
Kubernetes & AI - Beauty and the Beast !?! @KCD Istanbul 2024Tobias Schneck
As AI technology is pushing into IT I was wondering myself, as an “infrastructure container kubernetes guy”, how get this fancy AI technology get managed from an infrastructure operational view? Is it possible to apply our lovely cloud native principals as well? What benefit’s both technologies could bring to each other?
Let me take this questions and provide you a short journey through existing deployment models and use cases for AI software. On practical examples, we discuss what cloud/on-premise strategy we may need for applying it to our own infrastructure to get it to work from an enterprise perspective. I want to give an overview about infrastructure requirements and technologies, what could be beneficial or limiting your AI use cases in an enterprise environment. An interactive Demo will give you some insides, what approaches I got already working for real.
Elevating Tactical DDD Patterns Through Object CalisthenicsDorra BARTAGUIZ
After immersing yourself in the blue book and its red counterpart, attending DDD-focused conferences, and applying tactical patterns, you're left with a crucial question: How do I ensure my design is effective? Tactical patterns within Domain-Driven Design (DDD) serve as guiding principles for creating clear and manageable domain models. However, achieving success with these patterns requires additional guidance. Interestingly, we've observed that a set of constraints initially designed for training purposes remarkably aligns with effective pattern implementation, offering a more ‘mechanical’ approach. Let's explore together how Object Calisthenics can elevate the design of your tactical DDD patterns, offering concrete help for those venturing into DDD for the first time!
GraphRAG is All You need? LLM & Knowledge GraphGuy Korland
Guy Korland, CEO and Co-founder of FalkorDB, will review two articles on the integration of language models with knowledge graphs.
1. Unifying Large Language Models and Knowledge Graphs: A Roadmap.
https://arxiv.org/abs/2306.08302
2. Microsoft Research's GraphRAG paper and a review paper on various uses of knowledge graphs:
https://www.microsoft.com/en-us/research/blog/graphrag-unlocking-llm-discovery-on-narrative-private-data/
2. What is KML?
KML is type of markup language based off of XML.
Stands for Keyhole Markup Language
Developed by Keyhole Inc. Google
KML files are very often distributed in KMZ files, which are zipped KML files
with a .kmz extension
3. Origin of KML
KML was first known as Keyhole.
KML originally developed for use with Google Earth.
Its development was engineered by Keyhole, Inc which Google acquired
in 2004.
4. Definition
Keyhole Markup Language (KML) is an XML notation for
expressing geographic annotation and visualization within
Internet-based, two-dimensional maps and three-
dimensional Earth browsers
5. In Other Words
KML is a way of displaying geographical data in an Earth Browser such as,
6. KML Functions
KML includes features that allow it to display:
place marks
Images
Polygons
3D models
Textual descriptions
7. Example
<?xml version="1.0" encoding="UTF-8"?>
<kml xmlns="http://earth.google.com/kml/2.0">
<Placemark>
<description>New York City</description>
<name>New York City</name>
<Point>
<coordinates>-74.006393,40.714172,0</coordinates>
</Point>
</Placemark>
</kml>
9. KML Applications:
KML file types are used by programs such as:
ArcGIS Explorer
Flickr
Google Earth
Google Maps
Google Mobile
Live Search Maps
Microsoft Virtual Earth
Marble (KDE)
World Wind
Yahoo Pipes
11. KML Elements
Everything is an “Object”. (Everything
inherits from the abstract “Object” KML
element).
There are abstract elements
Everything is a tag:
<Point>…</Point>
The more advanced tags are (usually) for
Google Earth.
12. Google Maps supports a subset of
KML…
Google Maps supports…
Placemarks
Icons
Folders
Descriptive HTML
KMZ (compressed KML, including attached images)
Polylines and polygons
Styles for polylines and polygons, including color, fill, and opacity
Network links to import data dynamically
Ground overlays and screen overlays
13. Structure
KML is in XML format
Usually everything contained in
Document tag
Can have multiple Folder tags to
separate different kinds of data.
For example, one folder containing
KML to show locations of pictures
and another folder containing KML
to show your path through the day.
14. Placemarks/Points/Coordinates
The easiest element in KML.
A simple point on the map. It only needs a name and a location. You can
give it a description too.
Placemark tag defines the place mark
A Point tag within it defines where the Placemark will be.
A “type” called coordinate defines the Point.
Coordinates in KML are given long,lat. When typing in coordinates directly
into Google Maps, they are given lat,long. Be careful!
16. Descriptive HTML
You’ll probably want to do HTML within the description tag.
You need to use the CDATA tag for this. If you don’t, your HTML’s tags
need to use entity references:
17. Paths
Can define a path using the Placemark tag and the
LineString tag instead of the Point tag.
Multiple coordinates. Again by long,lat,alt.
“extrude” tag makes the line go down to the ground
“tessellate” breaks each line into multiple pieces. Good
for long lines so they don’t end up underground.
0 = false, 1 = true
21. MIME Type
KML Servers must follow certain rules
Must return response code of HTTP 200
The type itself is:
application/vnd.google-earth.kml+xml
Can set the type in PHP with:
header('Content-type: application/vnd.google-earth.kml+xml');
Body must contain valid KML data and the XML declaration:
<?xml version="1.0" encoding="UTF-8"?>
22. Styles
Similar to CSS/HTML styles.
In a Style tag. Each style tag can have multiple styles within it: LineStyle,
PolyStyle, ColorStyle, etc.
The tag has an “id” so it can be referenced within a file or from another. (A
Global KML Style file perhaps?)
Add a styleUrl element to use a style.
HW2 could have different icons based on content? A site that grabs all
the Google Map icons:
http://www.visual-case.it/cgi-bin/vc/GMapsIcons.pl
24. Screen Overlays
Add an image to the Google Maps/Earth window.
Could be used for whatever purpose you like.
ScreenOverlay tag.
overlayXY and screenXY line up the image to the actual map
In this example, (0,1) (in fractions) means 0% of x (all the way to the left)
and 100% of y (all the way to the top). The upper-left of the image is lined
up with the upper-left of the map. The unit can also be determined by
pixels.
Size tag (obviously) controls size of the image. 0 means to maintain aspect
ratio, -1 indicate to use native dimension. Using some other value makes
the image that value. For example 0.2 with units on fraction makes the
image take up 20% of that dimension.
26. Network Links
Allows importing of KML, KMZ, and image files for ground/screen overlays.
Local or remote file
Uses a Link tag
Good way to split up large KML file into much smaller KML files. More
manageable.
More interesting feature: can use scripts to generate KML data on the fly.
(PHP, Perl, etc.)
Usually uni-direction data flow (server to map) but when using
“viewRefreshMode”, the map can pass the script information on what is
being viewed (the LatLon box). Google Maps/Earth will call the script with
a BBOX parameter. Look at the KML Tutorial for more information.