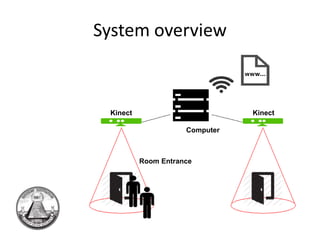
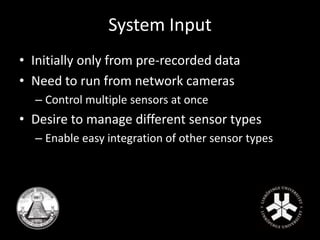
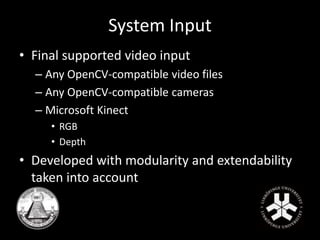
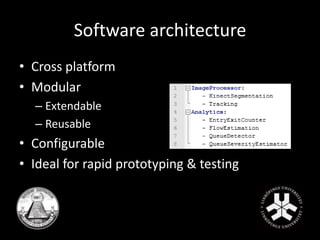
Kitchen Occupation 
TSBB11 
2013
Problem 
• Students need student kitchens to heat food. 
• Students want to be able to find the least occupied 
kitchen. 
• The university wants to make informed decisions on 
where and if more kitchens are needed.
The Group (main contributions) 
• Mattias Tiger – Project Leader, Software Architecture 
• Gustav Häger – System Integration, embedded 
• Erik Fall – Tracking, counting 
• Malin Rudin – Evaluation 
• Alexander Sjöholm – User and sensor interfaces 
• Nikolaus West – Quality control, queue detection 
• Martin Svensson – Documentation, system I/O
System overview 
• Counts entries and exits to room 
• Estimates severity of potential queues 
• Communicates to server via HTTP
System overview 
Kinect Kinect 
Computer 
Room Entrance
System Overview 
• Highly configurable 
• Simple to Calibrate 
• Runs with and without GUI 
• Easily extendable 
– We ended up creating a great, reusable, 
architecture for doing computer vision.
Initial solution 
• Initial plan to use network cameras and 
process on a server 
• Used a background model with basic tracker 
• Occlusion was a large problem
Changing circumstances 
• Could not send data over the network 
• Needed to process on the spot (on a 
cheap/slow computer) 
• Background model needs to process each 
pixel, a bit slow 
• A new approach was needed.
New approach 
• Needed some way to segment humans 
• Idea to detect only heads, or only movement 
• Optical flow for movment 
• Hough circles for heads
Tested approaches – hough circles 
• Use hough circles to detect heads in the image
Tested approaches – hough circles 
• Hough circle method is not robust enough
Tested approaches 
• Segmentation based on optical flow 
• To computationally heavy 
• Not fast enough for a cheap computer
New approach again – depth data 
• Tried using depth data 
• Stereo is hard to calibrate, and slow to 
calculate 
• Very easy and cheap to aquire using a kinect
Image processing 
• Human segmentation 
• Depth image from Microsoft Kinect camera 
• Simple assumptions
Image processing
Image processing 
• Occlusion handling
Tracking 
• Segmentation not enough for solving our 
problem, need some approach for counting 
• How to track appearing objects in a robust 
way 
• Follow objects from one frame to another 
– Pairing closest objects
Main error sources 
• Objects randomly appearing, outliers 
– Maximum pairing distance limits 
• Occlusion 
– Keep lost objects alive 
• Noise, flickering objects 
– Minimum lifetime before considered human  
counted
Counting 
• Registrating entries & exits 
– Door area 
• New object  Entries + 1 
• Object lost  Exits + 1 
• Not enough 
– Checkpoints 
• Circle lines 
– Removes some false entries & exits
Queue Severity Estimation 
• What is a queue? 
• People traveling slowly along the same path 
• Position, speed and movement factor in.
Queue Severity Estimation 
• Cubic Beziér Splines completely defined by: 
– Two endpoint positions (person positions) 
– Velocities at endpoint (person velocities) 
– Curve parametrization (relative weight between 
velocities and positions)
Queue Severity Estimation 
• People connected by short spline in same 
queue 
• Proportion of frames with visible queues 
determines queue severity
System Setup 
• Two steps 
– Calibration 
– Configuration 
• Target user computer vision skills 
– None
Calibration 
• What is the current height of the sensor? 
– Calibrate!
Configuration 
• Just listen to 
the manual 
• Specify 
– Doors 
– Checkpoints 
– Exclusions
Configuration
Dense Debugger 
• Where did it go wrong? 
– Intuitive debugging 
• Speed is crucial 
– Built-in profiling 
• Talk to me 
– Verbose logger
Dense Debugger
The Grid
System Input 
• Initially only from pre-recorded data 
• Need to run from network cameras 
– Control multiple sensors at once 
• Desire to manage different sensor types 
– Enable easy integration of other sensor types
System Input 
• Final supported video input 
– Any OpenCV-compatible video files 
– Any OpenCV-compatible cameras 
– Microsoft Kinect 
• RGB 
• Depth 
• Developed with modularity and extendability 
taken into account
System Output 
• Transmit desired information using HTTP 
– Make it easy to change output information 
– Possibility to easily switch target servers
System settings 
• Loads of different parameters in the code 
– Some algorithms have more than 10 parameters 
– Some parameters are calibrated using the GUI 
• Height threshold 
• Queue sensitivity 
– Camera types and network camera locations
System settings 
• One configuration file 
– Easy to tune different parameters 
– Good portability 
– Tune using GUI and then switch to the embedded 
version 
• Automatically writes all settings to file after 
program termination.
System settings 
Example file with required parameters.
Software architecture 
• Cross platform 
• Modular 
– Extendable 
– Reusable 
• Configurable 
• Ideal for rapid prototyping & testing
Performance 
Data sets
Performance 
Data sets
Performance 
Data sets
Performance 
Evaluation metric 
퐴푖푛 = 1 − 
Σ푖푛푒푠푡 − Σ푖푛퐺푇 
Σ푖푛퐺푇 
퐴표푢푡 = 1 − 
Σ표푢푡푒푠푡 − Σ표푢푡퐺푇 
Σ표푢푡퐺푇
Performance 
Queue severity
Results 
Sequence name Total number of 
entered (GT) 
Ain Total number of 
exited (GT) 
Aout Length 
R-Kitchen 108 (108) 100% 101 (104) 97% 32 min 
U-Kitchen 123 (122) 99% 134 (135) 99% 31 min 
B25-Kitchen 131 (141) 93% 82 (91) 90% 30 min
Results 
R-Kitchen: 
Number of 
entries 
(esitmated 
and ground 
truth).
Results 
U-Kitchen: 
Accuracy of 
entries.
Results 
B25-Kitchen: 
Number of 
exits 
(estimated and 
ground truth).
The final product 
• A cheap and accurate system for monitoring room 
usage 
• A very general purpose image processing pipeline 
• Total configuration without re-compiling 
• Great debug and installation user interfaces 
• Support for built-in, automatic evaluation of 
algorithms
Questions?

Kitchen Occupation Project Presentation

  • 1.
  • 2.
    Problem • Studentsneed student kitchens to heat food. • Students want to be able to find the least occupied kitchen. • The university wants to make informed decisions on where and if more kitchens are needed.
  • 3.
    The Group (maincontributions) • Mattias Tiger – Project Leader, Software Architecture • Gustav Häger – System Integration, embedded • Erik Fall – Tracking, counting • Malin Rudin – Evaluation • Alexander Sjöholm – User and sensor interfaces • Nikolaus West – Quality control, queue detection • Martin Svensson – Documentation, system I/O
  • 4.
    System overview •Counts entries and exits to room • Estimates severity of potential queues • Communicates to server via HTTP
  • 5.
    System overview KinectKinect Computer Room Entrance
  • 6.
    System Overview •Highly configurable • Simple to Calibrate • Runs with and without GUI • Easily extendable – We ended up creating a great, reusable, architecture for doing computer vision.
  • 7.
    Initial solution •Initial plan to use network cameras and process on a server • Used a background model with basic tracker • Occlusion was a large problem
  • 8.
    Changing circumstances •Could not send data over the network • Needed to process on the spot (on a cheap/slow computer) • Background model needs to process each pixel, a bit slow • A new approach was needed.
  • 9.
    New approach •Needed some way to segment humans • Idea to detect only heads, or only movement • Optical flow for movment • Hough circles for heads
  • 10.
    Tested approaches –hough circles • Use hough circles to detect heads in the image
  • 11.
    Tested approaches –hough circles • Hough circle method is not robust enough
  • 12.
    Tested approaches •Segmentation based on optical flow • To computationally heavy • Not fast enough for a cheap computer
  • 13.
    New approach again– depth data • Tried using depth data • Stereo is hard to calibrate, and slow to calculate • Very easy and cheap to aquire using a kinect
  • 14.
    Image processing •Human segmentation • Depth image from Microsoft Kinect camera • Simple assumptions
  • 15.
  • 16.
    Image processing •Occlusion handling
  • 17.
    Tracking • Segmentationnot enough for solving our problem, need some approach for counting • How to track appearing objects in a robust way • Follow objects from one frame to another – Pairing closest objects
  • 18.
    Main error sources • Objects randomly appearing, outliers – Maximum pairing distance limits • Occlusion – Keep lost objects alive • Noise, flickering objects – Minimum lifetime before considered human  counted
  • 20.
    Counting • Registratingentries & exits – Door area • New object  Entries + 1 • Object lost  Exits + 1 • Not enough – Checkpoints • Circle lines – Removes some false entries & exits
  • 22.
    Queue Severity Estimation • What is a queue? • People traveling slowly along the same path • Position, speed and movement factor in.
  • 23.
    Queue Severity Estimation • Cubic Beziér Splines completely defined by: – Two endpoint positions (person positions) – Velocities at endpoint (person velocities) – Curve parametrization (relative weight between velocities and positions)
  • 24.
    Queue Severity Estimation • People connected by short spline in same queue • Proportion of frames with visible queues determines queue severity
  • 25.
    System Setup •Two steps – Calibration – Configuration • Target user computer vision skills – None
  • 26.
    Calibration • Whatis the current height of the sensor? – Calibrate!
  • 27.
    Configuration • Justlisten to the manual • Specify – Doors – Checkpoints – Exclusions
  • 28.
  • 29.
    Dense Debugger •Where did it go wrong? – Intuitive debugging • Speed is crucial – Built-in profiling • Talk to me – Verbose logger
  • 30.
  • 31.
  • 32.
    System Input •Initially only from pre-recorded data • Need to run from network cameras – Control multiple sensors at once • Desire to manage different sensor types – Enable easy integration of other sensor types
  • 33.
    System Input •Final supported video input – Any OpenCV-compatible video files – Any OpenCV-compatible cameras – Microsoft Kinect • RGB • Depth • Developed with modularity and extendability taken into account
  • 34.
    System Output •Transmit desired information using HTTP – Make it easy to change output information – Possibility to easily switch target servers
  • 35.
    System settings •Loads of different parameters in the code – Some algorithms have more than 10 parameters – Some parameters are calibrated using the GUI • Height threshold • Queue sensitivity – Camera types and network camera locations
  • 36.
    System settings •One configuration file – Easy to tune different parameters – Good portability – Tune using GUI and then switch to the embedded version • Automatically writes all settings to file after program termination.
  • 37.
    System settings Examplefile with required parameters.
  • 38.
    Software architecture •Cross platform • Modular – Extendable – Reusable • Configurable • Ideal for rapid prototyping & testing
  • 39.
  • 40.
  • 41.
  • 42.
    Performance Evaluation metric 퐴푖푛 = 1 − Σ푖푛푒푠푡 − Σ푖푛퐺푇 Σ푖푛퐺푇 퐴표푢푡 = 1 − Σ표푢푡푒푠푡 − Σ표푢푡퐺푇 Σ표푢푡퐺푇
  • 43.
  • 44.
    Results Sequence nameTotal number of entered (GT) Ain Total number of exited (GT) Aout Length R-Kitchen 108 (108) 100% 101 (104) 97% 32 min U-Kitchen 123 (122) 99% 134 (135) 99% 31 min B25-Kitchen 131 (141) 93% 82 (91) 90% 30 min
  • 45.
    Results R-Kitchen: Numberof entries (esitmated and ground truth).
  • 46.
  • 47.
    Results B25-Kitchen: Numberof exits (estimated and ground truth).
  • 48.
    The final product • A cheap and accurate system for monitoring room usage • A very general purpose image processing pipeline • Total configuration without re-compiling • Great debug and installation user interfaces • Support for built-in, automatic evaluation of algorithms
  • 49.