Kids Count Data for 2011: Ingham County children
•
0 likes•296 views

Kids Count Data for 2011: Ingham County children

Recommended
Recommended
More Related Content
Similar to Kids Count Data for 2011: Ingham County children
Similar to Kids Count Data for 2011: Ingham County children (20)
More from Ingham Great Start Birth to Five
More from Ingham Great Start Birth to Five (20)
Recently uploaded
Recently uploaded (20)
Kids Count Data for 2011: Ingham County children
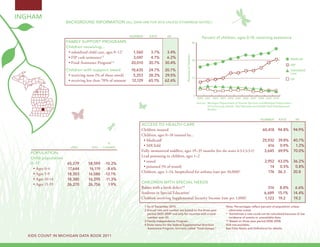
- 1. Ingham BaCkground InformatIon (all data are for 2010 unless otherwIse noted.) numBer rate mI Percent of children, ages 0-18, receiving assistance famIly suPPort Programs 45 Children receiving... • subsidized child care, ages 0–121 1,560 3.7% 3.4% Percent of Children • FIP cash assistance1,3 3,047 4.7% 6.2% Medicaid 30 • Food Assistance Program1,4 20,010 30.7% 30.4% FAP Children with support owed 18,635 24.7% 20.7% Subsidized Care • receiving none (% of those owed) 5,253 28.2% 29.5% 15 FIP • receiving less than 70% of amount 12,129 65.1% 62.6% 0 2000 2001 2002 2003 2004 2005 2006 2007 2008 2009 2010 Source: Michigan Department of Human Services and Michigan Department of Community Health, Vital Records and Health Data Development Section. numBer rate mI aCCess to health Care Children insured 60,418 94.8% 94.9% Children, ages 0–18 insured by... • Medicaid1 25,932 39.8% 40.7% % 2000 2010 Change • MIChild 616 0.9% 1.2% Fully immunized toddlers, ages 19–35 months (for the series 4:3:1:3:3:1)1 3,645 69.9% 70.0% PoPulatIon Lead poisoning in children, ages 1–2 Child population • tested 2,952 43.0% 36.2% 0–17 65,279 58,599 -10.2% • poisoned (% of tested) 14 0.5% 0.8% • Ages 0-4 17,644 16,119 -8.6% Children, ages 1–14, hospitalized for asthma (rate per 10,000)2 176 36.3 20.8 • Ages 5-9 18,303 16,086 -12.1% • Ages 10-14 18,380 16,295 -11.3% ChIldren wIth sPeCIal needs • Ages 15-19 26,270 26,756 1.9% Babies with a birth defect** 314 8.8% 6.6% Students in Special Education1 6,689 15.1% 14.4% Children receiving Supplemental Security Income (rate per 1,000)1 1,123 19.2 19.2 1 as of december 2010. note: Percentages reflect percent of population unless 2 annual rate and number are based on the three-year otherwise noted. period 2007–2009 and only for counties with a total * sometimes a rate could not be calculated because of low number over 20. incidence of events or unavailable data. 3 family Independence Program. ** Based on three year period 2006-2008. 4 state name for the federal supplemental nutrition n/a not available. assistance Program, formerly called “food stamps.” see data notes and definitions for details. kIds Count In mIChIgan data Book 2011
- 2. iNGHAm TRENdS IN CHILd WELL-BEINg 2000–2008/09** BASE YEAR CURRENT YEAR PERCENT CHANgE IN RATE -100 0 100 NUMBER RATE NUMBER RATE RANk1 MI RATE WoRSE BETTER Economic Security** 2005 2009 Ingham Children in poverty Michigan • ages 0–17 13,004 21.1% 12,925 22.5% 38 22.2% 7 • ages 5–17 8,958 20.6% 8,615 21.3% 44 20.2% 3 2006 2010 Students receiving free/reduced price school lunches2 16,809 35.8% 20,720 46.8% 24 46.5% 31 Child Health 1998–2000 2007–2009 Less than adequate prenatal care (2008–09)‡ — — 811 23.5% 18 29.5% Low-birthweight babies 292 7.8% 281 8.1% 58 of 81 8.5% 3 Infant mortality (per 1,000) 26 6.9 26 7.4 32 of 49 7.6 7 Child deaths, ages 1–14 (per 100,000) 11 21.3 7 15.7 12 of 34 17.4 26 Adolescence Births to teens, ages 15–19 (per 1,000) 411 30.1 346 25.3 27 33.3 16 Teen deaths (per 100,000) 11 42.1 6 24.2 1 of 39 55.6 42 2007 2010 High school dropouts** 592 15.4% 520 14.0% 76 of 80 11.1% 9 Abuse/Neglect (per 1,000) FY2000 FY2010 Children in investigated families 6,197 94.8 5,195 88.7 43 70.1 6 Confirmed victims 1,172 17.9 1,492 25.5 65 13.8 42 Children in out-of-home care 748 11.4 499 8.5 71 of 76 5.1 26 2009 Education (not proficient in math) 2003 2010 Fourth grade (MEAP) 1,258 35.8% 263 8.3% 52 8.5% 77 Live Births Eighth grade (MEAP) 1,808 49.5% 791 24.6% 68 22.0% 50 3,351 2010 Median 2008 2010 Household Total Population High school students (MME) 1,440 48.1% 1,307 46.2% 30 49.6% 4 Income 280,895 $42,990 Unemployment 1 A ranking of 1 means a county has the ‘‘best’’ rate compared to other counties in the state. Unless noted, the ranking is based on 82–83 counties. Missing bars indicate no change Rate 2 Family income for eligible students is below 185 percent poverty level. or a rate could not be calculated; 10.4% * Sometimes a rate could not be calculated because of low incidence of events or unavailable data. a ‘‘0’’ reflects no change. ** Due to changes in the data measures, comparisons between 2000 and the current year could not be made for some indicators. Percentage change is calculated ‡ Due to Michigan’s revised birth certificate, 2008–09 data cannot be compared with those of previous years. with unrounded rates. MME – Michigan Merit Exam instead of the MEAP. Beginning in 2007 Michigan high school students have taken the ACT college entrance exam. 62 KIDS COUNT IN MICHIGAN DATA BOOK 2011