The daily commodity report summarizes movements in gold, silver, and crude futures contracts on the MCX exchange on February 9th, 2012. Gold futures closed lower after failing to hold gains and hitting an intra-day low. Silver and crude futures also closed lower despite hitting intra-day highs. Technical indicators for gold and silver signal intermediate buying support, while crude indicators show sideways movement. The report provides resistance and support price levels for the contracts.
Indian markets edged higher for the third straight session, boosted by firm global stocks. The Sensex rose 1.28% and Nifty gained 1.31%. All sectoral indices closed in positive territory led by metal, oil & gas, real estate and power stocks. Asian markets opened positive, tracking gains in the US where stocks rose over 1.5% after JP Morgan hiked its dividend and Fed maintained low interest rates. Biocon fell over 6% after terminating its alliance with Pfizer to commercialize biosimilar products.
Indian markets rose about 1% on Friday recovering from losses in the previous session. Markets are still up over 10% for the year due to foreign investor purchases. However, caution remains over the timing of interest rate cuts. Asian stocks are mixed today with Chinese stocks down on growth concerns while Japanese exporters are up. The Indian markets are expected to have a flat opening tracking uncertain Asian markets.
Indian markets edged higher, closing flat with a positive bias after choppy trading. Gains in metal, auto and bank stocks were offset by losses in capital goods, IT and FMCG. Asian stocks fell modestly on credit rating downgrades of eurozone nations by Moody's. The daily session may see volatility ahead of monthly Indian inflation data release.
- The Indian markets opened with a gap down and witnessed sustained selling pressure, trading with moderate losses. However, short covering and selective buying helped markets claw back from the lows.
- The markets ended the day with moderate losses near the lows, with top losers including Tata Motors, Hindalco, HDFC Bank and others.
- Technically, market breadth remained subdued amid lower volumes. The domestic markets are likely to witness a flat opening and further selling pressure below key support levels.
The document provides a daily note on the Indian and global markets from Keynote Capital Institutional Research. It includes a snapshot of movements in key Indian indices and sector indices, details on FII and MFI activity in the Indian markets, top gainers and losers, and commentary on developments in the Indian and global markets. The markets surged on reports that the government will not target participatory notes in a blanket manner under new proposed rules targeting tax avoidance. Japanese shares declined, leading declines in other Asian markets following gains the previous day on signals of more monetary policy easing in the US. Indian markets are expected to open lower tracking declines in Asian and US markets.
The document provides intra-day technical levels for various stocks listed on the Indian stock market for April 26, 2012. It includes the previous day's closing price, pivot point, and resistance and support levels for each stock. The levels are intended to help analyze the stock's potential price movement during the trading day.
This document provides a daily market snapshot and analysis of the Indian and global equity, commodity and currency markets. It summarizes the key developments and market movements over the past few days, including declines in major Indian indices, foreign institutional investment flows, mutual fund activity and global market performance. It also previews the economic and corporate news expected over the next few days from India and globally.
The document provides daily technical levels for various stocks traded on the Indian stock market, including pivot points and resistance and support levels. It contains this information for over 100 companies, listing the previous day's closing price and identifying key price points that could indicate upward or downward movement in the stock price on the given date of April 25, 2012.
The domestic stock markets declined on negative global cues. The markets opened lower and saw selling pressure in the morning, but recovered slightly from lower levels due to short covering and selective buying. However, weak European market cues caused the markets to drift lower again. Technically, market breadth was negative with lower volumes, and indicators like RSI, MACD and KST were in negative territory, suggesting further downside. The Nifty closed below the key 4987 support level. Global cues remain largely negative and the domestic markets are likely to see a gap down opening.
1. Indian markets snapped a two-day losing streak, closing higher supported by gains in IT and other sectors after positive earnings from TCS.
2. Asian stocks are mostly higher today tracking gains on Wall Street, while the Indian market is expected to open positively taking cues from Asia.
3. Key economic data this week includes the US GDP and jobs reports, along with Indian foreign reserves and economic data.
The document provides intra-day technical levels for various companies for February 1st, 2012. It lists the company name, pivot point, and resistance and support levels. The levels indicate price points that could provide resistance or support for share prices over the course of the trading day.
The document provides daily technical levels for various stocks traded on the Indian stock market. It lists the previous day's closing price and establishes pivot points, resistance levels (R1, R2, R3) and support levels (S1, S2, S3) for each stock based on technical analysis. Over 50 stocks from various sectors are included, with their corresponding price levels to watch for intraday trading on December 8, 2011.
The document provides daily technical levels for various stocks traded on the Indian stock market, including pivot points and resistance and support levels. It lists the stock ticker, previous day's close price, calculated pivot point, and potential resistance and support price levels for intraday trading on 06/09/11. Over 50 stocks from various sectors are included, with levels shown to help analyze market movement and identify trading opportunities.
- Gold, silver and crude oil futures opened higher on the MCX on April 30th, with gold seeing marginal gains and silver and crude oil posting modest losses by the end of the day.
- Technical indicators like the RSI, stochastic and ADX signals support buying, but also suggest the markets may be overbought and prone to profit taking.
- Key resistance and support levels are identified for each commodity futures contract.
- The Indian markets snapped a three-day winning streak and closed lower due to weak global markets and concerns over Greece's bailout.
- Key indices like the Sensex and Nifty closed slightly down. Buying was seen in real estate, power and IT stocks while metals and oil & gas stocks declined.
- Asian markets traded higher on Friday taking cues from strong US economic data and earnings. The report provides analysis on various domestic and global stock market indices and economic indicators.
Indian markets recovered slightly at the end of the day as European markets rose in early trading, with the Sensex up 0.41% and CNX Nifty up 0.27%. Exports grew 3.87% year-over-year in November while imports increased 30.24%, and several companies such as GAIL, IVRCL, and L&T received new orders totaling over Rs. 2,000 crore. Concerns remain over a slowdown in economic growth as reflected by weak export numbers.
The domestic stock markets opened flat and remained range bound with lackluster trading. Support from follow-up buying was missing and selling pressure increased toward the end of the day, causing the markets to close near the day's lows. Technically, market breadth was positive but lower volumes and diverging global cues may lead to a negative opening tomorrow. The Nifty is struggling near 4,747 but has sustained above this level.
The summary provides an overview of the Indian stock market performance on January 6th, 2011 and some analysis:
- Indian markets ended flat to slightly lower as investors booked profits in large caps, though buying in auto, capital goods and bank stocks provided some support.
- Weekly food inflation data showed a sharp drop and eased concerns, which may support the market. However, quarterly earnings reports starting next week are expected to show slowing growth, weighing on stocks.
- Asian markets opened lower following losses in Japan and Hong Kong, though lower weekly Indian food inflation provided some relief to investors. The domestic market is expected to see a weak opening, tracking Asian peers.
The document provides intra-day technical levels for various companies trading on the stock market on 23/01/12. It lists the company name, previous day's closing price, pivot point, and resistance and support levels (R1, R2, R3 for resistance and S1, S2, S3 for support). The levels are meant to indicate price points where buying or selling pressure may increase for intra-day trading.
- The Indian markets rallied on Friday led by gains in banking and consumer stocks. The markets were boosted by strong quarterly results from Wipro and Axis Bank.
- Asian markets traded mixed on Monday as encouraging corporate earnings were offset by concerns over Greece's debt negotiations.
- The document provides an overview of the performance of the key Indian indices and sectors on January 20, along with FII/DII flows and global market updates. It also lists some corporate developments and the top gainers and losers during the day.
Indian markets fell as worries over slowing domestic economy weighed on sentiment. Banking stocks were hit hard due to lower-than-expected advance tax payments. Asian stocks turned higher after an initial drop as investors recovered some losses. The markets are expected to open positive today following Asian shares, but worsening domestic growth and tight liquidity may limit gains.
The document provides daily technical analysis levels for various stocks traded on the Indian stock market, including resistance and support levels for each stock based on the previous day's closing price. The levels include pivot points, and resistance and support levels R1-R3 and S1-S3 respectively to indicate price points where buying or selling pressure may increase for each stock. Over 50 stocks are listed with their corresponding technical analysis levels.
The domestic stock markets opened flat but turned negative due to selling pressure and disappointing results from SBI and ratings downgrades of Indian banks. The markets ended the day with moderate losses near the lows, with heavy selling in banks like SBI, BPCL, and Tata Steel. Technically, the market breadth was negative with higher volumes, and the markets are likely to open negatively as technical indicators remain bearish. Key support and resistance levels for the Nifty are 5161-4987 and 5230-5393 respectively.
The domestic stock markets opened flat but gained modestly over the day due to selective buying and short covering. However, profit taking in the last hour of trading caused the markets to end near the day's lows. Global cues were mixed. The technical outlook remains negative, with indicators suggesting further downside, and support and resistance levels are provided. Short term trading ideas based on technical analysis are also given.
The document summarizes daily commodity outlooks for gold, silver, and crude on the MCX exchange for November 23, 2011. It provides opening and closing prices, highs and lows for the day, and technical analysis for each commodity. Gold closed higher at 28799 after bouncing from intraday lows. Silver gained significantly, closing at 57052. Crude oil also closed higher at 5142 after touching intraday lows. The technical indicators provided signal short term buying support for silver and crude, while gold's signals were mixed.
The domestic stock markets opened lower but bounced back to close flat, supported by the 200-day simple moving average. The Nifty closed slightly higher but technical indicators remain negative, suggesting further bouts of selling pressure. Key support levels are at 5624, 5571 and 5447, while resistance levels are at 5747, 5816 and 5885. Stocks such as Adani Ports, HDFC, and HUL are recommended for watching.
The document provides intra-day technical levels for currency futures contracts for various dates. It includes the previous day's close price, intra-day trend, pivot point, and resistance and support levels. The pivot point is used as a trigger for intra-day buy/sell decisions. Resistance levels above and support levels below the pivot point are also provided. The document advises using the pivot point as a stop loss level and taking successive profit targets at the resistance and support levels.
The document provides daily derivatives outlook and recommends several bullish and bearish positional option trades on indices and stocks. It recommends short strangle trades on Nifty, Bank Nifty and USD/INR based on highest call and put open interest levels. It also recommends bullish call option trades on specific stocks like Hindustan Unilever, Ranbaxy, ITC, HDFC and Titan. Bearish put option trades are recommended on stocks like Reliance, Tata Steel, Reliance Power, DLF, Hero Motors.
The key Indian stock indices closed slightly higher, recovering from a seven-day losing streak. The Sensex closed up 0.12% and the Nifty closed up 0.14%. Midcap and small cap shares continued declining with lack of buying support. Shares of Jet Airways and SpiceJet fell on concerns of increased competition from a new AirAsia India joint venture. GAIL shares fell on reports of delays to a gas pipeline project in Tamil Nadu. Overall, six sectors closed lower while seven closed higher. FIIs were net buyers of Indian stocks while domestic institutions were net sellers.
The document provides the intra-day technical levels for various stocks trading on the NSE for March 28, 2013, the day of monthly futures and options expiry. It lists the closing price of each stock from March 26, the intra-day pivot point, and resistance and support levels (R1-R3 and S1-S3). The levels are expected to act as upside and downside barriers for price movement during the trading session.
The document provides intra-day technical levels for various commodities futures contracts traded on the MCX commodity exchange in India. It lists the commodity, contract expiry date, previous day's close price, intra-day trend, pivot point, and resistance and support levels for each commodity contract. The levels are used to analyze the commodity's intra-day price movement and determine potential resistance and support areas.
The daily commodity report summarizes the movement of gold, silver, and crude prices on the MCX exchange on March 6th, 2013. Gold prices opened lower but rose intraday before closing with modest losses. Silver opened higher and peaked intraday but also closed with losses. Crude opened and closed higher with moderate gains. Technical indicators for all three commodities showed sellers were in control but covering shorts, suggesting prices may rise. Upcoming economic reports and data were also summarized.
The domestic markets witnessed negative openings and sustained selling pressure, trading with moderate losses on weak global cues. However, the markets managed to recover from the lows and end the day with modest losses near the highs, supported by short covering and selective buying. Technically, most indicators remain below their averages, signaling impending selling pressure. The markets will take cues from global factors as well as the rupee and crude oil prices.
The document provides technical analysis levels for various currency futures contracts traded on the NSE for intraday trading on March 5, 2013. It lists the pivot point, resistance and support levels for currency pairs such as EUR/INR, GBP/INR, JPY/INR and USD/INR. The pivot point is considered a trigger for intraday buy/sell decisions. Resistance levels R1, R2, R3 are above the pivot point and support levels S1, S2, S3 are below the pivot point. The analysis is meant to guide intraday traders on entry, exit and stop loss levels based on the currency pair's price action relative to the pivot point.
The document provides the intra-day technical levels for various stocks trading on the National Stock Exchange of India (NSE) on March 5, 2013. It lists the stocks, their closing prices from the previous day, identified trends (up or down), pivot points, and resistance and support levels for intra-day trading. The levels are intended to help traders identify potential highs and lows for the stocks during the trading day.
The domestic stock markets witnessed flat opening but selling pressure drove markets lower. However, markets bounced back from lower levels due to short covering and selective buying. The markets closed near the day's highs with modest gains. Technically, positive market breadth amid higher volumes supported the markets. The indices remain above key support levels. However, negative technical indicators could lead to selling pressure at higher levels. The markets will take cues from the upcoming Union Budget.
The document provides the intra-day technical levels for currency futures contracts on various dates. It includes the pivot point, which is a trigger for intra-day buy/sell decisions, and resistance and support levels (R1, R2, R3 and S1, S2, S3). The trader is advised to take a long position above the pivot point and use the pivot as the stop loss, with targets at the resistance levels; and take a short position below the pivot point, using it as the stop loss and targeting the support levels. The intra-day trend is valid until the price trades above or below the pivot point.
The document provides intra-day technical levels for various MCX commodities contracts for February 28, 2013. It lists the commodity, contract expiry date, previous day's close price, intra-day trend, pivot point, resistance and support levels. Technical analysis is used to identify levels of resistance and support for each commodity contract to determine likely price movement and trading opportunities on the given day.
This document provides a daily derivatives outlook and recommends various positional option trades. It summarizes the highest call and put open interest levels for various indices like Nifty and Bank Nifty. It recommends short-term strategies like short strangles and long-term strategies like short straddles. It also provides bullish and bearish positional stock option trades and discusses the US dollar-Indian rupee outlook.
The daily commodity report summarizes prices and trading activity for gold, silver, and crude oil futures on the MCX exchange in India. On February 27th, gold and silver prices closed lower by 1.16% and 1.46% respectively, while crude oil closed lower by 0.42%. Trading volumes declined significantly across all three commodities compared to the previous day. Technical indicators show buying support for gold and silver but strengthening sellers for crude oil. Key support and resistance price levels are provided.
The document provides the intra-day technical levels for various stocks trading on the National Stock Exchange of India (NSE) for February 28, 2013, the expiry date for futures and options contracts. It lists the stock name, previous day's close price, identified trend (up/down), pivot point, and potential resistance and support levels (R1, R2, R3, S1, S2, S3) for each stock based on technical analysis of recent price movements. This is intended to help traders identify potential price points where the market may reverse direction on an intra-day basis.
The domestic markets opened flat but saw selling pressure and losses, especially in mid-cap stocks due to margin funding issues. The markets recovered slightly in the afternoon on short-covering and selective buying but failed to sustain higher levels. Technically, market breadth was weak with higher volumes signaling more downside risk. Most technical indicators were below their averages, signaling impending selling pressure. However, some indicators were in oversold territory, which could lead to short-term bouts of buying at lower levels. The markets will take cues from the upcoming union budget, global markets, the rupee and crude oil prices.
- The document provides intra-day technical levels for currency futures contracts, including pivot points, resistance and support levels.
- The pivot point is a trigger point for intra-day buying and selling based on the previous day's price range, and is used to determine resistance and support levels.
- Traders are advised to take buy positions above the pivot point and sell positions below it, using the pivot point as a stop loss and targeting resistance or support levels.
The document provides intra-day technical levels for various commodities trading on the MCX exchange for February 26, 2013. It lists the commodity, contract expiry date, previous day's close price, intra-day trend, pivot point, resistance and support levels for each commodity. Technical analysis is used to determine the short-term outlook and key price levels.
This document provides a daily outlook on currency, indices, and stock positional option trades for February 26, 2013. It summarizes the highest call and put open interest levels for the Nifty and Bank Nifty indices and recommends short strangle strategies. It also recommends short strangle trades for the USD/INR currency pair in March. On the stock side, it recommends bullish positional calls on specific stocks and bearish positional puts on other stocks. The document provides a ready reckoner on various option strategies and techniques for managing risk.
In a tight labour market, job-seekers gain bargaining power and leverage it into greater job quality—at least, that’s the conventional wisdom.
Michael, LMIC Economist, presented findings that reveal a weakened relationship between labour market tightness and job quality indicators following the pandemic. Labour market tightness coincided with growth in real wages for only a portion of workers: those in low-wage jobs requiring little education. Several factors—including labour market composition, worker and employer behaviour, and labour market practices—have contributed to the absence of worker benefits. These will be investigated further in future work.
Madhya Pradesh, the "Heart of India," boasts a rich tapestry of culture and heritage, from ancient dynasties to modern developments. Explore its land records, historical landmarks, and vibrant traditions. From agricultural expanses to urban growth, Madhya Pradesh offers a unique blend of the ancient and modern.
How to Invest in Cryptocurrency for Beginners: A Complete GuideDaniel
Cryptocurrency is digital money that operates independently of a central authority, utilizing cryptography for security. Unlike traditional currencies issued by governments (fiat currencies), cryptocurrencies are decentralized and typically operate on a technology called blockchain. Each cryptocurrency transaction is recorded on a public ledger, ensuring transparency and security.
Cryptocurrencies can be used for various purposes, including online purchases, investment opportunities, and as a means of transferring value globally without the need for intermediaries like banks.
Vicinity Jobs’ data includes more than three million 2023 OJPs and thousands of skills. Most skills appear in less than 0.02% of job postings, so most postings rely on a small subset of commonly used terms, like teamwork.
Laura Adkins-Hackett, Economist, LMIC, and Sukriti Trehan, Data Scientist, LMIC, presented their research exploring trends in the skills listed in OJPs to develop a deeper understanding of in-demand skills. This research project uses pointwise mutual information and other methods to extract more information about common skills from the relationships between skills, occupations and regions.
A toxic combination of 15 years of low growth, and four decades of high inequality, has left Britain poorer and falling behind its peers. Productivity growth is weak and public investment is low, while wages today are no higher than they were before the financial crisis. Britain needs a new economic strategy to lift itself out of stagnation.
Scotland is in many ways a microcosm of this challenge. It has become a hub for creative industries, is home to several world-class universities and a thriving community of businesses – strengths that need to be harness and leveraged. But it also has high levels of deprivation, with homelessness reaching a record high and nearly half a million people living in very deep poverty last year. Scotland won’t be truly thriving unless it finds ways to ensure that all its inhabitants benefit from growth and investment. This is the central challenge facing policy makers both in Holyrood and Westminster.
What should a new national economic strategy for Scotland include? What would the pursuit of stronger economic growth mean for local, national and UK-wide policy makers? How will economic change affect the jobs we do, the places we live and the businesses we work for? And what are the prospects for cities like Glasgow, and nations like Scotland, in rising to these challenges?
OJP data from firms like Vicinity Jobs have emerged as a complement to traditional sources of labour demand data, such as the Job Vacancy and Wages Survey (JVWS). Ibrahim Abuallail, PhD Candidate, University of Ottawa, presented research relating to bias in OJPs and a proposed approach to effectively adjust OJP data to complement existing official data (such as from the JVWS) and improve the measurement of labour demand.
KYC Compliance: A Cornerstone of Global Crypto Regulatory FrameworksAny kyc Account
This presentation explores the pivotal role of KYC compliance in shaping and enforcing global regulations within the dynamic landscape of cryptocurrencies. Dive into the intricate connection between KYC practices and the evolving legal frameworks governing the crypto industry.
Confirmation of Payee (CoP) is a vital security measure adopted by financial institutions and payment service providers. Its core purpose is to confirm that the recipient’s name matches the information provided by the sender during a banking transaction, ensuring that funds are transferred to the correct payment account.
Confirmation of Payee was built to tackle the increasing numbers of APP Fraud and in the landscape of UK banking, the spectre of APP fraud looms large. In 2022, over £1.2 billion was stolen by fraudsters through authorised and unauthorised fraud, equivalent to more than £2,300 every minute. This statistic emphasises the urgent need for robust security measures like CoP. While over £1.2 billion was stolen through fraud in 2022, there was an eight per cent reduction compared to 2021 which highlights the positive outcomes obtained from the implementation of Confirmation of Payee. The number of fraud cases across the UK also decreased by four per cent to nearly three million cases during the same period; latest statistics from UK Finance.
In essence, Confirmation of Payee plays a pivotal role in digital banking, guaranteeing the flawless execution of banking transactions. It stands as a guardian against fraud and misallocation, demonstrating the commitment of financial institutions to safeguard their clients’ assets. The next time you engage in a banking transaction, remember the invaluable role of CoP in ensuring the security of your financial interests.
For more details, you can visit https://technoxander.com.
University of North Carolina at Charlotte degree offer diploma Transcripttscdzuip
办理美国UNCC毕业证书制作北卡大学夏洛特分校假文凭定制Q微168899991做UNCC留信网教留服认证海牙认证改UNCC成绩单GPA做UNCC假学位证假文凭高仿毕业证GRE代考如何申请北卡罗莱纳大学夏洛特分校University of North Carolina at Charlotte degree offer diploma Transcript
New Visa Rules for Tourists and Students in Thailand | Amit Kakkar Easy VisaAmit Kakkar
Discover essential details about Thailand's recent visa policy changes, tailored for tourists and students. Amit Kakkar Easy Visa provides a comprehensive overview of new requirements, application processes, and tips to ensure a smooth transition for all travelers.
The Impact of Generative AI and 4th Industrial RevolutionPaolo Maresca
This infographic explores the transformative power of Generative AI, a key driver of the 4th Industrial Revolution. Discover how Generative AI is revolutionizing industries, accelerating innovation, and shaping the future of work.
South Dakota State University degree offer diploma Transcriptynfqplhm
办理美国SDSU毕业证书制作南达科他州立大学假文凭定制Q微168899991做SDSU留信网教留服认证海牙认证改SDSU成绩单GPA做SDSU假学位证假文凭高仿毕业证GRE代考如何申请南达科他州立大学South Dakota State University degree offer diploma Transcript
Optimizing Net Interest Margin (NIM) in the Financial Sector (With Examples).pdfshruti1menon2
NIM is calculated as the difference between interest income earned and interest expenses paid, divided by interest-earning assets.
Importance: NIM serves as a critical measure of a financial institution's profitability and operational efficiency. It reflects how effectively the institution is utilizing its interest-earning assets to generate income while managing interest costs.
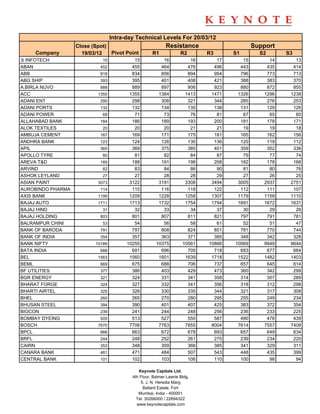
6. Intra-day Technical Levels For 20/03/12
Close (Spot) Resistance Support
Company 19/03/12 Pivot Point R1 R2 R3 S1 S2 S3
WIPRO 428 426 431 435 444 422 417 408
YES BANK 361 363 368 376 388 355 350 337
ZEEL 124 125 128 132 139 121 118 110
Sanjay Bhatia (AVP – Technicals), Email Id sanjay@keynotecapitals.net
Pivot Point: Intra- Day Trading Tool.
Pivot Point (PP): This is a trigger point for Intra Day Buy / Sell based on the price range of the previous day.
R1: Resistance 1: 1st Resistance level over Pivot Point, R2: Resistance 2: Next Resistance level after R1.
R3: Resistance 3: Next Resistance level after R2.
S1: Support 1: 1st Support level after Pivot Point, S2: Support 2: Next Support level after S1.
S3: Support 3: Next Support level after S2.
Note: As per this tool, the trader should take BUY position just above the Pivot Point and keep the Pivot Point level as stop
loss and the first target would be R1 level (Resistance 1). If R1 is crossed then R2 (Resistance 2) becomes the next target
with the stop loss placed at R1 level. If R2 is crossed then R3 (Resistance 3) becomes the next target with the stop loss
placed at R2 level.
Similarly if price goes below the Pivot Point the trader should take a SELL position and keep the Pivot Point level as the stop
loss and the first target would be S1 level (Support 1). If S1 level is breached then S2 level (Support 2) becomes the next
target with the stop loss placed at S1 level. If S2 level is breached then S3 level (Support 3) becomes the next target with the
stop loss placed at S2 level.
This is an intra-day tool. The key to the use of this tool is the use of Stop Loss
Disclaimer: This document is not for public distribution and has been furnished to you solely for your information and must not be reproduced
or redistributed to any other person. Persons into whose possession this document may come are required to observe these restrictions. This
material is for the personal information of the authorized recipient, and we are not soliciting any action based upon it. This report is not to be
construed as an offer to sell or the solicitation of an offer to buy any security in any jurisdiction where such an offer or solicitation would be
illegal. It is for the general information of clients of Keynote Capitals Ltd. It does not constitute a personal recommendation or take into account
the particular investment objectives, financial situations, or needs of individual clients. We have reviewed the report, and in so far as it includes
current or historical information, it is believed to be reliable though its accuracy or completeness cannot be guaranteed. Neither Keynote
Capitals Ltd., nor any person connected with it, accepts any liability arising from the use of this document. The recipients of this material
should rely on their own investigations and take their own professional advice. Price and value of the investments referred to in this material
may go up or down. Past performance is not a guide for future performance. Certain transactions -including those involving futures, options
and other derivatives as well as non-investment grade securities - involve substantial risk and are not suitable for all investors. Reports based
on technical analysis centers on studying charts of a stock’s price movement and trading volume, as opposed to focusing on a company’s
fundamentals and as such, may not match with a report on a company’s fundamentals. Opinions expressed are our current opinions as of the
date appearing on this material only. While we endeavor to update on a reasonable basis the information discussed in this material, there may
be regulatory, compliance, or other reasons that prevent us from doing so. Prospective investors and others are cautioned that any forward-
looking statements are not predictions and may be subject to change without notice. Our proprietary trading and investment businesses may
make investment decisions that are inconsistent with the recommendations expressed herein. We and our affiliates, officers, directors, and
employees world wide may: (a) from time to time, have long or short positions in, and buy or sell the securities thereof, of company (ies)
mentioned herein or (b) be engaged in any other transaction involving such securities and earn brokerage or other compensation or act as a
market maker in the financial instruments of the company (ies) discussed herein or act as advisor or lender / borrower to such company (ies)
or have other potential conflict of interest with respect to any recommendation and related information and opinions. The analyst for this report
certifies that all of the views expressed in this report accurately reflect his or her personal views about the subject company or companies and
its or their securities, and no part of his or her compensation was, is or will be, directly or indirectly related to specific recommendations or
views expressed in this report. No part of this material may be duplicated in any form and/or redistributed without Keynote Capitals Ltd’s., prior
written consent.
Keynote Capitals Ltd.
4th Floor, Balmer Lawrie Bldg.
5, J. N. Heredia Marg
Ballard Estate, Fort
Mumbai, India - 400001
Tel: 30266000 / 22694322
www.keynotecapitals.com