Download to read offline

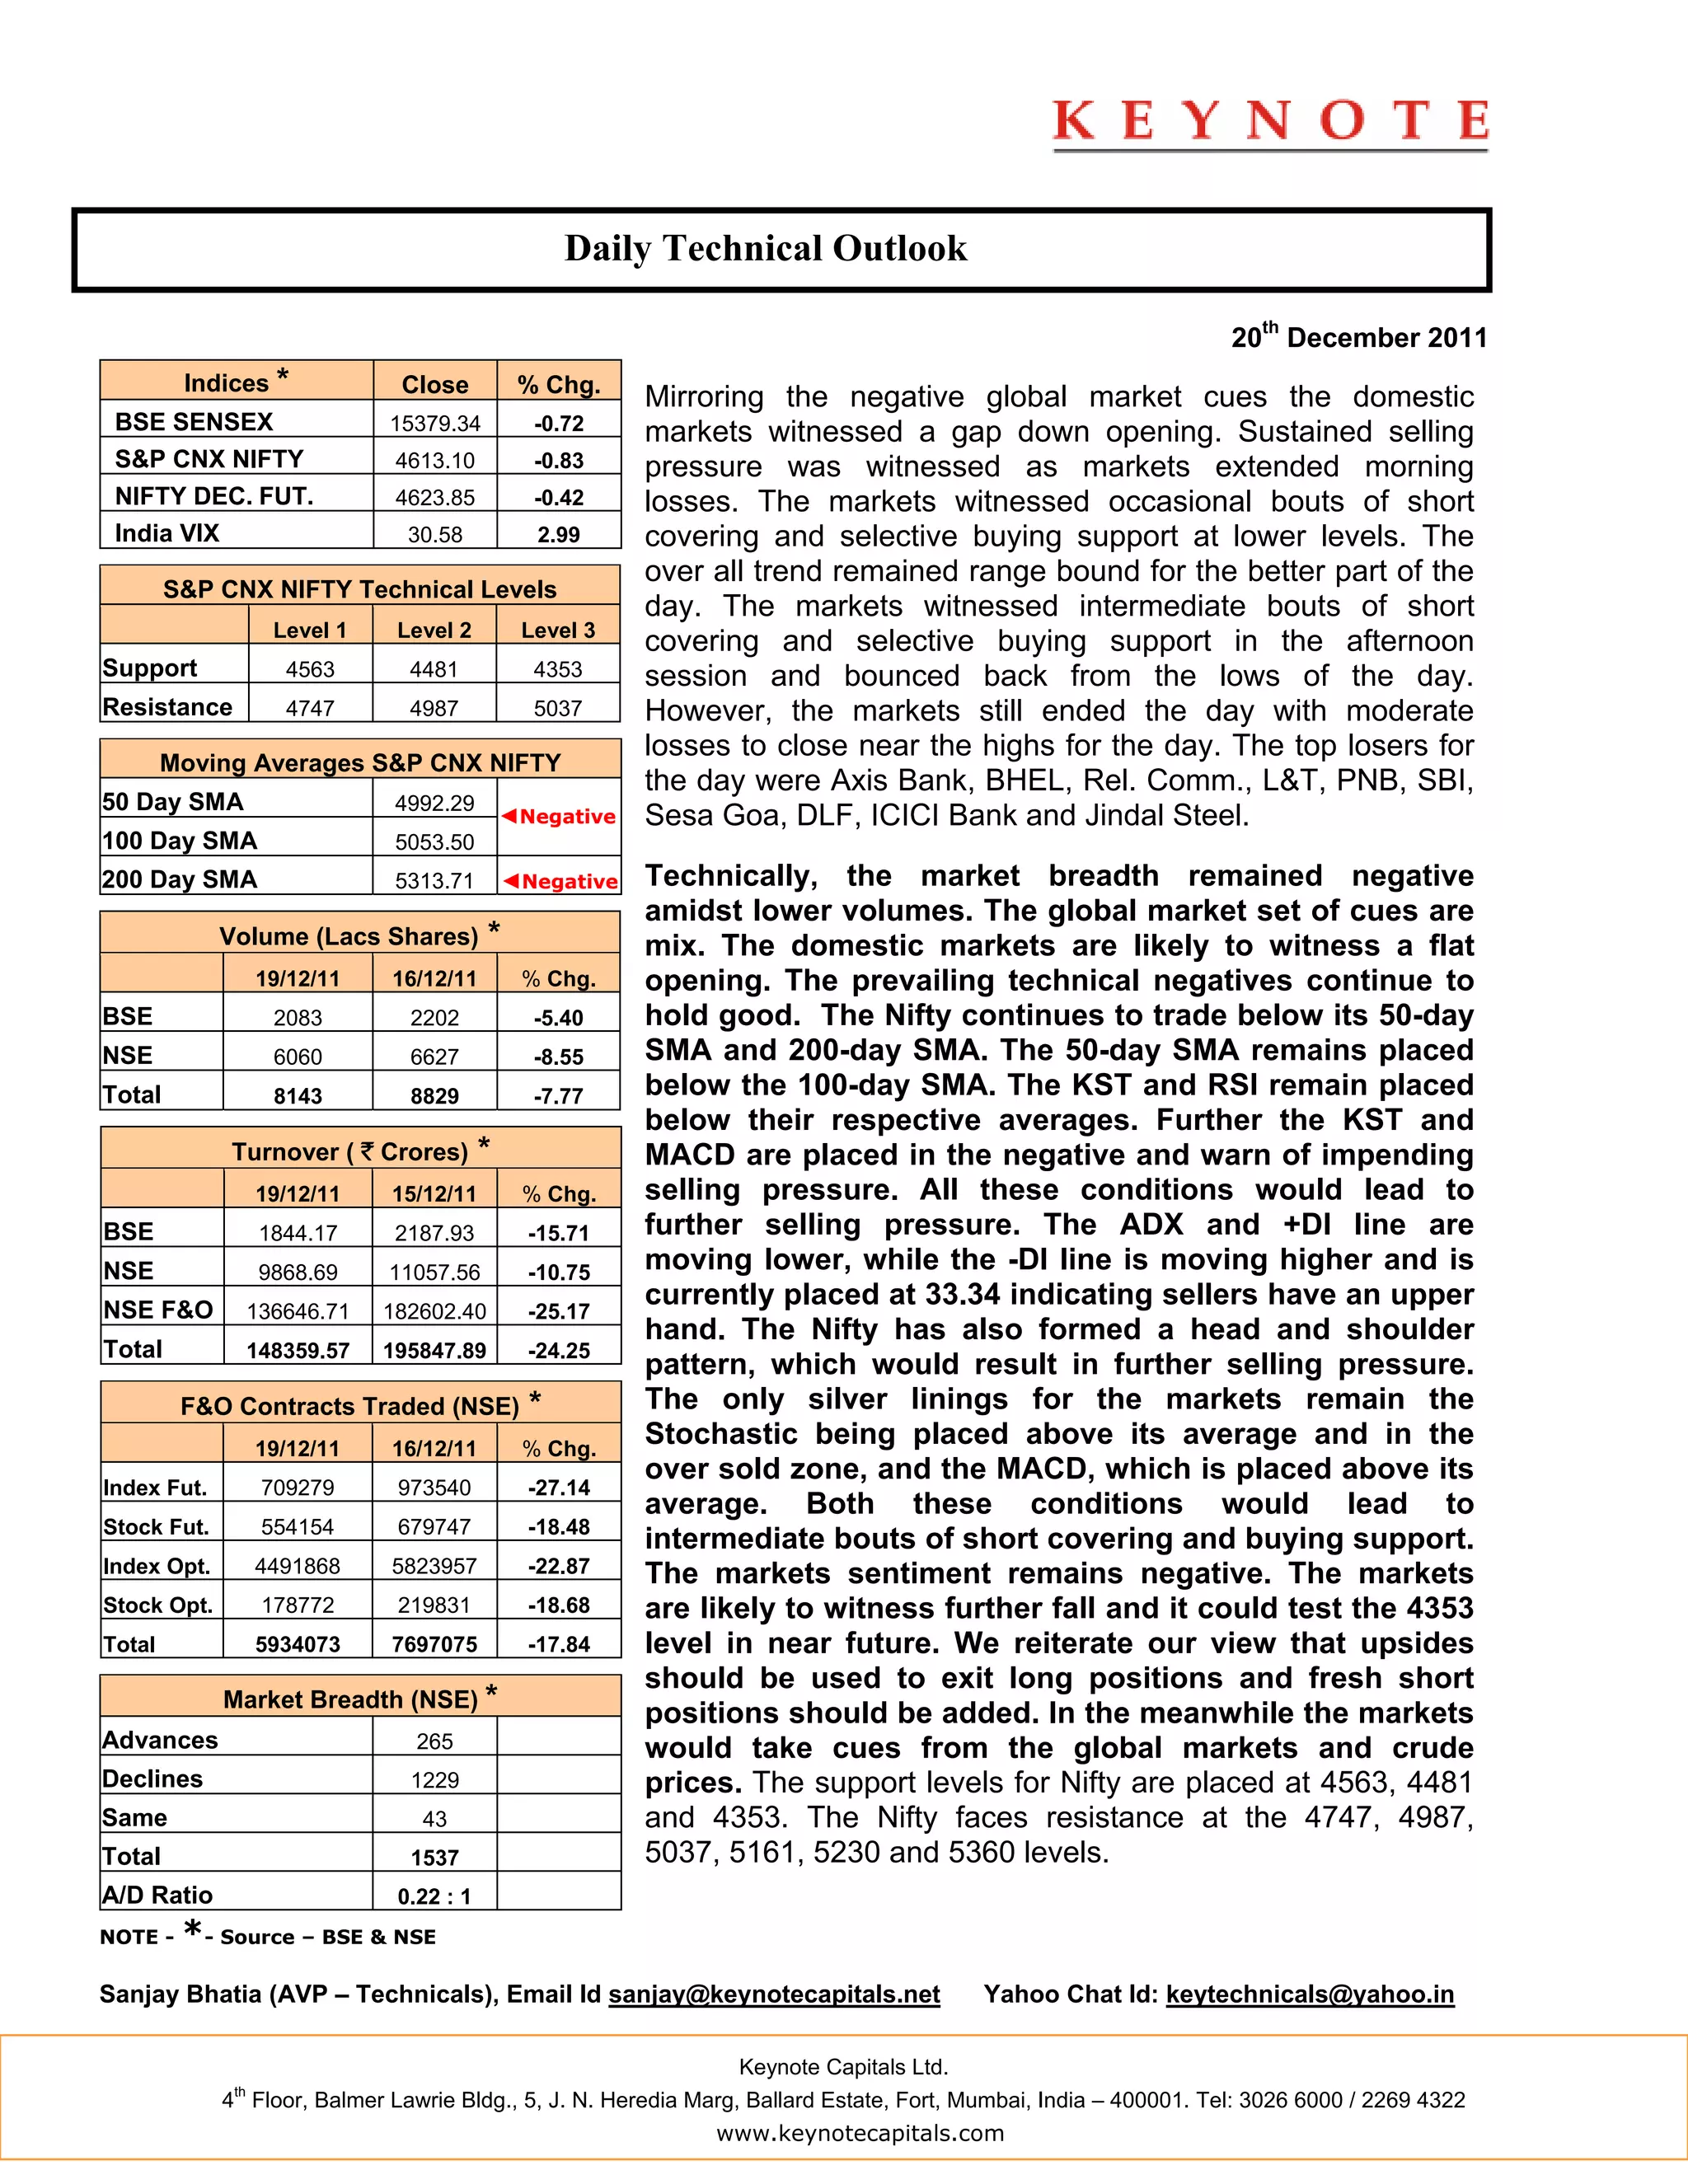

The document provides a daily technical outlook for the Indian markets on December 20th, 2011. It summarizes that the domestic markets opened lower, in line with negative global cues, and saw sustained selling pressure throughout the day. The markets bounced back from the lows but still closed with moderate losses. Technically, market breadth was negative with lower volumes and indicators like the 50-day and 200-day SMAs signaling further downside. The outlook expects the markets to open flat but remain under pressure from technical negatives. Support levels are identified at 4563, 4481, and 4353 while resistance is seen at 4747, 4987, 5037 and higher.


