Dr. C.NAGARAJU YSRCEOF YOGIVEMANAUNI
VERSITY 9949218570
1
DATA ANALYTICS WITH PANDAS
Dr C.Naga Raju
B.Tech(CSE),M.Tech(CSE),PhD(CSE),MIEEE,MCSI,MISTE
Associate Professor
Department of CSE
YSR Engineering College of YVU
Proddatur
https://archive.ics.uci.edu/ml/datasets.php
2.
INTRODUCTION TO PANDAS
•Pandas is a high-level data manipulation tool developed by Wes McKinney.
• Pandas library provides data analytics features like R programming
and MATLAB
• Pandas is built on Numpy, Scipy and Matplotlib packages so that it uses
features of these packages
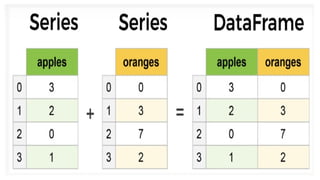
• The key data structures of pandas are 1) Series 2)Data Frames
• Series is like one dimensional array object contains data and labels(index).
• Data Frame is like two dimensional array object stores data in the form of
rows and columns.
• rows represents observations and columns represents variables.
3.
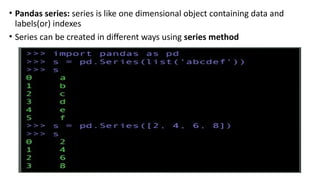
• Pandas series:series is like one dimensional object containing data and
labels(or) indexes
• Series can be created in different ways using series method
4.
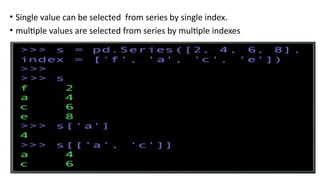
• Single valuecan be selected from series by single index.
• multiple values are selected from series by multiple indexes
5.
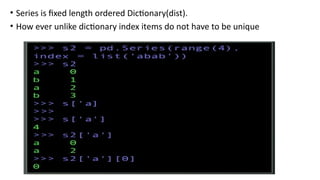
• Series isfixed length ordered Dictionary(dist).
• How ever unlike dictionary index items do not have to be unique
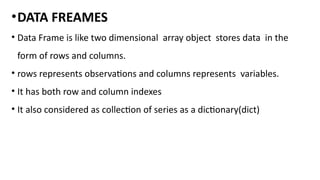
•DATA FREAMES
• DataFrame is like two dimensional array object stores data in the
form of rows and columns.
• rows represents observations and columns represents variables.
• It has both row and column indexes
• It also considered as collection of series as a dictionary(dict)
12.
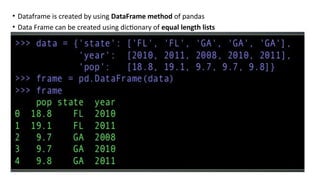
• Dataframe iscreated by using DataFrame method of pandas
• Data Frame can be created using dictionary of equal length lists
13.
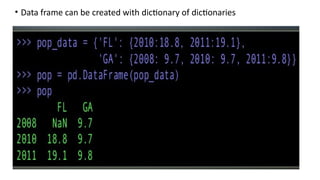
• Data framecan be created with dictionary of dictionaries
14.
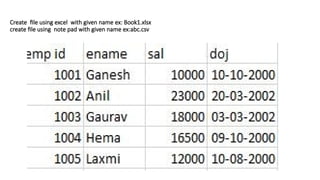
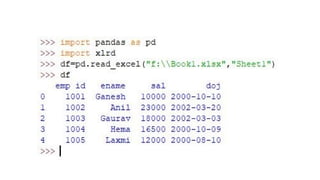
Create file usingexcel with given name ex: Book1.xlsx
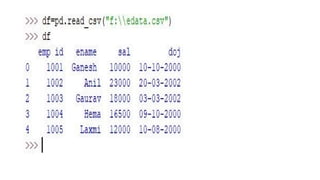
create file using note pad with given name ex:abc.csv
26.
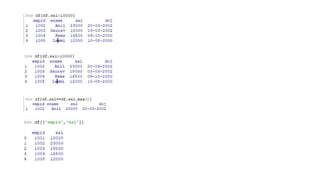
Working with thewhole DataFrame
• import numpy as np
• import matplotlib.pyplot as plt
• import pandas as pd
• from pandas import DataFrame,Series
• df=pd.DataFrame ( [ [4,7,10,20,30], [5,8,11,33,34],
[6,9,12,23,12],[4,7,10,20,30], [4,7,10,20,30],
[4,7,10,20,30]],
index=[1,2,3,4,5,6],columns=['a','b','c','d','e'])
print('dataframen’,df)
print('information about dataframen’, df.info())
dataframe
a b c d e
1 4 7 10 20 30
2 5 8 11 33 34
3 6 9 12 23 12
4 4 7 10 20 30
5 4 7 10 20 30
6 4 7 10 20 30
information about dataframe
<class 'pandas.core.frame.DataFrame'>
Int64Index: 6 entries, 1 to 6
Data columns (total 5 columns):
a 6 non-null int64
b 6 non-null int64
c 6 non-null int64
d 6 non-null int64
e 6 non-null int64
dtypes: int64(5)
memory usage: 288.0 bytes
None
27.
• n=2
• dfh=df.head(n)
print('headn',dfh)
•dft=df.tail(n)
print('tail n',dft)
• dfs=df.describe()
print('describen',dfs)
• top_left_corner_df=df.iloc[:5,:5]
print('top_left_corner_dfn',top_left_corner_df)
• dfT=df.T
print('transposen',dfT)
head
a b c d e
1 4 7 10 20 30
2 5 8 11 33 34
tail
a b c d e
5 4 7 10 20 30
6 4 7 10 20 30
describe
a b c d e
count 6.00000 6.00000 6.00000 6.000000 6.000000
mean 4.50000 7.50000 10.50000 22.666667 27.666667
std 0.83666 0.83666 0.83666 5.202563 7.840068
min 4.00000 7.00000 10.00000 20.000000 12.000000
25% 4.00000 7.00000 10.00000 20.000000 30.000000
50% 4.00000 7.00000 10.00000 20.000000 30.000000
75% 4.75000 7.75000 10.75000 22.250000 30.000000
max 6.00000 9.00000 12.00000 33.000000 34.000000
top_left_corner_df
a b c d e
1 4 7 10 20 30
2 5 8 11 33 34
3 6 9 12 23 12
4 4 7 10 20 30
5 4 7 10 20 30
transpose
1 2 3 4 5 6
a 4 5 6 4 4 4
b 7 8 9 7 7 7
c 10 11 12 10 10 10
d 20 33 23 20 20 20
e 30 34 12 30 30 30
28.
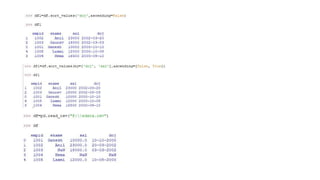
• idx =df.columns # get col index
• print('Column indexn',idx)
• label = df.columns[0] # 1st col label
• print('Column Labeln',label)
• lst = df.columns.tolist() # get as a list
• print('Column as Listn',lst)
• s = df['a'] # select col to Series
• print('col to Seriesn',s)
• s = df[['a']] # select col to df
• print('col to dfn',s)
• s = df[['a','b']] # select 2 or more
• print('select 2 or more columnsn',s)
Column index
Index(['a', 'b', 'c', 'd', 'e'], dtype='object')
Column Label
a
Column as List
['a', 'b', 'c', 'd', 'e']
col to Series
1 4
2 5
3 6
4 4
5 4
6 4
Name: a, dtype: int64
col to df
a
1 4
2 5
3 6
4 4
5 4
6 4
select 2 or more columns
a b
1 4 7
2 5 8
3 6 9
4 4 7
5 4 7
6 4 7
29.
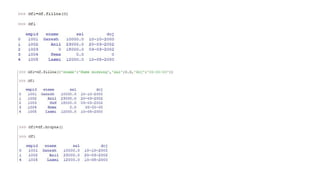
• s =df[['c','a','b']]# change order
• print('change order of columnsn',s)
• f=df.columns[[0, 3, 4]]
• print('Column name by numbern',f)
• s = df.pop('c')
• print('Deleting a columnn',df)
• idx = df.index # get row index
• print('Row indexn',idx)
change order of columns
c a b
1 10 4 7
2 11 5 8
3 12 6 9
4 10 4 7
5 10 4 7
6 10 4 7
select by number
1 7
2 8
3 9
4 7
5 7
6 7
Name: b, dtype: int64
Column name by number
Index(['a', 'd', 'e'], dtype='object')
Deleting a column
a b d e
1 4 7 20 30
2 5 8 33 34
3 6 9 23 12
4 4 7 20 30
5 4 7 20 30
6 4 7 20 30
Row index
Int64Index([1, 2, 3, 4, 5, 6], dtype='int64')
30.
• label =df.index[0] # 1st row label
• print('Row Labeln',label)
• lst = df.index.tolist() # get as a list
• print('Index as Listn',lst)
• df.sort_index(inplace=True) # sort by row
• df = df.sort_index(ascending=False)
• print('Sorting by rown',df)
Row Label
1
Index as List
[1, 2, 3, 4, 5, 6]
Sorting by row
a b d e
6 4 7 20 30
5 4 7 20 30
4 4 7 20 30
3 6 9 23 12
2 5 8 33 34
1 4 7 20 30
31.
• s=df.dtypes
print('serial coldata typen’,s)
• b=df.empty
print(' true for empty data type: ',b)
• i=df.ndim
print(' n no of dimensions: ',i)
• (r,c)=df.shape
print(n 'no of rows and cols: ’,(r,c))
• i=df.size
print(' n size: ',i)
• a=df.values
print(' n valuesn',a)
• dfc=df.copy()
print('copyn',dfc)
• dfr=df.rank()
print('rankn',dfr)
serial col data type
a int64
b int64
c int64
d int64
e int64
dtype: object
true for empty data type: False
no of dimensions: 2
no of rows and cols: (6, 5)
size: 30
values
[[ 4 7 10 20 30]
[ 5 8 11 33 34]
[ 6 9 12 23 12]
[ 4 7 10 20 30]
[ 4 7 10 20 30]
[ 4 7 10 20 30]]
copy
a b c d e
1 4 7 10 20 30
2 5 8 11 33 34
3 6 9 12 23 12
4 4 7 10 20 30
5 4 7 10 20 30
6 4 7 10 20 30
rank
a b c d e
1 2.5 2.5 2.5 2.5 3.5
2 5.0 5.0 5.0 6.0 6.0
3 6.0 6.0 6.0 5.0 1.0
4 2.5 2.5 2.5 2.5 3.5
5 2.5 2.5 2.5 2.5 3.5
6 2.5 2.5 2.5 2.5 3.5
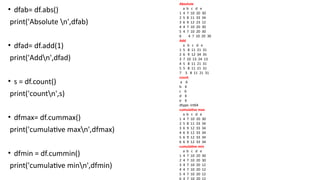
32.
• dfab= df.abs()
print('Absoluten',dfab)
• dfad= df.add(1)
print('Addn',dfad)
• s = df.count()
print('countn',s)
• dfmax= df.cummax()
print('cumulative maxn',dfmax)
• dfmin = df.cummin()
print('cumulative minn',dfmin)
Absolute
a b c d e
1 4 7 10 20 30
2 5 8 11 33 34
3 6 9 12 23 12
4 4 7 10 20 30
5 4 7 10 20 30
6 4 7 10 20 30
Add
a b c d e
1 5 8 11 21 31
2 6 9 12 34 35
3 7 10 13 24 13
4 5 8 11 21 31
5 5 8 11 21 31
7 5 8 11 21 31
count
a 6
b 6
c 6
d 6
e 6
dtype: int64
cumulative max
a b c d e
1 4 7 10 20 30
2 5 8 11 33 34
3 6 9 12 33 34
4 6 9 12 33 34
5 6 9 12 33 34
6 6 9 12 33 34
cumulative min
a b c d e
1 4 7 10 20 30
2 4 7 10 20 30
3 4 7 10 20 12
4 4 7 10 20 12
5 4 7 10 20 12
6 4 7 10 20 12
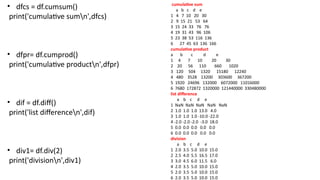
33.
cumulative sum
a bc d e
1 4 7 10 20 30
2 9 15 21 53 64
3 15 24 33 76 76
4 19 31 43 96 106
5 23 38 53 116 136
6 27 45 63 136 166
cumulative product
a b c d e
1 4 7 10 20 30
2 20 56 110 660 1020
3 120 504 1320 15180 12240
4 480 3528 13200 303600 367200
5 1920 24696 132000 6072000 11016000
6 7680 172872 1320000 121440000 330480000
list difference
a b c d e
1 NaN NaN NaN NaN NaN
2 1.0 1.0 1.0 13.0 4.0
3 1.0 1.0 1.0 -10.0 -22.0
4 -2.0 -2.0 -2.0 -3.0 18.0
5 0.0 0.0 0.0 0.0 0.0
6 0.0 0.0 0.0 0.0 0.0
division
a b c d e
1 2.0 3.5 5.0 10.0 15.0
2 2.5 4.0 5.5 16.5 17.0
3 3.0 4.5 6.0 11.5 6.0
4 2.0 3.5 5.0 10.0 15.0
5 2.0 3.5 5.0 10.0 15.0
6 2.0 3.5 5.0 10.0 15.0
• dfcs = df.cumsum()
print('cumulative sumn',dfcs)
• dfpr= df.cumprod()
print('cumulative productn',dfpr)
• dif = df.diff()
print('list differencen',dif)
• div1= df.div(2)
print('divisionn',div1)
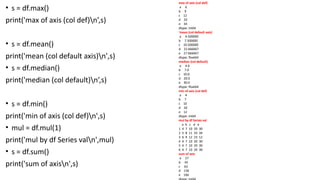
34.
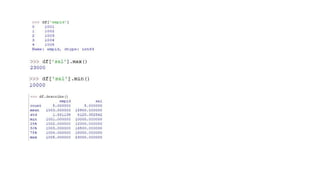
• s =df.max()
print('max of axis (col def)n’,s)
• s = df.mean()
print('mean (col default axis)n',s)
• s = df.median()
print('median (col default)n’,s)
• s = df.min()
print('min of axis (col def)n',s)
• mul = df.mul(1)
print('mul by df Series valn',mul)
• s = df.sum()
print('sum of axisn',s)
max of axis (col def)
a 6
b 9
c 12
d 33
e 34
dtype: int64
'mean (col default axis)
a 4.500000
b 7.500000
c 10.500000
d 22.666667
e 27.666667
dtype: float64
median (col default)
a 4.0
b 7.0
c 10.0
d 20.0
e 30.0
dtype: float64
min of axis (col def)
a 4
b 7
c 10
d 20
e 12
dtype: int64
mul by df Series val
a b c d e
1 4 7 10 20 30
2 5 8 11 33 34
3 6 9 12 23 12
4 4 7 10 20 30
5 4 7 10 20 30
6 4 7 10 20 30
sum of axis
a 27
b 45
c 63
d 136
e 166
35.
Dataframe filters forselection of rows and col
• dffi=df.filter(items=['a','b'])
print('Filter by col n',dffi)
• dfrow=df.filter(items=[2],axis=0)
print('filter by rown',dfrow)
• dfin=df.filter(like='%a%')
print('Filter in coln',dfin)
Filter by col
a b
1 4 7
2 5 8
3 6 9
4 4 7
5 4 7
6 4 7
filter by row
a b c d e
7 5 8 11 33 34
Filter in col
Empty DataFrame
Columns: []
Index: [1, 2, 3, 4, 5, 6]
36.
Basic Statistics
• s= df['a'].describe()
print('describe col an',s)
• cor=df.corr()
print('correlation n',cor)
• cov=df.cov()
print('covariancen',cov)
• kur=df.kurt()
print('kurtosis n',kur)
describe col a
count 6.00000
mean 4.50000
std 0.83666
min 4.00000
25% 4.00000
50% 4.00000
75% 4.75000
max 6.00000
Name: a, dtype: float64
correlation
a b c d e
a 1.000000 1.000000 1.000000 0.505424 -0.762257
b 1.000000 1.000000 1.000000 0.505424 -0.762257
c 1.000000 1.000000 1.000000 0.505424 -0.762257
d 0.505424 0.505424 0.505424 1.000000 0.173252
e -0.762257 -0.762257 -0.762257 0.173252 1.000000
covariance
a b c d e
a 0.7 0.7 0.7 2.200000 -5.000000
b 0.7 0.7 0.7 2.200000 -5.000000
c 0.7 0.7 0.7 2.200000 -5.000000
d 2.2 2.2 2.2 27.066667 7.066667
e -5.0 -5.0 -5.0 7.066667 61.466667
kurtosis
a 1.428571
b 1.428571
c 1.428571
d 4.837353
e 5.231624
dtype: float64
37.
• mdev=df.mad()
print(' meanabsolute deviationn',mdev)
• serr=df.sem()
print(' standard error of meann',serr)
• vaco=df.var()
print('variance over cols n',vaco)
• s = df['a'].value_counts()
print('value count in col an',s)
mean absolute deviation
a 0.666667
b 0.666667
c 0.666667
d 3.555556
e 5.222222
dtype: float64
standard error of mean
a 0.341565
b 0.341565
c 0.341565
d 2.123938
e 3.200694
dtype: float64
variance over cols
a 0.700000
b 0.700000
c 0.700000
d 27.066667
e 61.466667
dtype: float64
value count in col a
4 4
6 1
5 1
Name: a, dtype: int64
38.
Cross-tabulation (frequency count)
•ct = pd.crosstab(index=df['a'],columns=df['b'])
print(‘Crosstabn',ct)
Quantiles and ranking
• quants = [0.05, 0.25, 0.5, 0.75, 0.95]
• q = df.quantile(quants)
print(‘Quantilen’,q)
• r = df.rank()
print('Rankn',r)
Crosstab
b 7 8 9
a
4 4 0 0
5 0 1 0
6 0 0 1
Quantile
a b c d e
0.05 4.00 7.00 10.00 20.00 16.5
0.25 4.00 7.00 10.00 20.00 30.0
0.50 4.00 7.00 10.00 20.00 30.0
0.75 4.75 7.75 10.75 22.25 30.0
0.95 5.75 8.75 11.75 30.50 33.0
Rank
a b c d e
1 2.5 2.5 2.5 2.5 3.5
2 5.0 5.0 5.0 6.0 6.0
3 6.0 6.0 6.0 5.0 1.0
4 2.5 2.5 2.5 2.5 3.5
5 2.5 2.5 2.5 2.5 3.5
6 2.5 2.5 2.5 2.5 3.5
39.
Working with strings
assumethat df['col'] is series of strings
• df['col']=('niki’)
• s = df['col'].str.lower()
print('Lower n',s)
• s = df['col'].str.upper()
print('Uppern',s)
• s = df['col'].str.len()
print('Lengthn',s)
Lower
1 niki
2 niki
3 niki
4 niki
5 niki
6 niki
Name: col, dtype: object
Upper
1 NIKI
2 NIKI
3 NIKI
4 NIKI
5 NIKI
6 NIKI
Name: col, dtype: object
Length
1 4
2 4
3 4
4 4
5 4
6 4
Name: col, dtype: int64
Working with Columns
•idx = df.columns
print('Column indexn',idx)
• label = df.columns[0]
print('Column Labeln',label)
• lst = df.columns.tolist()
print('Column as Listn',lst)
• s = df['a']
print('col to Seriesn',s)
• s = df[['a']]
print('col to dfn',s)
Column index
Index(['a', 'b', 'c', 'd', 'e'], dtype='object')
Column Label
a
Column as List
['a', 'b', 'c', 'd', 'e’]
col to Series
1 4
2 5
3 6
4 4
5 4
6 4
Name: a, dtype: int64
col to df
a
1 4
2 5
3 6
4 4
5 4
6 4
42.
• s =df[['a','b']]
print('select 2 or more columnsn’,s)
• s = df[['c','a','b']]
print('change order of columnsn',s)
• s = df[df.columns[1]]
print('select by numbern',s)
• f=df.columns[[0, 3, 4]]
print('Column name by numbern',f)
• s = df.pop('c')
print('Deleting a columnn',df)
select 2 or more columns
a b
1 4 7
2 5 8
3 6 9
4 4 7
5 4 7
6 4 7
change order of columns
c a b
1 10 4 7
2 11 5 8
3 12 6 9
4 10 4 7
5 10 4 7
6 10 4 7
select by number
1 7
2 8
3 9
4 7
5 7
6 7
Name: b, dtype: int64
Column name by number
Index(['a', 'd', 'e'], dtype='object')
Deleting a column
a b d e
1 4 7 20 30
2 5 8 33 34
3 6 9 23 12
4 4 7 20 30
5 4 7 20 30
6 4 7 20 30
43.
Working with rows
•idx = df.index
print('Row indexn',idx)
• label = df.index[0]
print('Row Labeln',label)
• lst = df.index.tolist()
print('Index as Listn',lst)
• df.sort_index(inplace=True)
• df = df.sort_index(ascending=False)
print('Sorting by rown',df)
Row index
Int64Index([1, 2, 3, 4, 5, 6], dtype='int64')
Row Label
1
Index as List
[1, 2, 3, 4, 5, 6]
Sorting by row
a b c d e
6 4 7 10 20 30
5 4 7 10 20 30
4 4 7 10 20 30
3 6 9 12 23 12
2 5 8 11 33 34
1 4 7 10 20 30
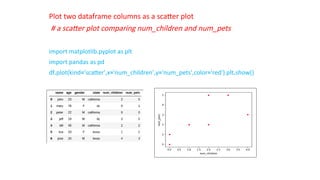
Plot two dataframecolumns as a scatter plot
# a scatter plot comparing num_children and num_pets
import matplotlib.pyplot as plt
import pandas as pd
df.plot(kind='scatter',x='num_children',y='num_pets',color='red') plt.show()
56.
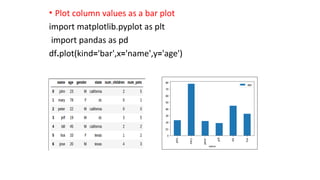
• Plot columnvalues as a bar plot
import matplotlib.pyplot as plt
import pandas as pd
df.plot(kind='bar',x='name',y='age')
57.
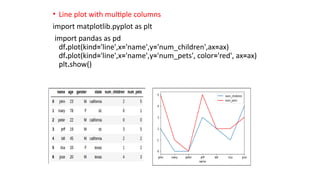
• Line plotwith multiple columns
import matplotlib.pyplot as plt
import pandas as pd
df.plot(kind='line',x='name',y='num_children',ax=ax)
df.plot(kind='line',x='name',y='num_pets', color='red', ax=ax)
plt.show()
58.
• Bar plotwith group by
import matplotlib.pyplot as plt
import pandas as pd df.groupby('state')
['name'].nunique().plot(kind='bar') plt.show()
59.
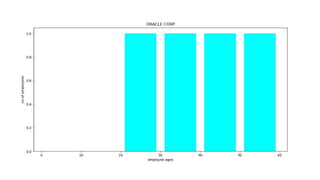
Plot histogram ofcolumn values
import matplotlib.pyplot as plt
import pandas as pd
df[['age']].plot(kind='hist',bins=[0,20,40,60,80,100],rwidth=0.8)
plt.show()


![Working with the whole DataFrame
• import numpy as np
• import matplotlib.pyplot as plt
• import pandas as pd
• from pandas import DataFrame,Series
• df=pd.DataFrame ( [ [4,7,10,20,30], [5,8,11,33,34],
[6,9,12,23,12],[4,7,10,20,30], [4,7,10,20,30],
[4,7,10,20,30]],
index=[1,2,3,4,5,6],columns=['a','b','c','d','e'])
print('dataframen’,df)
print('information about dataframen’, df.info())
dataframe
a b c d e
1 4 7 10 20 30
2 5 8 11 33 34
3 6 9 12 23 12
4 4 7 10 20 30
5 4 7 10 20 30
6 4 7 10 20 30
information about dataframe
<class 'pandas.core.frame.DataFrame'>
Int64Index: 6 entries, 1 to 6
Data columns (total 5 columns):
a 6 non-null int64
b 6 non-null int64
c 6 non-null int64
d 6 non-null int64
e 6 non-null int64
dtypes: int64(5)
memory usage: 288.0 bytes
None](https://image.slidesharecdn.com/kbnpandas-250910021432-4a4792bd/85/KBN-Pandas-in-python-for-Btech-students-pptx-26-320.jpg)
![• n=2
• dfh=df.head(n)
print('headn',dfh)
• dft=df.tail(n)
print('tail n',dft)
• dfs=df.describe()
print('describen',dfs)
• top_left_corner_df=df.iloc[:5,:5]
print('top_left_corner_dfn',top_left_corner_df)
• dfT=df.T
print('transposen',dfT)
head
a b c d e
1 4 7 10 20 30
2 5 8 11 33 34
tail
a b c d e
5 4 7 10 20 30
6 4 7 10 20 30
describe
a b c d e
count 6.00000 6.00000 6.00000 6.000000 6.000000
mean 4.50000 7.50000 10.50000 22.666667 27.666667
std 0.83666 0.83666 0.83666 5.202563 7.840068
min 4.00000 7.00000 10.00000 20.000000 12.000000
25% 4.00000 7.00000 10.00000 20.000000 30.000000
50% 4.00000 7.00000 10.00000 20.000000 30.000000
75% 4.75000 7.75000 10.75000 22.250000 30.000000
max 6.00000 9.00000 12.00000 33.000000 34.000000
top_left_corner_df
a b c d e
1 4 7 10 20 30
2 5 8 11 33 34
3 6 9 12 23 12
4 4 7 10 20 30
5 4 7 10 20 30
transpose
1 2 3 4 5 6
a 4 5 6 4 4 4
b 7 8 9 7 7 7
c 10 11 12 10 10 10
d 20 33 23 20 20 20
e 30 34 12 30 30 30](https://image.slidesharecdn.com/kbnpandas-250910021432-4a4792bd/85/KBN-Pandas-in-python-for-Btech-students-pptx-27-320.jpg)
![• idx = df.columns # get col index
• print('Column indexn',idx)
• label = df.columns[0] # 1st col label
• print('Column Labeln',label)
• lst = df.columns.tolist() # get as a list
• print('Column as Listn',lst)
• s = df['a'] # select col to Series
• print('col to Seriesn',s)
• s = df[['a']] # select col to df
• print('col to dfn',s)
• s = df[['a','b']] # select 2 or more
• print('select 2 or more columnsn',s)
Column index
Index(['a', 'b', 'c', 'd', 'e'], dtype='object')
Column Label
a
Column as List
['a', 'b', 'c', 'd', 'e']
col to Series
1 4
2 5
3 6
4 4
5 4
6 4
Name: a, dtype: int64
col to df
a
1 4
2 5
3 6
4 4
5 4
6 4
select 2 or more columns
a b
1 4 7
2 5 8
3 6 9
4 4 7
5 4 7
6 4 7](https://image.slidesharecdn.com/kbnpandas-250910021432-4a4792bd/85/KBN-Pandas-in-python-for-Btech-students-pptx-28-320.jpg)
![• s = df[['c','a','b']]# change order
• print('change order of columnsn',s)
• f=df.columns[[0, 3, 4]]
• print('Column name by numbern',f)
• s = df.pop('c')
• print('Deleting a columnn',df)
• idx = df.index # get row index
• print('Row indexn',idx)
change order of columns
c a b
1 10 4 7
2 11 5 8
3 12 6 9
4 10 4 7
5 10 4 7
6 10 4 7
select by number
1 7
2 8
3 9
4 7
5 7
6 7
Name: b, dtype: int64
Column name by number
Index(['a', 'd', 'e'], dtype='object')
Deleting a column
a b d e
1 4 7 20 30
2 5 8 33 34
3 6 9 23 12
4 4 7 20 30
5 4 7 20 30
6 4 7 20 30
Row index
Int64Index([1, 2, 3, 4, 5, 6], dtype='int64')](https://image.slidesharecdn.com/kbnpandas-250910021432-4a4792bd/85/KBN-Pandas-in-python-for-Btech-students-pptx-29-320.jpg)
![• label = df.index[0] # 1st row label
• print('Row Labeln',label)
• lst = df.index.tolist() # get as a list
• print('Index as Listn',lst)
• df.sort_index(inplace=True) # sort by row
• df = df.sort_index(ascending=False)
• print('Sorting by rown',df)
Row Label
1
Index as List
[1, 2, 3, 4, 5, 6]
Sorting by row
a b d e
6 4 7 20 30
5 4 7 20 30
4 4 7 20 30
3 6 9 23 12
2 5 8 33 34
1 4 7 20 30](https://image.slidesharecdn.com/kbnpandas-250910021432-4a4792bd/85/KBN-Pandas-in-python-for-Btech-students-pptx-30-320.jpg)
![• s=df.dtypes
print('serial col data typen’,s)
• b=df.empty
print(' true for empty data type: ',b)
• i=df.ndim
print(' n no of dimensions: ',i)
• (r,c)=df.shape
print(n 'no of rows and cols: ’,(r,c))
• i=df.size
print(' n size: ',i)
• a=df.values
print(' n valuesn',a)
• dfc=df.copy()
print('copyn',dfc)
• dfr=df.rank()
print('rankn',dfr)
serial col data type
a int64
b int64
c int64
d int64
e int64
dtype: object
true for empty data type: False
no of dimensions: 2
no of rows and cols: (6, 5)
size: 30
values
[[ 4 7 10 20 30]
[ 5 8 11 33 34]
[ 6 9 12 23 12]
[ 4 7 10 20 30]
[ 4 7 10 20 30]
[ 4 7 10 20 30]]
copy
a b c d e
1 4 7 10 20 30
2 5 8 11 33 34
3 6 9 12 23 12
4 4 7 10 20 30
5 4 7 10 20 30
6 4 7 10 20 30
rank
a b c d e
1 2.5 2.5 2.5 2.5 3.5
2 5.0 5.0 5.0 6.0 6.0
3 6.0 6.0 6.0 5.0 1.0
4 2.5 2.5 2.5 2.5 3.5
5 2.5 2.5 2.5 2.5 3.5
6 2.5 2.5 2.5 2.5 3.5](https://image.slidesharecdn.com/kbnpandas-250910021432-4a4792bd/85/KBN-Pandas-in-python-for-Btech-students-pptx-31-320.jpg)
![Dataframe filters for selection of rows and col
• dffi=df.filter(items=['a','b'])
print('Filter by col n',dffi)
• dfrow=df.filter(items=[2],axis=0)
print('filter by rown',dfrow)
• dfin=df.filter(like='%a%')
print('Filter in coln',dfin)
Filter by col
a b
1 4 7
2 5 8
3 6 9
4 4 7
5 4 7
6 4 7
filter by row
a b c d e
7 5 8 11 33 34
Filter in col
Empty DataFrame
Columns: []
Index: [1, 2, 3, 4, 5, 6]](https://image.slidesharecdn.com/kbnpandas-250910021432-4a4792bd/85/KBN-Pandas-in-python-for-Btech-students-pptx-35-320.jpg)
![Basic Statistics
• s = df['a'].describe()
print('describe col an',s)
• cor=df.corr()
print('correlation n',cor)
• cov=df.cov()
print('covariancen',cov)
• kur=df.kurt()
print('kurtosis n',kur)
describe col a
count 6.00000
mean 4.50000
std 0.83666
min 4.00000
25% 4.00000
50% 4.00000
75% 4.75000
max 6.00000
Name: a, dtype: float64
correlation
a b c d e
a 1.000000 1.000000 1.000000 0.505424 -0.762257
b 1.000000 1.000000 1.000000 0.505424 -0.762257
c 1.000000 1.000000 1.000000 0.505424 -0.762257
d 0.505424 0.505424 0.505424 1.000000 0.173252
e -0.762257 -0.762257 -0.762257 0.173252 1.000000
covariance
a b c d e
a 0.7 0.7 0.7 2.200000 -5.000000
b 0.7 0.7 0.7 2.200000 -5.000000
c 0.7 0.7 0.7 2.200000 -5.000000
d 2.2 2.2 2.2 27.066667 7.066667
e -5.0 -5.0 -5.0 7.066667 61.466667
kurtosis
a 1.428571
b 1.428571
c 1.428571
d 4.837353
e 5.231624
dtype: float64](https://image.slidesharecdn.com/kbnpandas-250910021432-4a4792bd/85/KBN-Pandas-in-python-for-Btech-students-pptx-36-320.jpg)
![• mdev=df.mad()
print(' mean absolute deviationn',mdev)
• serr=df.sem()
print(' standard error of meann',serr)
• vaco=df.var()
print('variance over cols n',vaco)
• s = df['a'].value_counts()
print('value count in col an',s)
mean absolute deviation
a 0.666667
b 0.666667
c 0.666667
d 3.555556
e 5.222222
dtype: float64
standard error of mean
a 0.341565
b 0.341565
c 0.341565
d 2.123938
e 3.200694
dtype: float64
variance over cols
a 0.700000
b 0.700000
c 0.700000
d 27.066667
e 61.466667
dtype: float64
value count in col a
4 4
6 1
5 1
Name: a, dtype: int64](https://image.slidesharecdn.com/kbnpandas-250910021432-4a4792bd/85/KBN-Pandas-in-python-for-Btech-students-pptx-37-320.jpg)
![Cross-tabulation (frequency count)
• ct = pd.crosstab(index=df['a'],columns=df['b'])
print(‘Crosstabn',ct)
Quantiles and ranking
• quants = [0.05, 0.25, 0.5, 0.75, 0.95]
• q = df.quantile(quants)
print(‘Quantilen’,q)
• r = df.rank()
print('Rankn',r)
Crosstab
b 7 8 9
a
4 4 0 0
5 0 1 0
6 0 0 1
Quantile
a b c d e
0.05 4.00 7.00 10.00 20.00 16.5
0.25 4.00 7.00 10.00 20.00 30.0
0.50 4.00 7.00 10.00 20.00 30.0
0.75 4.75 7.75 10.75 22.25 30.0
0.95 5.75 8.75 11.75 30.50 33.0
Rank
a b c d e
1 2.5 2.5 2.5 2.5 3.5
2 5.0 5.0 5.0 6.0 6.0
3 6.0 6.0 6.0 5.0 1.0
4 2.5 2.5 2.5 2.5 3.5
5 2.5 2.5 2.5 2.5 3.5
6 2.5 2.5 2.5 2.5 3.5](https://image.slidesharecdn.com/kbnpandas-250910021432-4a4792bd/85/KBN-Pandas-in-python-for-Btech-students-pptx-38-320.jpg)
![Working with strings
assume that df['col'] is series of strings
• df['col']=('niki’)
• s = df['col'].str.lower()
print('Lower n',s)
• s = df['col'].str.upper()
print('Uppern',s)
• s = df['col'].str.len()
print('Lengthn',s)
Lower
1 niki
2 niki
3 niki
4 niki
5 niki
6 niki
Name: col, dtype: object
Upper
1 NIKI
2 NIKI
3 NIKI
4 NIKI
5 NIKI
6 NIKI
Name: col, dtype: object
Length
1 4
2 4
3 4
4 4
5 4
6 4
Name: col, dtype: int64](https://image.slidesharecdn.com/kbnpandas-250910021432-4a4792bd/85/KBN-Pandas-in-python-for-Btech-students-pptx-39-320.jpg)
![• df['col'] += 'suffix'
print('Appendn',df['col’])
• df['col']=('niki')
• df['col'] *= 2
print('duplicaten',df['col’])
• df['col']=('niki')
• s = df['col'] + df['col']
print('concatenaten',s)
Append
1 nikisuffix
2 nikisuffix
3 nikisuffix
4 nikisuffix
5 nikisuffix
6 nikisuffix
Name: col, dtype: object
duplicate
1 nikiniki
2 nikiniki
3 nikiniki
4 nikiniki
5 nikiniki
6 nikiniki
Name: col, dtype: object
concatenate
1 nikiniki
2 nikiniki
3 nikiniki
4 nikiniki
5 nikiniki
6 nikiniki
Name: col, dtype: object](https://image.slidesharecdn.com/kbnpandas-250910021432-4a4792bd/85/KBN-Pandas-in-python-for-Btech-students-pptx-40-320.jpg)
![Working with Columns
• idx = df.columns
print('Column indexn',idx)
• label = df.columns[0]
print('Column Labeln',label)
• lst = df.columns.tolist()
print('Column as Listn',lst)
• s = df['a']
print('col to Seriesn',s)
• s = df[['a']]
print('col to dfn',s)
Column index
Index(['a', 'b', 'c', 'd', 'e'], dtype='object')
Column Label
a
Column as List
['a', 'b', 'c', 'd', 'e’]
col to Series
1 4
2 5
3 6
4 4
5 4
6 4
Name: a, dtype: int64
col to df
a
1 4
2 5
3 6
4 4
5 4
6 4](https://image.slidesharecdn.com/kbnpandas-250910021432-4a4792bd/85/KBN-Pandas-in-python-for-Btech-students-pptx-41-320.jpg)
![• s = df[['a','b']]
print('select 2 or more columnsn’,s)
• s = df[['c','a','b']]
print('change order of columnsn',s)
• s = df[df.columns[1]]
print('select by numbern',s)
• f=df.columns[[0, 3, 4]]
print('Column name by numbern',f)
• s = df.pop('c')
print('Deleting a columnn',df)
select 2 or more columns
a b
1 4 7
2 5 8
3 6 9
4 4 7
5 4 7
6 4 7
change order of columns
c a b
1 10 4 7
2 11 5 8
3 12 6 9
4 10 4 7
5 10 4 7
6 10 4 7
select by number
1 7
2 8
3 9
4 7
5 7
6 7
Name: b, dtype: int64
Column name by number
Index(['a', 'd', 'e'], dtype='object')
Deleting a column
a b d e
1 4 7 20 30
2 5 8 33 34
3 6 9 23 12
4 4 7 20 30
5 4 7 20 30
6 4 7 20 30](https://image.slidesharecdn.com/kbnpandas-250910021432-4a4792bd/85/KBN-Pandas-in-python-for-Btech-students-pptx-42-320.jpg)
![Working with rows
• idx = df.index
print('Row indexn',idx)
• label = df.index[0]
print('Row Labeln',label)
• lst = df.index.tolist()
print('Index as Listn',lst)
• df.sort_index(inplace=True)
• df = df.sort_index(ascending=False)
print('Sorting by rown',df)
Row index
Int64Index([1, 2, 3, 4, 5, 6], dtype='int64')
Row Label
1
Index as List
[1, 2, 3, 4, 5, 6]
Sorting by row
a b c d e
6 4 7 10 20 30
5 4 7 10 20 30
4 4 7 10 20 30
3 6 9 12 23 12
2 5 8 11 33 34
1 4 7 10 20 30](https://image.slidesharecdn.com/kbnpandas-250910021432-4a4792bd/85/KBN-Pandas-in-python-for-Btech-students-pptx-43-320.jpg)

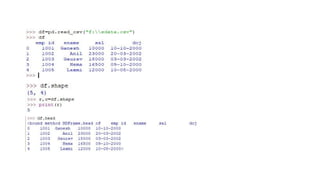
![import pandas as pd
df = pd.DataFrame ( { 'name':['john','mary','peter','jeff','bill','lisa','jose'],
'age':[23,78,22,19,45,33,20],
'gender':['M','F','M','M','M','F','M'],
'state':['california','dc','california','dc','california','texas','texas'],
'num_children':[2,0,0,3,2,1,4],
'num_pets':[5,1,0,5,2,2,3] } )](https://image.slidesharecdn.com/kbnpandas-250910021432-4a4792bd/85/KBN-Pandas-in-python-for-Btech-students-pptx-54-320.jpg)
![• Bar plot with group by
import matplotlib.pyplot as plt
import pandas as pd df.groupby('state')
['name'].nunique().plot(kind='bar') plt.show()](https://image.slidesharecdn.com/kbnpandas-250910021432-4a4792bd/85/KBN-Pandas-in-python-for-Btech-students-pptx-58-320.jpg)
![Plot histogram of column values
import matplotlib.pyplot as plt
import pandas as pd
df[['age']].plot(kind='hist',bins=[0,20,40,60,80,100],rwidth=0.8)
plt.show()](https://image.slidesharecdn.com/kbnpandas-250910021432-4a4792bd/85/KBN-Pandas-in-python-for-Btech-students-pptx-59-320.jpg)