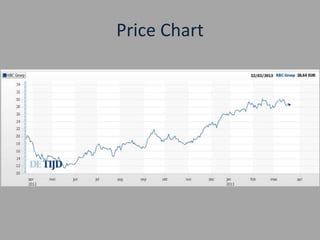
KBC Group NV


Alice Michenaud 2AF3
Table of contents
Price Chart
Current profit and dividend
Ratios
Analysis
Conclusion
Sources
Price Chart
Price Chart
70

60   65.2

50

40                                      Average rate during the
                   32.6                 financial year
30
            30.4                        Closing rate
                   25.5          26.2
20                        22.3
     21.5   20.9
                                 17.3
10
                          9.7
 0
     2008   2009   2010   2011   2012
Current profit & Dividend

                  2012   2013   2014


Current profit/
                  4,40   2,79   3,34
share


Dividend/share    0,72   0,33   0,11
Ratios


               2008      2009      2010      2011        2012
Tier 1 Ratio      8.9%     10.8%     12.6%     12.3%       13.8%

Return on                                           5%      10%
equity
Analysis


PEG Ratio              -0,64

Beta                   1,48
Conclusion
Sources
• http://www.tijd.be/beurzen/KBC_Groep.60114924
• https://multimediafiles.kbcgroup.eu/ng/published/KBC
  COM/PDF/COM_pb_4Q2012_14_feb_2013_nl.pdf
• https://europeanequities.nyx.com/en/products/equitie
  s/BE0003565737-XBRU/quotes
• https://www.kbc.com/MISC/D9e01/~N/~KBCCOM/~BZ
  J52CT/-BZIZTPN/BZJ0507/BZL0EEP
• http://financieel.infonu.nl/geld/26397-tier-1-ratio-
  nieuwe-indicator-betrouwbaarheid-banken.html
• http://www.investopedia.com/terms/r/returnonequity.
  asp

KBC Group NV