Economic Project Planning,Monitoring & Evaluation
ECO4204
Project Risk Management
Kassan Kaselema
Catholic University of Malawi
2.
Risk
“Possibility ofsuffering harm or loss” (PMI)
“Uncertainty inherent in plans and the possibility that can affect the
prospects of achieving business or project goals” (BS 6079)
Maylor (2005:191)
https://jcu.pressbooks.pub/pmriskquality/chapter/module-4-mitigation-and-co
ntingency-risk-plan/
3.
Project Risk management
Risks are assumed problems which may arise in the project
implementation
Many people are reluctant to implement risk management due to
complication and intimidation and some believe that the purpose is to
allocate blame when some thing is wrong in the project
4.
Risk Management
Riskmanagement is key element of planning and
management of projects.
e.g. during planning phase you consider all potential risks and how
they will be addressed.
Thus, you need to identify potential risks and analyse them
and see which ones can be managed on an on-going basis.
It is important to have clear procedures for managing risks in
a project.
5.
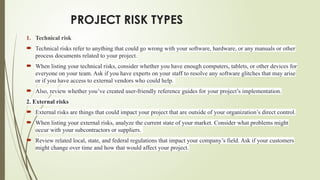
PROJECT RISK TYPES
1.Technical risk
Technical risks refer to anything that could go wrong with your software, hardware, or any manuals or other
process documents related to your project.
When listing your technical risks, consider whether you have enough computers, tablets, or other devices for
everyone on your team. Ask if you have experts on your staff to resolve any software glitches that may arise
or if you have access to external vendors who could help.
Also, review whether you’ve created user-friendly reference guides for your project’s implementation.
2. External risks
External risks are things that could impact your project that are outside of your organization’s direct control.
When listing your external risks, analyze the current state of your market. Consider what problems might
occur with your subcontractors or suppliers.
Review related local, state, and federal regulations that impact your company’s field. Ask if your customers
might change over time and how that would affect your project.
6.
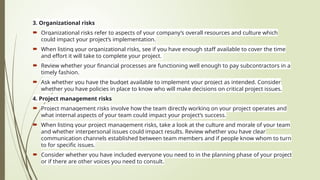
3. Organizational risks
Organizational risks refer to aspects of your company’s overall resources and culture which
could impact your project’s implementation.
When listing your organizational risks, see if you have enough staff available to cover the time
and effort it will take to complete your project.
Review whether your financial processes are functioning well enough to pay subcontractors in a
timely fashion.
Ask whether you have the budget available to implement your project as intended. Consider
whether you have policies in place to know who will make decisions on critical project issues.
4. Project management risks
Project management risks involve how the team directly working on your project operates and
what internal aspects of your team could impact your project’s success.
When listing your project management risks, take a look at the culture and morale of your team
and whether interpersonal issues could impact results. Review whether you have clear
communication channels established between team members and if people know whom to turn
to for specific issues.
Consider whether you have included everyone you need to in the planning phase of your project
or if there are other voices you need to consult.
8.
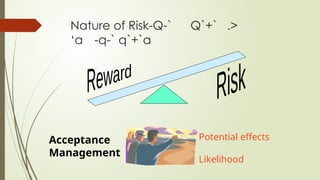
Nature of Risk-Q-`Q`+` .>
‘a -q-` q`+`a
Potential effects
Likelihood
Acceptance
Management
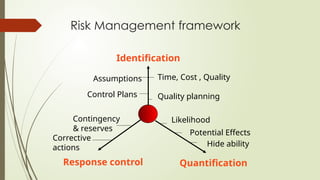
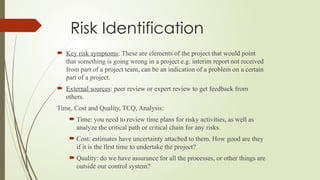
Risk Identification
Keyrisk symptoms: These are elements of the project that would point
that something is going wrong in a project e.g. interim report not received
from part of a project team, can be an indication of a problem on a certain
part of a project.
External sources: peer review or expert review to get feedback from
others.
Time, Cost and Quality, TCQ, Analysis:
Time: you need to review time plans for risky activities, as well as
analyze the critical path or critical chain for any risks.
Cost: estimates have uncertainty attached to them. How good are they
if it is the first time to undertake the project?
Quality: do we have assurance for all the processes, or other things are
outside our control system?
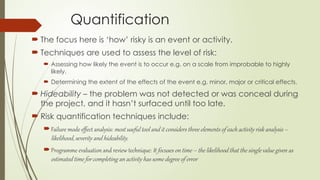
Quantification
The focushere is ‘how’ risky is an event or activity.
Techniques are used to assess the level of risk:
Assessing how likely the event is to occur e.g. on a scale from improbable to highly
likely.
Determining the extent of the effects of the event e.g. minor, major or critical effects.
Hideability – the problem was not detected or was conceal during
the project, and it hasn’t surfaced until too late.
Risk quantification techniques include:
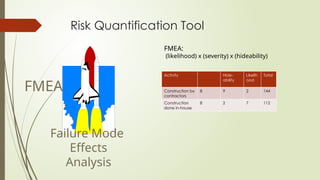
Failure mode effect analysis: most useful tool and it considers three elements of each activity risk analysis –
likelihood, severity and hideability.
Programme evaluation and review technique: It focuses on time – the likelihood that the single value given as
estimated time for completing an activity has some degree of error
13.
Risk Quantification Tool
FailureMode
Effects
Analysis
FMEA
FMEA:
(likelihood) x (severity) x (hideability)
Activity Hide-
ability
Likelih
ood
Total
Construction by
contractors
8 9 2 144
Construction
done in-house
8 2 7 112
14.
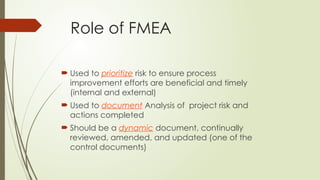
Role of FMEA
Used to prioritize risk to ensure process
improvement efforts are beneficial and timely
(internal and external)
Used to document Analysis of project risk and
actions completed
Should be a dynamic document, continually
reviewed, amended, and updated (one of the
control documents)
15.
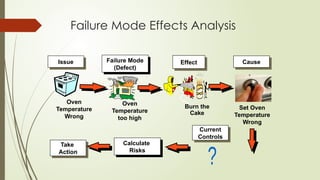
Failure Mode EffectsAnalysis
Effect
Issue Failure Mode
(Defect)
Burn the
Cake
Oven
Temperature
too high
Oven
Temperature
Wrong
Set Oven
Temperature
Wrong
Cause
Current
Controls
Calculate
Risks
Take
Action
16.
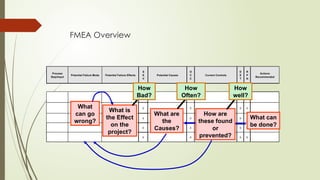
FMEA Overview
Process
Step/Input
Potential FailureMode Potential Failure Effects
S
E
V
Potential Causes
O
C
C
Current Controls
D
E
T
R
P
N
Actions
Recommended
0 0 0 0
0 0 0 0
0 0 0 0
0 0 0 0
0 0 0 0
What
can go
wrong?
What can
be done?
What is
the Effect
on the
project?
What are
the
Causes?
How are
these found
or
prevented?
How
Bad?
How
Often?
How
well?
17.
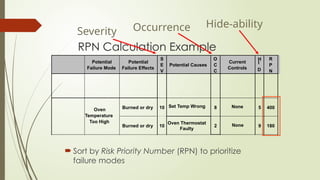
RPN Calculation Example
Sort by Risk Priority Number (RPN) to prioritize
failure modes
Potential
Failure Mode
Potential
Failure Effects
S
E
V
Potential Causes
O
C
C
Current
Controls
R
P
N
Oven
Temperature
Too High
Set Temp Wrong
Burned or dry 10 8 5 400
Burned or dry 10
Oven Thermostat
Faulty
2 None 9 180
Hide-ability
Severity Occurrence
H
I
D
None
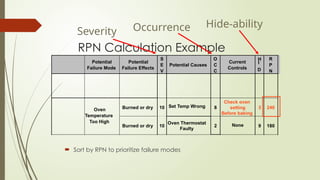
18.
RPN Calculation Example
Sort by RPN to prioritize failure modes
Potential
Failure Mode
Potential
Failure Effects
S
E
V
Potential Causes
O
C
C
Current
Controls
R
P
N
Oven
Temperature
Too High
Set Temp Wrong
Burned or dry 10 8 3 240
Burned or dry 10
Oven Thermostat
Faulty
2 None 9 180
Hide-ability
Severity Occurrence
H
I
D
Check oven
setting
Before baking
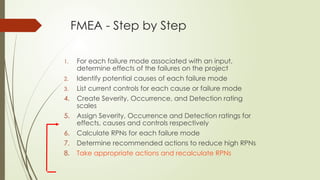
FMEA - Stepby Step
1. For each failure mode associated with an input,
determine effects of the failures on the project
2. Identify potential causes of each failure mode
3. List current controls for each cause or failure mode
4. Create Severity, Occurrence, and Detection rating
scales
5. Assign Severity, Occurrence and Detection ratings for
effects, causes and controls respectively
6. Calculate RPNs for each failure mode
7. Determine recommended actions to reduce high RPNs
8. Take appropriate actions and recalculate RPNs
21.
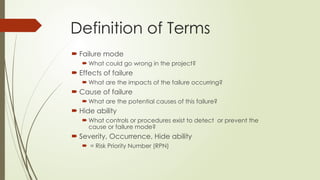
Definition of Terms
Failure mode
What could go wrong in the project?
Effects of failure
What are the impacts of the failure occurring?
Cause of failure
What are the potential causes of this failure?
Hide ability
What controls or procedures exist to detect or prevent the
cause or failure mode?
Severity, Occurrence, Hide ability
= Risk Priority Number (RPN)
22.
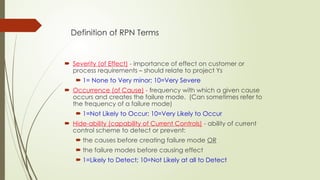
Definition of RPNTerms
Severity (of Effect) - importance of effect on customer or
process requirements – should relate to project Ys
1= None to Very minor; 10=Very Severe
Occurrence (of Cause) - frequency with which a given cause
occurs and creates the failure mode. (Can sometimes refer to
the frequency of a failure mode)
1=Not Likely to Occur; 10=Very Likely to Occur
Hide-ability (capability of Current Controls) - ability of current
control scheme to detect or prevent:
the causes before creating failure mode OR
the failure modes before causing effect
1=Likely to Detect; 10=Not Likely at all to Detect
23.
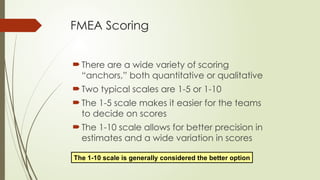
FMEA Scoring
Thereare a wide variety of scoring
“anchors,” both quantitative or qualitative
Two typical scales are 1-5 or 1-10
The 1-5 scale makes it easier for the teams
to decide on scores
The 1-10 scale allows for better precision in
estimates and a wide variation in scores
The 1-10 scale is generally considered the better option
24.
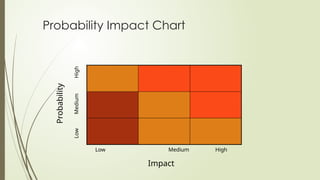
Prioritizing Risks
Combiningthe rate assigned to likelihood and impact give a
crude measure of priority
e.g. A risk in which likelihood is combined with high impact would
obviously merit priority . A high likelihood Risk and low impact risk
is more difficult to prioritize
25.
Responding to Risks
Aresponse is any action implemented to
deal with a risk or combination of risks
These are ways
Avoid the risks
Reduce the risks of the projects
Transfer the risks
Accept the risks- e.g pay for all losses
Contingency should be allowed
26.
Selecting Responses
Choosinga suitable response needs appraisal of the effects
that implementing the response will have on original risks
Cost benefits analysis should be a tool to use in such
endeavors . The procedures should be as follows :
Create a baseline
Consider each possible response
Estimate costs of implementing the response
Reassess the impact of the risks
27.
Risk management strategy
Risk management strategy is integral part of project management and risk
assessment. This enable project managers to have better decisions
pertaining to the project.
Risk management should be treated as an investment
28.
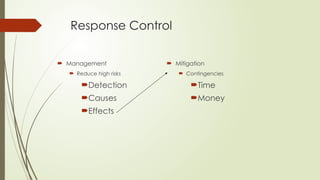
RISK RESPONSE DEVELOPMENT
1.Mitigation
Addressesrisk before manifestation and attempts to
reduce its impact before occurring.
2. Contingency
Addresses the risk at the time the event occurs and
attempts to reduce its negative effects.
29.
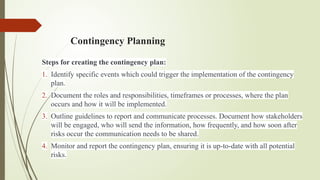
Contingency Planning
Steps forcreating the contingency plan:
1. Identify specific events which could trigger the implementation of the contingency
plan.
2. Document the roles and responsibilities, timeframes or processes, where the plan
occurs and how it will be implemented.
3. Outline guidelines to report and communicate processes. Document how stakeholders
will be engaged, who will send the information, how frequently, and how soon after
risks occur the communication needs to be shared.
4. Monitor and report the contingency plan, ensuring it is up-to-date with all potential
risks.
30.
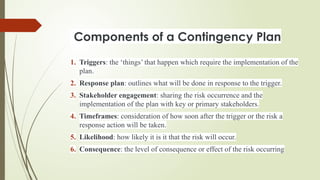
Components of aContingency Plan
1. Triggers: the ‘things’ that happen which require the implementation of the
plan.
2. Response plan: outlines what will be done in response to the trigger.
3. Stakeholder engagement: sharing the risk occurrence and the
implementation of the plan with key or primary stakeholders.
4. Timeframes: consideration of how soon after the trigger or the risk a
response action will be taken.
5. Likelihood: how likely it is it that the risk will occur.
6. Consequence: the level of consequence or effect of the risk occurring
#15 Prevention takes place before the cause occurs, and is the best way to control a process with consistency. Perhaps a programmable oven would be a prevention method. Detection before the failure occurs could be patrolling the kitchen shortly after the cake is put in to see that the temperature and timer are set correctly and adjusted if no correct. Detection after the failure occurs but before the cake goes on the table allows us not to feed the guests burned cake. Detection by a guest that the cake is burned is of course the very worst condition. Advice: trim the burned parts off the cake and feed it to your kids tomorrow. They’ll eat anything. These latter examples of detection once again are attempts to inspect quality into a process.
#16 This slide provides the flow of the FMEA. NOTE: CAUSES CAUSE FAILURE MODES, NOT EFFECTS. FAILURE MODES CAUSE EFFECTS. Controls (detection or prevention) can be for either Causes or Failure modes. You might suggest that Belts book mark this page because the tendency of the team might be to look at causes producing effects.
#17 Sort the entire sheet on the RPN column and decide how many RPNs you are going to carry forward
#18 Sort the entire sheet on the RPN column and decide how many RPNs you are going to carry forward
#20 Mention that scoring scale can be created anytime before step 5. Run quickly through the steps explaining that you will be covering them in detail in the following slides.
#21 Move quickly through this. The definitions are expanded upon with examples following.
#22 Go over each definition and the scoring ranges. Make special note that the detection score is reversed scored because we want all tens to be bad in the calculation of the RPN and all 1’s to be good.
#23 We are using a 1-10 scale at 3M which is the chosen convention here, and generally in Six Sigma.