Toxicokinetics are important for interpreting biological monitoring results. Three key points:
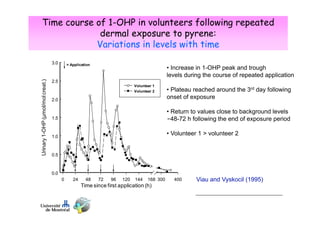
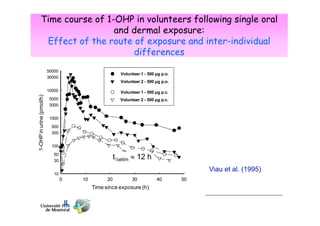
1) Biomarker concentrations vary over time following exposure and differ based on exposure route and individual factors.
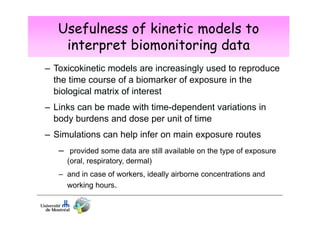
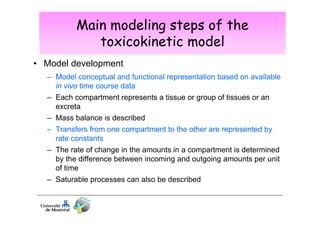
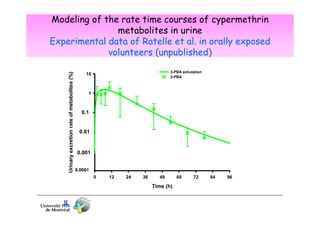
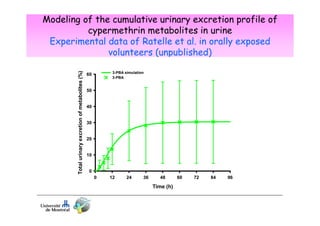
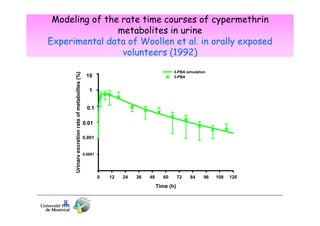
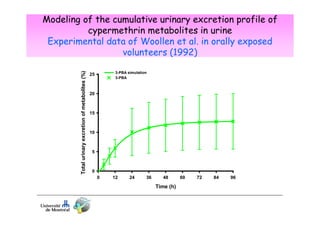
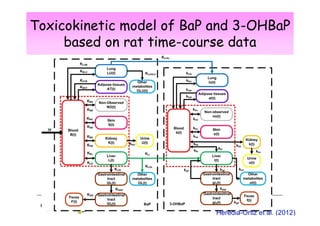
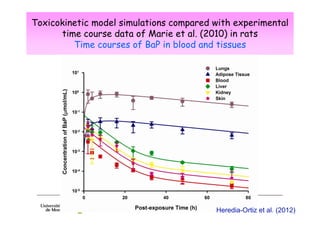
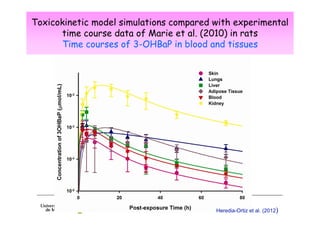
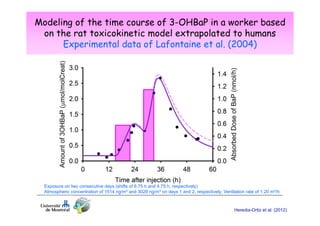
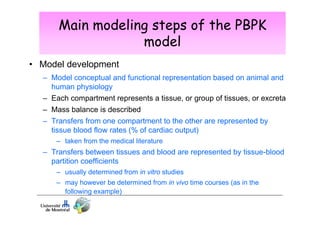
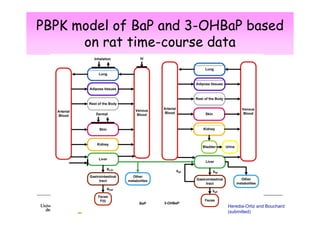
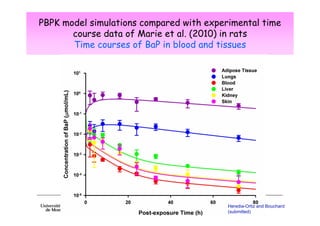
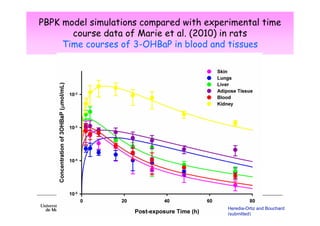
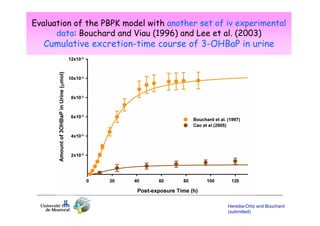
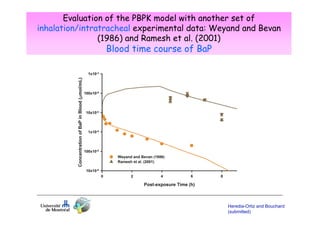
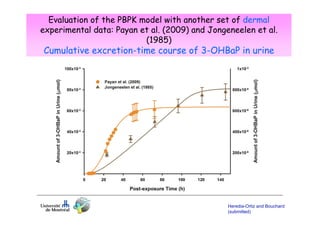
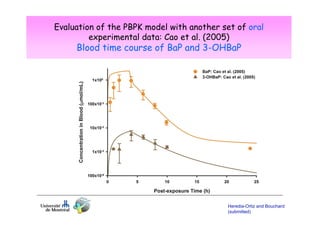
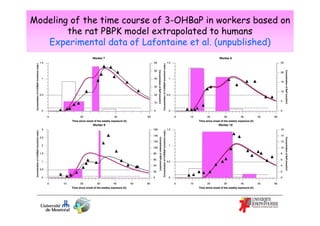
2) Toxicokinetic models can reproduce biomarker time courses in biological matrices and link these to exposure doses over time.
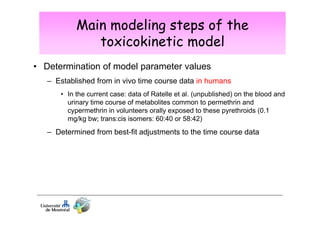
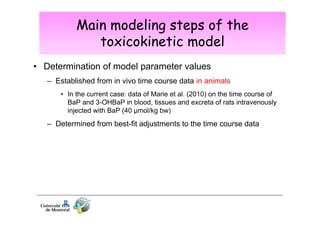
3) Models are developed using time course data from humans or animals. Parameter values are estimated by fitting models to data. Models can then simulate human exposures to help interpret biomonitoring results.