Downloaded 175 times
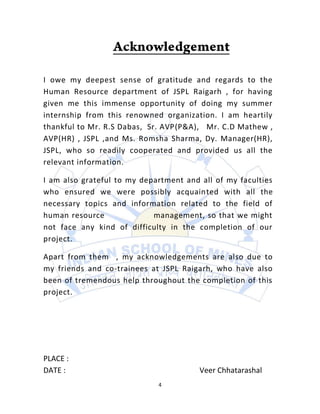
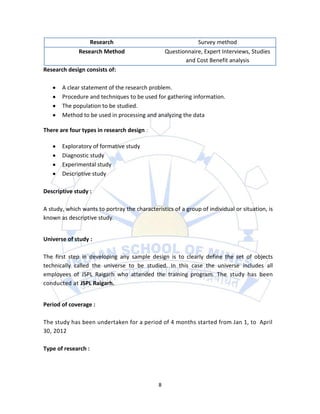
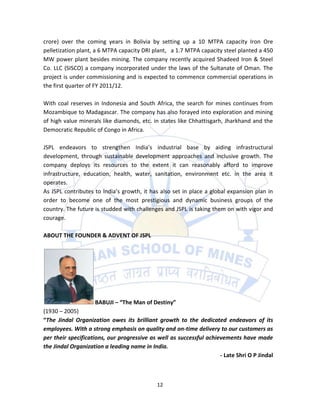
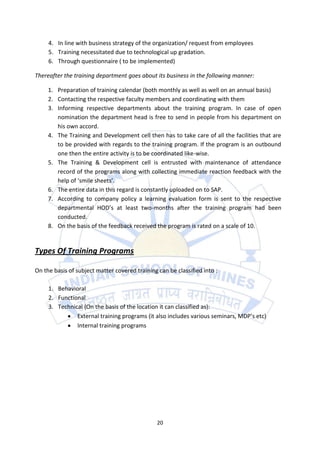
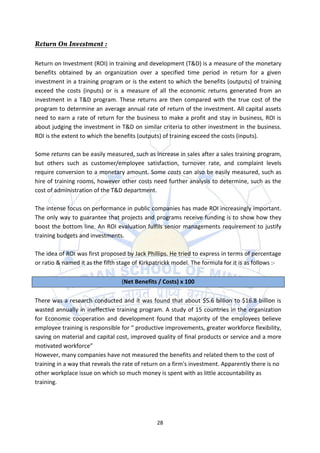
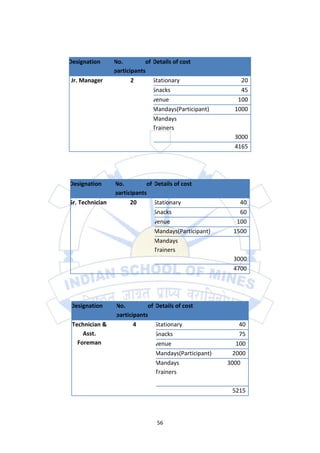
![Designation No. of Details of cost
participants
Asst. 4 Stationary 40
Foreman Snacks 75
venue 100
Mandays(Participant) 2000
Mandays 3000
Trainers
total 5215
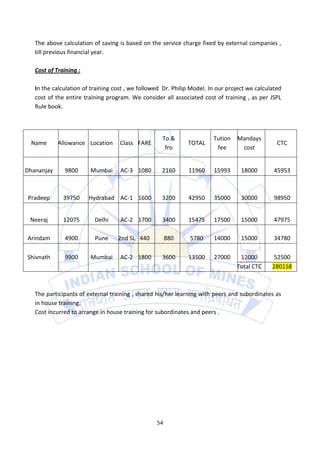
Total Inhouse training cost = Rs. 56950
Total Cost cost =280158+56950 =Rs. 337108
ROI (Return on investment) of training:-
ROI=[ (SAVING-COST)/COST]*100
Total savings = Rs. 10857500
Taking 5% level of significance in saving = Rs. 10314625
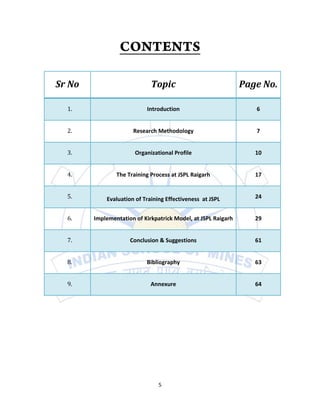
EPS(Electrical Power System) Department
The EPS(Electrical Power System) department is one of the major contributors to the
production . The department is responsible to provide electrical power to all possible units.
The selected 35 employees of the department have undergone training with ABB Ltd. at
Vadodra and Bangalore in four different batches. The training modules were fully equipped
with new ,efficient and safety measured techniques.
57](https://image.slidesharecdn.com/revised-130218105005-phpapp01/85/JSPL-RAIGARHS-HR-PROJECT-57-320.jpg)
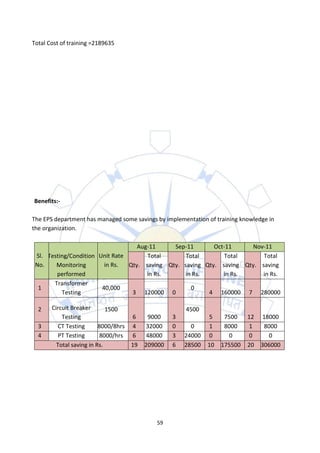
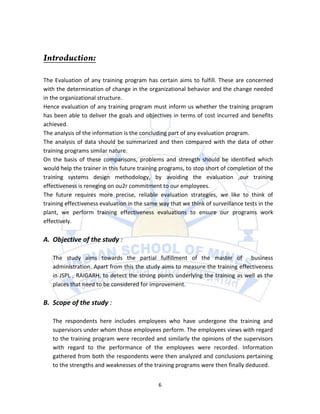
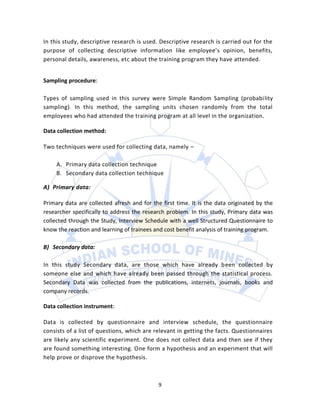
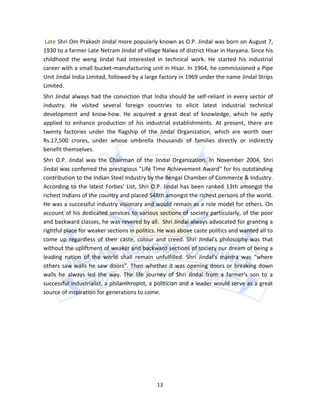
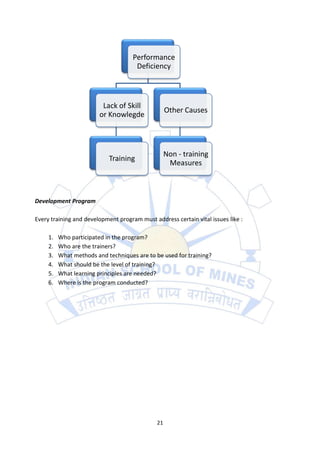
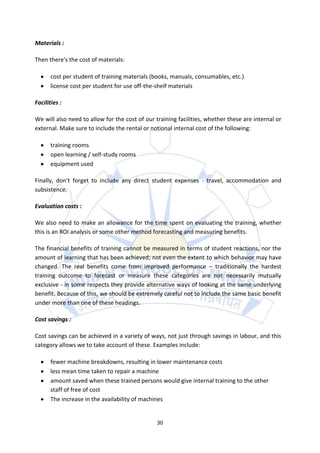
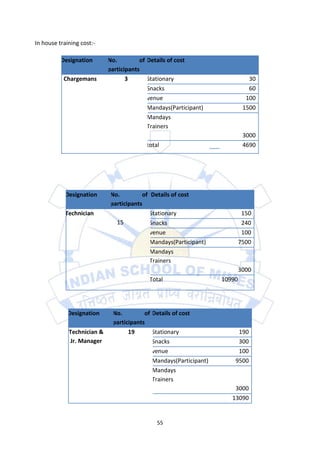
![Dec-11 Jan-12 Feb-12 Mar-12
Total Total Total Total
Qty. saving in Qty. saving in Qty. saving in Qty. saving in
Rs. Rs. Rs. Rs.
9 360000 14 560000 10 400000 17 680000
2 3000 2 3000 45 67500 23 34500
2 16000 0 7 56000 3 24000
4 32000 0 0 0
17 411000 16 563000 62 523500 43 738500 2955000
ROI= [ (Profit- Cost)/cost]*100
= [(2955000-2189635)/ 2189635]*100
= [646557/2189635]*100 = 35%
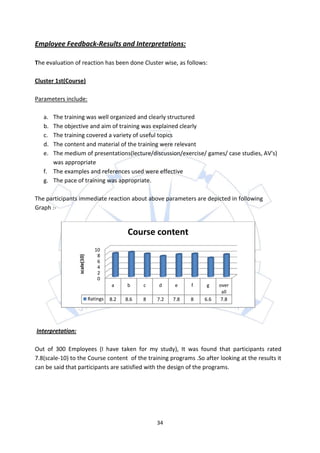
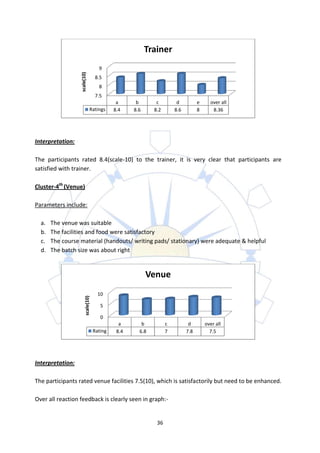
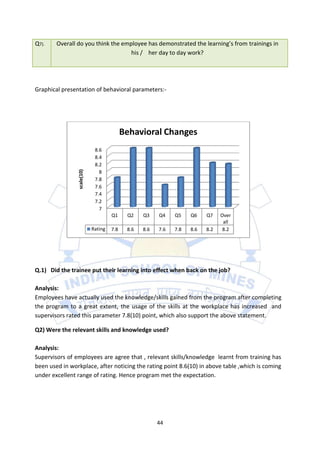
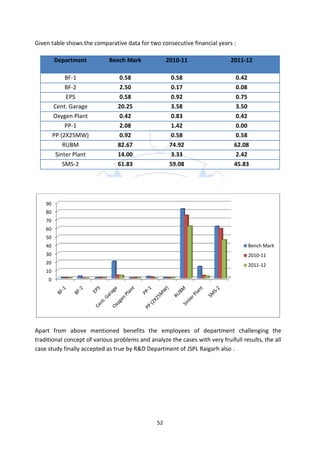
On the overall analysis of the data of all levels, we can conclude that the immediate reaction
rated 8.1 point(scale-10), means the participants were satisfied with all four mentioned i.e
Course, Relevance , Trainer, and Venue.
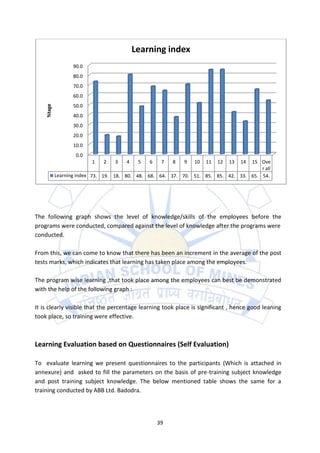
However the learning was also good in all three parameters i.e Learning index (54.38%) , Self
evaluation (Effective), Knowledge sharing (Effective) .
Evaluators of change in behavior rated 8.1(10) ,which justified the program expectation. The
reasons that imparted improvement to the performance are increased number of coaching
and feedbacks, better supervision on job by the supervisors, increase in the actual usage of
knowledge/skills gained through the program, and the availability of necessary equipments
and materials for performing on the job.
In the last level of “Kirkpatrick Model” , we saw new initiative by the employees like case
study, New attempt and high ROI(Return on investment)
60](https://image.slidesharecdn.com/revised-130218105005-phpapp01/85/JSPL-RAIGARHS-HR-PROJECT-60-320.jpg)

The document provides an overview of Jindal Steel and Power Limited (JSPL), describing its founding by O.P. Jindal in 1969, current leadership under Naveen Jindal, and operations which include steel, power, mining, infrastructure and other industries. It discusses JSPL's expansion internationally and plans to invest over $30 billion globally. The company aims to become a leading Indian business group through sustainable growth and contributing to national development.