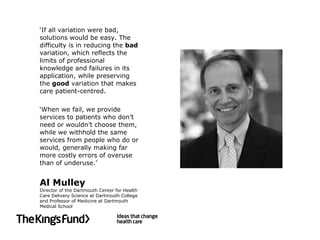
Variations in health care: The good, the bad and the inexplicable Maximising the good and minimising the bad in health care John Appleby Chief Economist, The King’s Fund April 2011
Figure 1: Mapping the  causes of variation
Figure 3: Distribution of crude rates and age–gender standardised rates for primary hip replacement (English PCTs, 2009/10)
Figure 6: Age–gender standardised ratios for selected elective procedures (2009/10), England=100
Figure 9: Variation over time: SCVs for hip replacement, cataract removal and tonsillectomy 2005/06, 2009/10
Figure 11: Audit Commission basket of 25-day  case procedures, 2009/10 Per cent carried out as day cases by PCT,  ordered on size of  coefficient of variation  low = black medium = grey  high = white
Figure 12: Measures of  variation: selected low  effectiveness procedures,  2009/10
‘ If all variation were bad, solutions would be easy. The difficulty is in reducing the  bad  variation, which reflects the limits of professional knowledge and failures in its application, while preserving the  good  variation that makes care patient-centred.  ‘ When we fail, we provide services to patients who don’t need or wouldn’t choose them, while we withhold the same services from people who do or would, generally making far more costly errors of overuse than of underuse.’ Al Mulley Director of the Dartmouth Center for Health Care Delivery Science at Dartmouth College and Professor of Medicine at Dartmouth Medical School
Download the full report: www.kingsfund.org.uk/variation

John Appleby: Variations in health care

  • 1.
    Variations in healthcare: The good, the bad and the inexplicable Maximising the good and minimising the bad in health care John Appleby Chief Economist, The King’s Fund April 2011
  • 2.
    Figure 1: Mappingthe causes of variation
  • 3.
    Figure 3: Distributionof crude rates and age–gender standardised rates for primary hip replacement (English PCTs, 2009/10)
  • 4.
    Figure 6: Age–genderstandardised ratios for selected elective procedures (2009/10), England=100
  • 5.
    Figure 9: Variationover time: SCVs for hip replacement, cataract removal and tonsillectomy 2005/06, 2009/10
  • 6.
    Figure 11: AuditCommission basket of 25-day case procedures, 2009/10 Per cent carried out as day cases by PCT, ordered on size of coefficient of variation low = black medium = grey high = white
  • 7.
    Figure 12: Measuresof variation: selected low effectiveness procedures, 2009/10
  • 8.
    ‘ If allvariation were bad, solutions would be easy. The difficulty is in reducing the bad variation, which reflects the limits of professional knowledge and failures in its application, while preserving the good variation that makes care patient-centred. ‘ When we fail, we provide services to patients who don’t need or wouldn’t choose them, while we withhold the same services from people who do or would, generally making far more costly errors of overuse than of underuse.’ Al Mulley Director of the Dartmouth Center for Health Care Delivery Science at Dartmouth College and Professor of Medicine at Dartmouth Medical School
  • 9.
    Download the fullreport: www.kingsfund.org.uk/variation