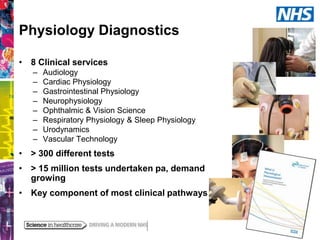
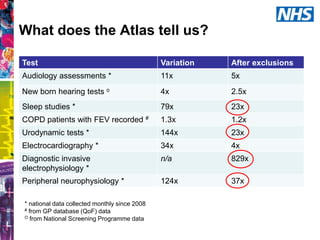
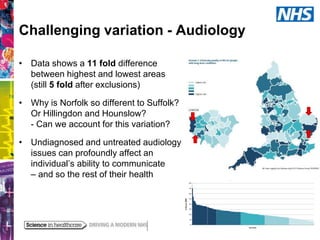
Physiology Diagnostics & the Atlas of Variation
Professor Sue Hill OBE
Chief Scientific Officer for England
Physiology Diagnostics
• 8 Clinical services
–
–
–
–
–
–
–
–

Audiology
Cardiac Physiology
Gastrointestinal Physiology
Neurophysiology
Ophthalmic & Vision Science
Respiratory Physiology & Sleep Physiology
Urodynamics
Vascular Technology

• > 300 different tests
• > 15 million tests undertaken pa, demand
growing

• Key component of most clinical pathways
What does the Atlas tell us?
Test

Variation

After exclusions

Audiology assessments *

11x

5x

New born hearing tests o

4x

2.5x

Sleep studies *

79x

23x

COPD patients with FEV recorded #

1.3x

1.2x

Urodynamic tests *

144x

23x

Electrocardiography *

34x

4x

Diagnostic invasive
electrophysiology *

n/a

829x

Peripheral neurophysiology *

124x

37x

* national data collected monthly since 2008
# from GP database (QoF) data
O from National Screening Programme data
Challenging variation - Audiology
• Data shows a 11 fold difference
between highest and lowest areas
(still 5 fold after exclusions)
• Why is Norfolk so different to Suffolk?
Or Hillingdon and Hounslow?
- Can we account for this variation?
• Undiagnosed and untreated audiology
issues can profoundly affect an
individual’s ability to communicate
– and so the rest of their health
Interventions
to reduce unwarranted variation
• Providing a ‘feedback loop’ challenge to the commissioning
system – empowering clinicians in services and informing
contract management
• For patients: ensuring a fresh focus on the identification of
undiagnosed, and untreated conditions and the prevention of
disease progression

• Improving adoption of new technology & service redesign
• Quality assurance and peer review systems (such as IQIPS –
Improving Quality In Physiological Sciences)
• Tackling workforce shortages
Equipment
Management
&
Calibration
Performance
to SOPs &
guidelines

Knowledge
management

Diagnostic
services
MDT delivery

Advice and
expertise

Technical &
Clinical
interpretation

Quality
Systems &
Assurance

Diagnostic
services in
NHS –
getting it
right
Getting it right –
Mike Richards’s Vision
…we need to harness robust and timely
information from other sources to provide a more
rounded picture of a trust….
Accreditation and peer review already play an
important role in quality improvement …. I strongly
believe that such schemes have a key role to play in
the future of hospital inspection.
We need to use information from these schemes to
feed directly into CQC monitoring processes and
the development of trust-specific key lines of enquiry
for use at inspections.‘

Professor Sir
Mike Richards,
Chief Inspector
of Hospitals
Taking the Atlas forward in future
• The Atlas of Variation represents a subset of
diagnostic procedures – those that are monitored and
recorded nationally
• Some important diagnostics do not have sufficient data
to build a variation picture
– eg rate of EEG testing for epilepsy
• Need to focus on impact on patient experience and
outcomes when selecting additional indicators
Any questions?

Professor Sue Hill OBE, Chief Scientific Officer for England

  • 1.
    Physiology Diagnostics &the Atlas of Variation Professor Sue Hill OBE Chief Scientific Officer for England
  • 2.
    Physiology Diagnostics • 8Clinical services – – – – – – – – Audiology Cardiac Physiology Gastrointestinal Physiology Neurophysiology Ophthalmic & Vision Science Respiratory Physiology & Sleep Physiology Urodynamics Vascular Technology • > 300 different tests • > 15 million tests undertaken pa, demand growing • Key component of most clinical pathways
  • 3.
    What does theAtlas tell us? Test Variation After exclusions Audiology assessments * 11x 5x New born hearing tests o 4x 2.5x Sleep studies * 79x 23x COPD patients with FEV recorded # 1.3x 1.2x Urodynamic tests * 144x 23x Electrocardiography * 34x 4x Diagnostic invasive electrophysiology * n/a 829x Peripheral neurophysiology * 124x 37x * national data collected monthly since 2008 # from GP database (QoF) data O from National Screening Programme data
  • 4.
    Challenging variation -Audiology • Data shows a 11 fold difference between highest and lowest areas (still 5 fold after exclusions) • Why is Norfolk so different to Suffolk? Or Hillingdon and Hounslow? - Can we account for this variation? • Undiagnosed and untreated audiology issues can profoundly affect an individual’s ability to communicate – and so the rest of their health
  • 5.
    Interventions to reduce unwarrantedvariation • Providing a ‘feedback loop’ challenge to the commissioning system – empowering clinicians in services and informing contract management • For patients: ensuring a fresh focus on the identification of undiagnosed, and untreated conditions and the prevention of disease progression • Improving adoption of new technology & service redesign • Quality assurance and peer review systems (such as IQIPS – Improving Quality In Physiological Sciences) • Tackling workforce shortages
  • 6.
    Equipment Management & Calibration Performance to SOPs & guidelines Knowledge management Diagnostic services MDTdelivery Advice and expertise Technical & Clinical interpretation Quality Systems & Assurance Diagnostic services in NHS – getting it right
  • 7.
    Getting it right– Mike Richards’s Vision …we need to harness robust and timely information from other sources to provide a more rounded picture of a trust…. Accreditation and peer review already play an important role in quality improvement …. I strongly believe that such schemes have a key role to play in the future of hospital inspection. We need to use information from these schemes to feed directly into CQC monitoring processes and the development of trust-specific key lines of enquiry for use at inspections.‘ Professor Sir Mike Richards, Chief Inspector of Hospitals
  • 8.
    Taking the Atlasforward in future • The Atlas of Variation represents a subset of diagnostic procedures – those that are monitored and recorded nationally • Some important diagnostics do not have sufficient data to build a variation picture – eg rate of EEG testing for epilepsy • Need to focus on impact on patient experience and outcomes when selecting additional indicators
  • 9.