Downloaded 78 times


![JITENDRA SINGH BHADORIYA-SCHOOL OF INSTRUMENTATION,DEVI AHILYA UNIVERSITY
INDORE(M.P.) INDIA
23
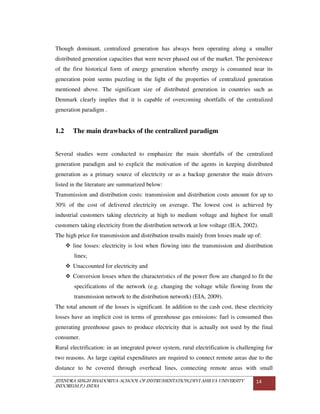
optimum distribution planning. One of these scenarios was to place multiple DG units at
certain locations pre-determined by the Electric Utility Distribution Companies (DISCOs)
aiming to improve their profiles and minimize the investment risk.
An adaptive-weight PSO (APSO) algorithm was used to place multiple DG units, but the
objective was to minimize only the real power loss of the system. PSO used to find the
optimal location of a fixed number of DG units with specific total capacity such that the
real power loss of the system is minimized and the operational constraints of the system are
satisfied. In [24], three types of multi- DG unit were optimally placed, also to minimize the
real power loss of the system using PSO.
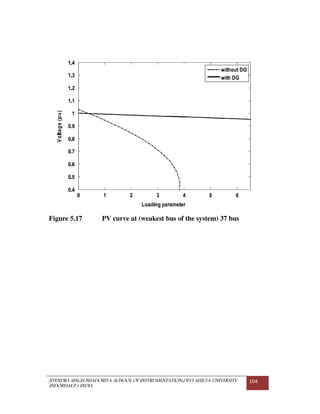
The proposed algorithm was applied to test systems, a radial 38-bus system. The algorithm
is built using MATLAB script functions. A continuation power flow is carried out to
determine the effect of DG units on the voltage stability limits using the Power System
Analysis Toolbox (PSAT).
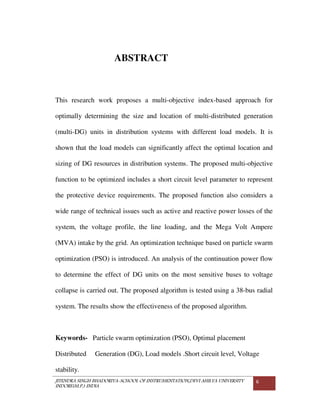
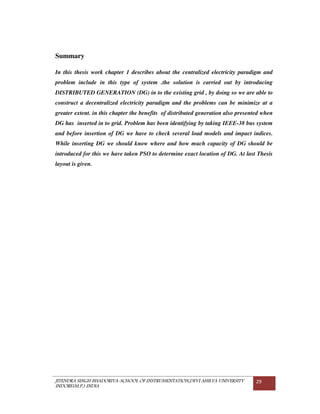
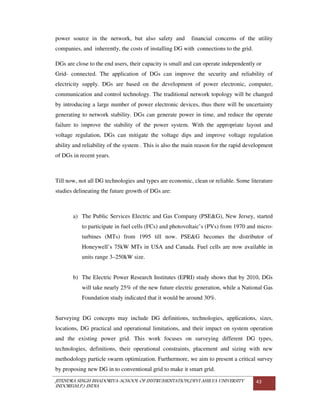
1.5 Multi-objective-based problem formulation
The multi-objective index for the performance calculation of distribution systems for DG
size and location planning with load models have considered by mentioning following
indices by giving a weight to each index.
In this thesis, several indices will be computed in order to describe the effect of load
models due to the presence of DG. These indices are defined as follows.
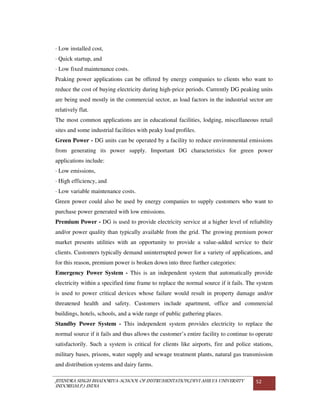
(1) Real and reactive power loss indices (ILP and ILQ): The real and reactive power loss
indices are defined as.
ILP = (1)
ILQ = (2)
Where PLDG and QLDG are the real and reactive power losses of the distribution system
after the inclusion of DG. PL and QL are the real and reactive system losses without DG in
the distribution system.
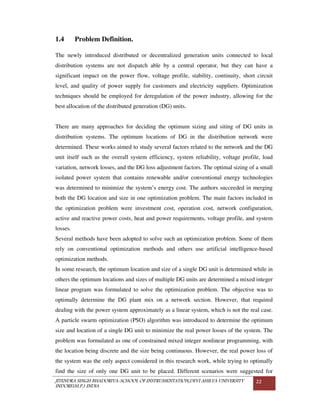
(2) Voltage profile index (IVD): One of the advantages of proper location and size of the
DG is the improvement in voltage profile. This index penalizes a size–location pair which](https://image.slidesharecdn.com/jitendiys-130705172418-phpapp01/85/Jitendiys-24-320.jpg)
![JITENDRA SINGH BHADORIYA-SCHOOL OF INSTRUMENTATION,DEVI AHILYA UNIVERSITY
INDORE(M.P.) INDIA
25
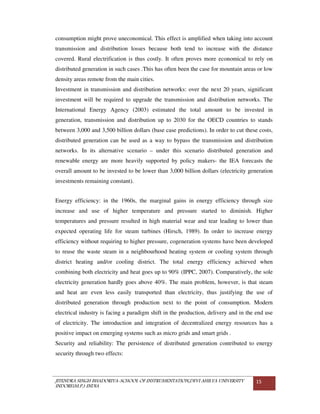
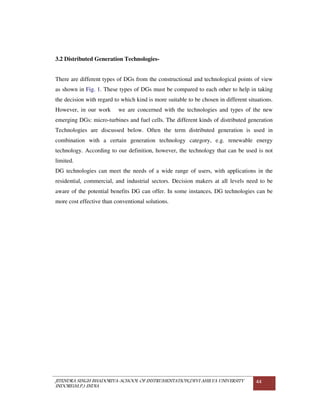
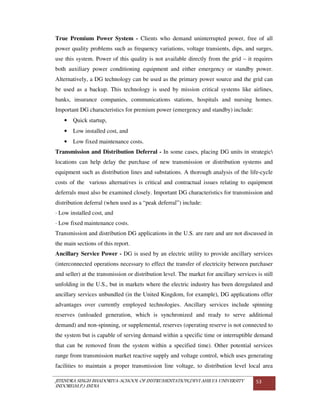
Where I without DG SC is the short circuit current before installing the DG and I with DG
SC is the short circuit current after installing the DG.
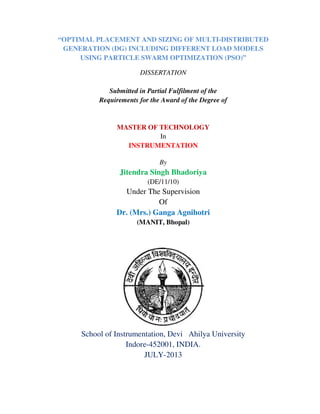
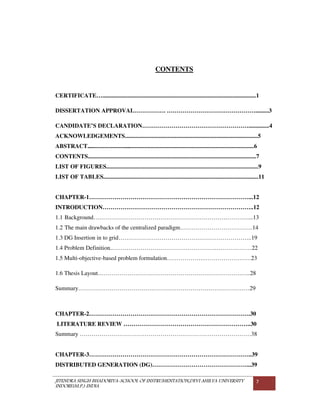
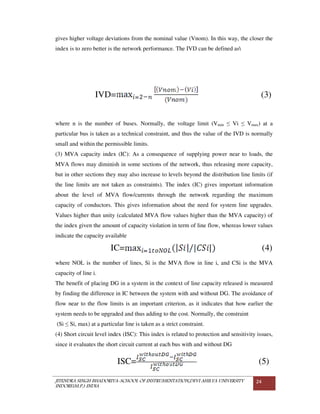
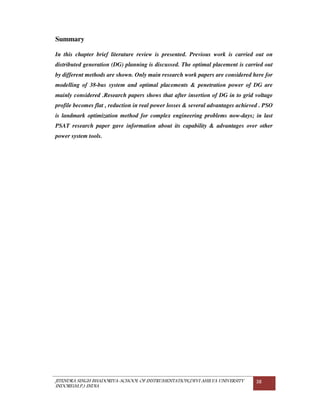
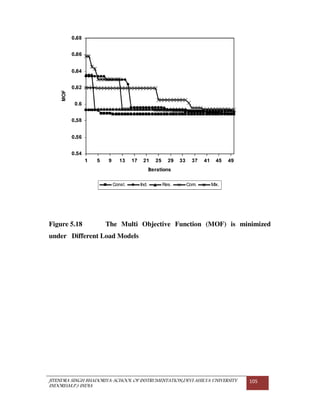
The PSO-based multi-objective function (MOF) is given by
MOF=(σ1.ILP+ σ2.ILQ+ σ3.IC+ σ4.IVD+ σ5.ISC)+MVAsys(pu) (6)
Where MVA sys(pu) is the total intake from the grid expressed per unit, and
=1.0 σp Є [0,1]. (7)
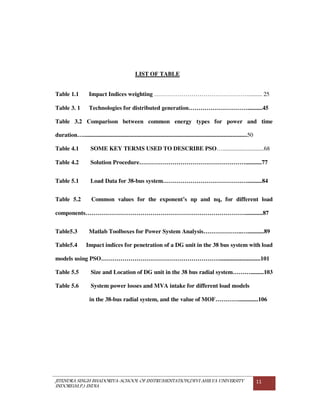
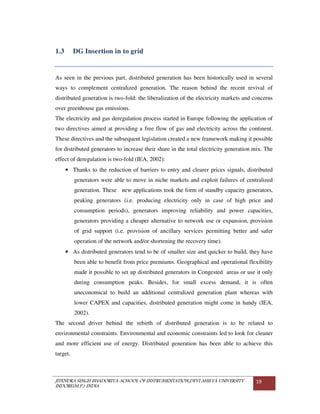
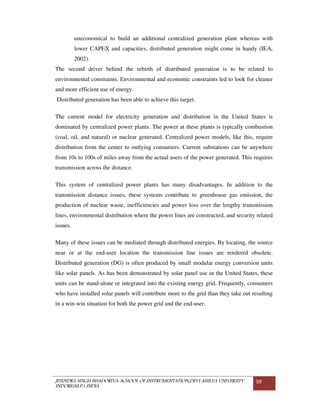
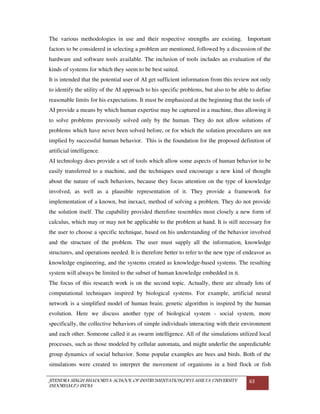
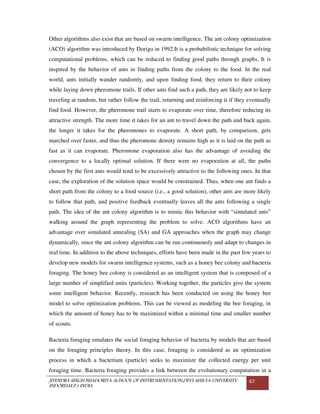
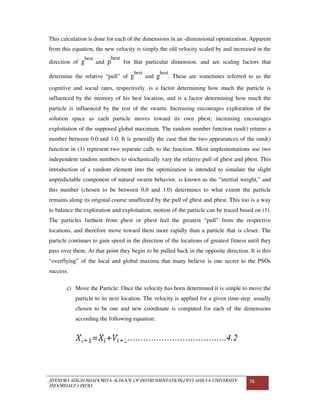
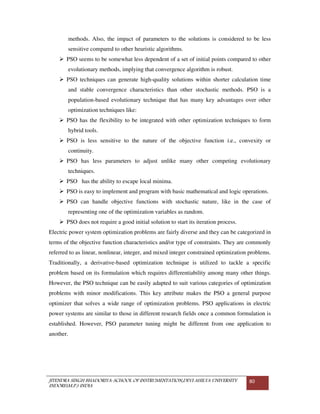
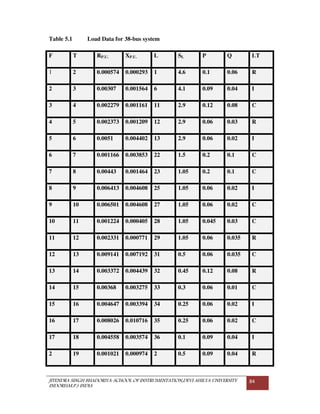
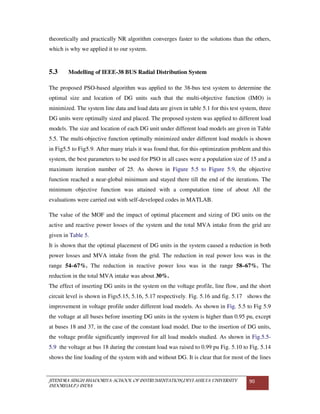
Table 1.1 Impact Indices weighting
Index weights.
ILP
Indices σp
0.3
ILQ 0.2
IC 0.25
IVD 0.1
ISC 0.15
These weights are indicated to give the corresponding importance to each impact index for
the penetration of DG with load models, and they depend on the required analysis (e.g.,
planning, operation, etc.). The weighted normalized indices used as the components of the
objective function are due to the fact that the indices get their weights by translating their
impacts in terms of cost. It is desirable if the total cost is decreased. Table 2 shows the
values for the weights used in present work, considering normal operation analysis, and
they are selected guided by the weights. However, these values may vary according to
engineer concerns.
For this analysis, active losses have the higher weight (0.3) since they are important in
many applications of DG. The current capacity index (IC) has the second highest weight](https://image.slidesharecdn.com/jitendiys-130705172418-phpapp01/85/Jitendiys-26-320.jpg)


![JITENDRA SINGH BHADORIYA-SCHOOL OF INSTRUMENTATION,DEVI AHILYA UNIVERSITY
INDORE(M.P.) INDIA
31
[1]` This paper proposes a multi-objective index-based approach for optimally
determining the size and location of multi-distributed generation (multi-DG) units in
distribution systems with different load models. It is shown that the load models can
significantly affect the optimal location and sizing of DG resources in distribution systems.
The proposed multi-objective function to be optimized includes a short circuit level
parameter to represent the protective device requirements. The proposed function also
considers a wide range of technical issues such as active and reactive power losses of the
system, the voltage profile, the line loading, and the Mega Volt Ampere (MVA) intake by
the grid. An optimization
Technique based on particle swarm optimization (PSO) is introduced. An analysis of the
continuation power flow to determine the effect of DG units on the most sensitive buses to
voltage collapse is carried out. The proposed algorithm is tested using a 38-bus radial
system and an IEEE 30-bus meshed system.
Multi-objective optimization analysis, including load models, for size–location
planning of distributed generation in distribution systems has been presented. The proposed
optimization algorithm was applied to a 38-bus radial test system and an IEEE 30-bus mesh
test system. The results showed that the proposed algorithm is capable of optimal and fast
placement of DG units. The results clarified the efficiency of this algorithm for
improvement of the voltage profile, reduction of power losses, and reduction of MVA
flows and MVA intake from the grid, and also for increasing the voltage stability margin
and maximum loading.
[2] Distributed generators (DGs) sometimes provide the lowest cost solution to
handling low-voltage or overload problems. In conjunction with handling such problems, a
DG can be placed for optimum efficiency or optimum reliability. Such optimum
placements of DGs are investigated. The concept of segments, which has been applied in
previous reliability studies, is used in the DG placement. The optimum locations are sought
for time-varying
load patterns. It is shown that the circuit reliability is a function of the loading level. The
difference of DG placement between optimum efficiency and optimum reliability varies
under different load conditions. Observations and recommendations concerning DG
placement for optimum reliability and efficiency are provided in this paper. Economic
considerations are also addressed.](https://image.slidesharecdn.com/jitendiys-130705172418-phpapp01/85/Jitendiys-32-320.jpg)
![JITENDRA SINGH BHADORIYA-SCHOOL OF INSTRUMENTATION,DEVI AHILYA UNIVERSITY
INDORE(M.P.) INDIA
32
This paper discusses two criteria for the optimal placement of a DG for time-
varying loads. One is to maximize the reliability improvement, and the other is to minimize
the power loss in the system. A three-circuit example is used for quantitative analysis. It is
pointed out that both reliability and losses vary as a function of loading or time. There are
additional practical constraints that must be considered, such as what locations are
available to the utility for installing the DG. Also, modifying the protection system either
due to the additional fault currents supplied by the DG or due to switching operations
anticipated are other practical aspects that need to be considered.
[4] The distributed generation (DG) plant mix connected to any network section has a
considerable impact on the total amount of DG energy exported and on the amount of
losses incurred on the network. A new method for the calculation of loss adjustment factors
(LAFs) for DG is presented, which determines the LAFs on a site specific and energy
resource specific basis. A mixed integer linear program is formulated to optimally utilize
the available energy resource on a distribution network section. The objective function
incorporates the novel LAFs along with individual generation load factors, facilitating the
determination of the optimal DG plant mix on a network section. Results are presented for
a sample section of network illustrating the implementation of the optimal DG plant mix
methodology for two representative energy resource portfolios.
A novel method for the calculation of loss adjustment factors for distributed
generation has been presented. These LAFs take account of the average impact of different
generation technologies at each bus on losses. The LAFs provide a pricing signal for the
optimal DG plant mix, whereby generators’ revenue will increase if they connect at the
appropriate bus. These novel LAFs have been incorporated into an optimal plant mix
methodology using MILP. This methodology determines the optimal DG plant mix for a
section of distribution network subject to a number of constraints. The methodology is
tested on two representative energy portfolios, in both cases performing well. Both cases
demonstrate that there is significant scope for optimization of the DG plant mix, to
maximize both the revenue for the generators and the benefit to society.
[6] This paper presents a novel particle swarm optimization based approach to optimally
incorporate a distribution generator into a distribution system. The proposed algorithm
combines particle swarm optimization with load flow algorithm to solve the problem in a](https://image.slidesharecdn.com/jitendiys-130705172418-phpapp01/85/Jitendiys-33-320.jpg)
![JITENDRA SINGH BHADORIYA-SCHOOL OF INSTRUMENTATION,DEVI AHILYA UNIVERSITY
INDORE(M.P.) INDIA
33
single step, i.e. finding the best combination of location and size simultaneously. In the
developed algorithm, the objective function to be minimized is the total network power
losses while satisfying the voltage constraints imposed on the system. It is formulated as
constrained mixed integer nonlinear programming problem with the location being discrete.
The 69−bus radial distribution system has been used to validate the proposed method. Test
results demonstrate the effectiveness and robustness of the developed algorithm.
This paper presents solving the optimal DG allocation and sizing problem through
applying novel hybrid particle swarm optimization based approach algorithm. By
combining the particle swarm optimization with the load flow algorithm the problem was
solved in a single step that is finding the best combination of location and sizing
simultaneously. The effectiveness of the PSO was demonstrated and tested. The proposed
algorithm was tested on 69−bus distribution system to solve the DG mixed integer
nonlinear problem with both equality and inequality constraints imposed on the system.
The hybrid PSO significantly minimized the distribution network real power losses and
converged to the same bus for the DG to be installed in every single run.
[11] Recent changes in the energy industry initiated by deregulation have accelerated the
introduction of distributed generation at the sub-transmission and distribution levels. In
light of the well-known benefits as well as the various issues involved in DG incorporation,
this paper proposes two new quadratic voltage profile improvement indices VPI1 and
VPI2The primal dual interior-point (PDIP) method has been employed to identify the
optimal location and real and reactive power generation on the basis of the newly proposed
indices. A simplified model of a 33-bus radial distribution system has been simulated in
MATLAB to illustrate the use of the new indices.
Employing DG in a distribution system results in several benefits such as
increased overall system efficiency, reduced line losses, improved system voltage profile
and transmission and distribution capacity relief to both utilities and the customers. This
paper has proposed two indices: VPI1 VPI2, to quantify voltage profile improvement in a
distribution system. Primal-dual interior-point method has been employed to determine the
optimal location for the DG units in a distribution system.
[17] Evaluating the technical impacts associated with connecting distributed generation
to distribution networks is a complex activity requiring a wide range of network operational](https://image.slidesharecdn.com/jitendiys-130705172418-phpapp01/85/Jitendiys-34-320.jpg)
![JITENDRA SINGH BHADORIYA-SCHOOL OF INSTRUMENTATION,DEVI AHILYA UNIVERSITY
INDORE(M.P.) INDIA
34
and security effects to be quailed and quantized. One means of dealing with such
complexity is through the use of indices that indicate the benefit or otherwise of
connections at a given location and which could be used to shape the nature of the contract
between the utility and distributed generator. This paper presents a multi objective
performance index for distribution networks with distributed generation which considers a
wide range of technical issues. Distributed generation is extensively located and sized
within the IEEE-34 test feeder, wherein the multi objective performance index is computed
for each configuration.
Various impact indices were addressed in this work, aimed at characterizing the
benefits and negative impacts of DG in distribution networks. Furthermore, a multi
objective performance index that relates impact indices by strategically assigning a
relevance factor to each index was proposed. Though the selection of values of relevance
factors will depend on engineering experience, the presented values solved, in a satisfactory
and coherent fashion, the DG location problem, considering different power generation
outputs for the IEEE-34 test feeder. Nevertheless, the proposed relevance factors are
flexible since electric utilities have different concerns about losses, voltages, protection
schemes, etc. This flexibility makes the proposed methodology even more suitable as a tool
for finding the most beneficial places where DGs may be located, as viewed from an
electric utility technical perspective.
[22] This paper proposes an adaptive weight particle swarm optimization (APSO) for
solving optimal distributed generation (DG) placement. APSO has ability to control
velocity of particles. The objective is to minimize the real power loss within acceptable
voltage limits. Four types of DG are considered including DG supplying real power only,
DG supplying reactive power only, DG supplying real power and consume reactive power,
DG supplying real power and reactive power, representing photovoltaic, synchronous
condenser, wind turbines, and hydro power, respectively. The test systems include 33-bus
and 69-bus radial distribution systems. With a given number of DGs in each type, APSO
could find the optimal sizes and locations of multi-DG which result in less total power
system loss than basic particle swarm optimization (BPSO) and repetitive load flow.
Moreover, if the number of DG increases from one to three, the total power loss will
decrease for all types.](https://image.slidesharecdn.com/jitendiys-130705172418-phpapp01/85/Jitendiys-35-320.jpg)
![JITENDRA SINGH BHADORIYA-SCHOOL OF INSTRUMENTATION,DEVI AHILYA UNIVERSITY
INDORE(M.P.) INDIA
35
In this paper, APSO is proposed for optimal multi-distributed generation placement. Test
results indicate that the PSO-based algorithm is efficiently finding the optimal multi-DG
placement, compared to BPSO and repetitive load flows,
[27] A concept for the optimization of nonlinear functions using particle swarm
methodology is introduced. The evolution of several paradigms is outlined, and an
implementation of one of the paradigms is discussed. Benchmark testing of the paradigm is
described, and applications, including nonlinear function optimization and neural network
training, are proposed. The relationships between particle swarm optimization and both
artificial life and genetic algorithms are described,
Particle swarm optimization is an extremely wimple algorithm that seems to be effective
for optimizing a wide range of functions. We view it as a ]mid-level form of A-life or
biologically derived algorithm, occupying the space in nature between evolutionary
search, which requires eons, and neural processing, which occurs on the order of
milliseconds. Social optimization occurs in the time frame of ordinary experience - in
fact, it is ordinary experience. In addition to its ties with A-life, particle swarm
optimization has obvious ties with evolutionary computation. Conceptually, it seems to
lie somewhere between genetic algorithms and evolutionary programming. It is highly
dependent on stochastic processes, like evolutionary programming. The adjustment
toward pbest and gbest by the particle swarm optimizer is conceptually similar to the
crossover operation utilized by genetic algorithms. It uses the concept of fitness, as do
all evolutionary computation paradigms.
[37] In this paper, a fuzzy system is implemented to dynamically adapt the inertia
weight of the particle swarm optimization algorithm (PSO). Three benchmark functions
with asymmetric initial range settings are selected as the test functions. The same fuzzy
system has been applied to all the three test functions with different dimensions. The
Experimental results illustrate that the fuzzy adaptive PSO is a promising optimization
method, which is especially useful for optimization problems with a dynamic
environment.
In this paper, a fuzzy system is implemented to dynamically adjust the inertia weight to
improve the performance of the PSO. Three benchmark functions have been used for](https://image.slidesharecdn.com/jitendiys-130705172418-phpapp01/85/Jitendiys-36-320.jpg)
![JITENDRA SINGH BHADORIYA-SCHOOL OF INSTRUMENTATION,DEVI AHILYA UNIVERSITY
INDORE(M.P.) INDIA
36
testing the performance of the fuzzy adaptive PSO. For comparison, simulations are
conducted for both the fuzzy adaptive PSO and the PSO with a linearly decreasing
inertia weight. The simulation results illustrate the performance of PSO is not sensitive
To the population size, and the scalability of the PSO is acceptable.
[13] Recently, there has been a great interest in the integration of distributed generation
units at the distribution level. This requires new analysis tools for understanding system
performance. This paper presents a simple methodology for placing a distributed
generator with the view of increasing the load ability of the distribution system. The
effectiveness of the proposed placement technique is demonstrated in a test distribution
system that consists of 30 nodes 32 segments.
A methodology is presented in the paper for distributed generator placement in the
distribution system for maximizing the load ability of the system. In practice, there will
be many factors deciding the location of DG such as fuel availability, land availability
and local ordnance, etc. Given a choice, as corroborated through results the weakest bus
of the system is the best location for DG to increase the loading margin of the system.
[40] This paper presents a genetic algorithm based distributed generator placement
technique in a distribution system for minimizing the total real power losses in the
system. Both the optimal size and location are obtained as outputs from the genetic
algorithm toolbox. The results are verified using two popular power flow analytical tools
for distribution system load flow. The paper also evinces the importance of selecting the
correct size and suitable location for minimizing the system losses.
A genetic algorithm based distributed generator placement technique in a distribution
System for reducing the total real power losses in the system is presented in the paper.
The genetic algorithm toolbox gives both optimal size and the locations as outputs.
These results are verified using two popular load flow programs. This study shows that
the proper placement and size of DG units can have a significant impact on system loss
reduction. It also shows how improper choice of size would lead to higher losses than the
case without DG. However, in practice there will be many constraints to be considered in
selecting the site. Given the choices, the correct sizes of DG units should be placed in the
right location to enjoy the maximum technical benefits.](https://image.slidesharecdn.com/jitendiys-130705172418-phpapp01/85/Jitendiys-37-320.jpg)
![JITENDRA SINGH BHADORIYA-SCHOOL OF INSTRUMENTATION,DEVI AHILYA UNIVERSITY
INDORE(M.P.) INDIA
37
[46] This paper describes the Power System Analysis Toolbox (PSAT), an open source
Matlab and GNU/Octave-based software package for analysis and design of small to
medium size electric power systems. PSAT includes power flow, continuation power flow,
optimal power flow, small-signal stability analysis, and time-domain simulation, as well as
several static and dynamic models, including nonconventional loads, synchronous and
asynchronous machines, regulators, and FACTS. PSAT is also provided with a complete
set of user-friendly graphical interfaces and a Simulink-based editor of one-line network
diagrams. Basic features, algorithms, and a variety of case studies are presented in this
paper to illustrate the capabilities of the presented tool and its suitability for educational
and research purposes.
This paper has presented a new open-source PSAT which runs on Matlab and
GNU/Octave. PSAT comes with a variety of procedures for static and dynamic analysis,
several models of standard and unconventional devices, a complete GUI, and a Simulink-
based network editor. These features make PSAT suited for both educational and research
purposes.](https://image.slidesharecdn.com/jitendiys-130705172418-phpapp01/85/Jitendiys-38-320.jpg)


![JITENDRA SINGH BHADORIYA-SCHOOL OF INSTRUMENTATION,DEVI AHILYA UNIVERSITY
INDORE(M.P.) INDIA
49
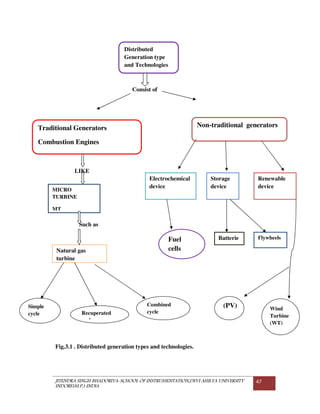
turbines, basically wind mills dedicated to producing electricity, were considered the most
economically viable choice with in the renewable energy portfolio. During this time,
subsidies in the form of tax credits and favorable Federal regulations were available for
wind turbine projects to encourage the penetration of wind turbines and other renewable
energy sources. Today, attention has remained]focused on this technology as an
environmentally sound and convenient alternative. Wind turbines can produce electricity
without requiring additional investments in infrastructure such as new transmission lines,
and are thus commonly employed in remote locations. Most wind turbines currently being
used are small units (less than 5 kW) designed for the residential sector or larger units
installed by electric companies so they can sell green power to their customers.
3.2.7 Storage devices
It consists of batteries, flywheels, and other devices, which are charged during low load
demand and used when required. It is usually combined with other kinds of DG types to
supply the required peak load demand. These batteries are called “deep cycle”. Unlike car
batteries, “shallow cycle” which will be damaged if they have several times of deep
discharging, deep cycle batteries can be charged and discharged a large number of times
without any failure or damage. These batteries have a charging controller for protection
from overcharge and over discharge as it disconnects the charging process when the
batteries have full charge. The sizes of these batteries determine the battery discharge
period. However, flywheels systems can charge and provide 700kW in 5 s.
3.2.8 Renewable devices
Green power is a new clean energy from renewable resources like; sun, wind, and water. Its
electricity price is still higher than that of power generated from conventional oil sources.
3.2.9 Gas Turbines:
gas turbines are widely used for electricity generation thanks to the regulatory incentives
induced to favor fuel diversification towards natural gas and thanks to their low emission
levels. Conversely to reciprocating engines, gas turbines ordered over the period covered
by the survey were widely used as continuous generators (58%), 18% were used as standby
generators and 24% as peaking generators (DGTW, 2008). Gas turbines are
Widely used in cogeneration;](https://image.slidesharecdn.com/jitendiys-130705172418-phpapp01/85/Jitendiys-50-320.jpg)


![JITENDRA SINGH BHADORIYA-SCHOOL OF INSTRUMENTATION,DEVI AHILYA UNIVERSITY
INDORE(M.P.) INDIA
86
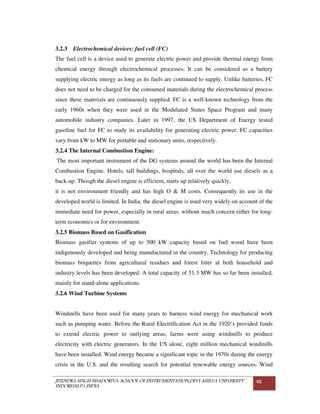
5.1.2 Standard Load Models
As mentioned earlier in this chapter a model is a set of equations to describe the relationship
between the input and output of a system. In the case of load modeling this mathematical
representation is related to the measured voltage and/or frequency at a bus, and the power
consumed by the load, active and reactive. Due to the high diversity and distribution of power
system loads it has been difficult to model it, and several alternatives have been proposed
troughout the time for its representation, depending on its main purpose.
The main classification is in static and dynamic models. A static load model is not dependent
on time, and therefore it describes the relation of the active and reactive power at any time
with the voltage and/or frequency at the same instant of time. On the hand, a dynamic load
model expresses this relation at any instant of time, as a function of the voltage and/or
frequency at past instant of time, including normally the present moment. The static load
models have been used for a long time for both purposes, to represent static load components,
such as resistive and lighting loads, but also to approximate dynamic components. This
approximation may be sufficient in some of the cases, but the fact that the load representation
has critical effects in voltage stability studies is more and more replacing the traditional static
load models with dynamic ones.
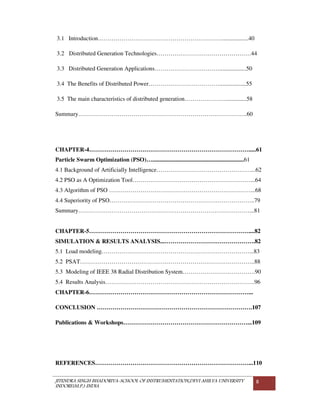
5.1.3 Static Load Models
Common static load models for active and reactive power are expressed in a polynomial or an
exponential form.The static characteristics of the load can be classified into constant power,
constant current and constant impedance load, depending on the power relation to the
voltage. For a constant impedance load, the power dependence on voltage is quadratic, for a
constant current it is linear, and for a constant power the power it is independent of changes
in voltage. The
P=PO [a1 ( )2
+a2 ( )+a3 ]…………………...…5.1
Q=QO[a4 ( )2
+a5 ( )+a6 ]……………………..5.2
equations (5.1) and (5.2), is a polynomial model that represents the sum of these three
categories: Vo ,Po and Qo are the values at the initial conditions of the system for the study,
and the coefficients a1 to a6 are the parameters of the model.](https://image.slidesharecdn.com/jitendiys-130705172418-phpapp01/85/Jitendiys-87-320.jpg)
![JITENDRA SINGH BHADORIYA-SCHOOL OF INSTRUMENTATION,DEVI AHILYA UNIVERSITY
INDORE(M.P.) INDIA
87
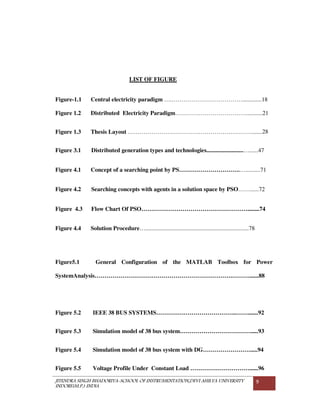
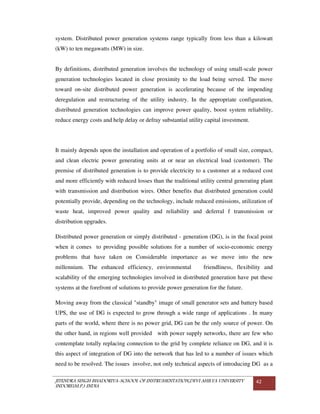
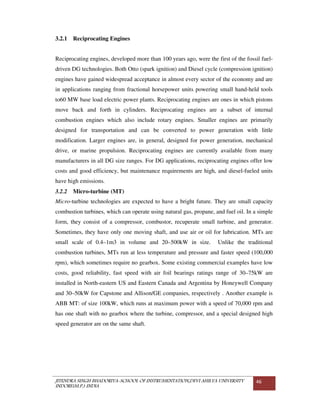
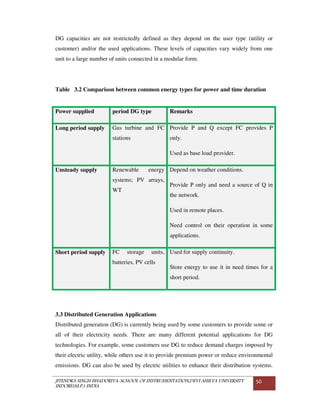
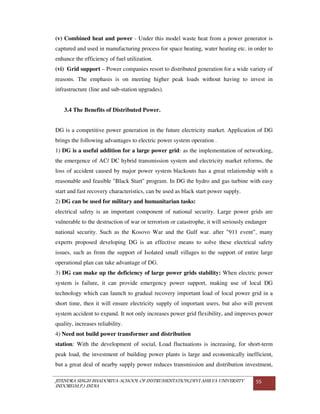
Exponential Load Model
Equations (3.3) and (3.4) express the power dependence with the voltage, as an exponential
function.
P=PO ……………………………………………………………………..7.3
Q=QO ………………………………………………………………….7.4
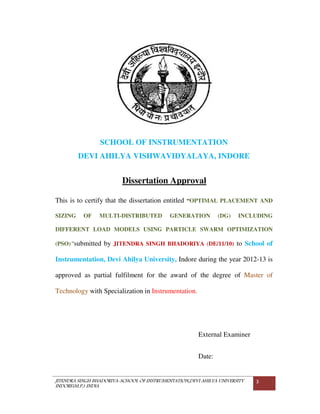
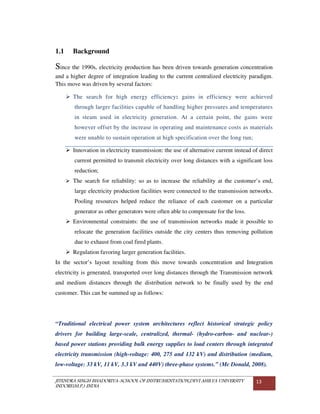
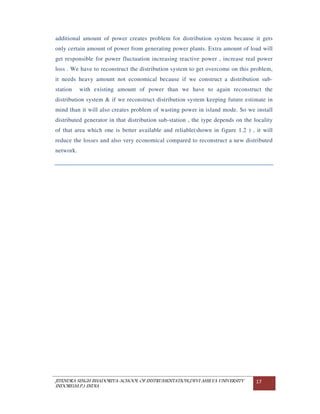
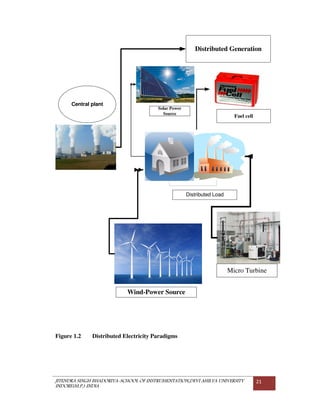
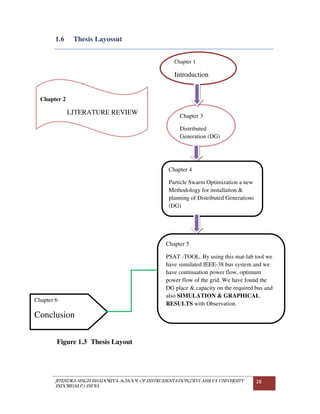
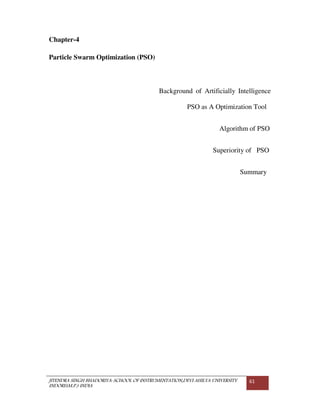
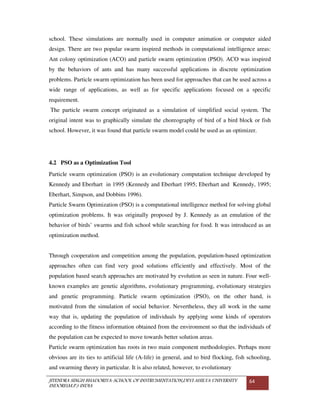
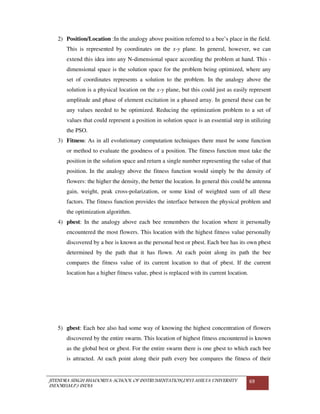
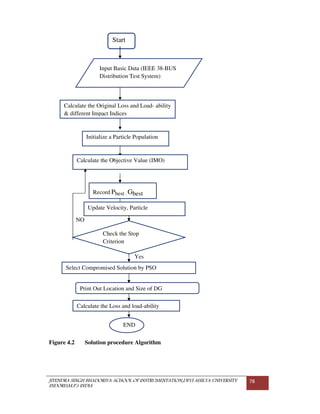
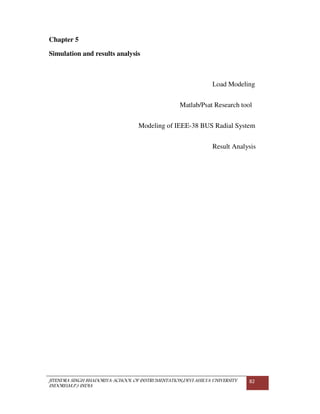
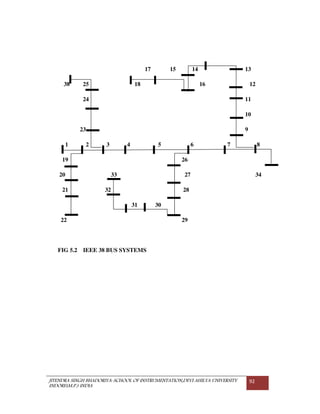
The parameters of this model are np, nq, and the values of the active and reactive power of
Po and Qo, at the initial conditions. Common values for the exponents of the model [T ylor,
1994], [Le Dous, 1999], for different load components are included in
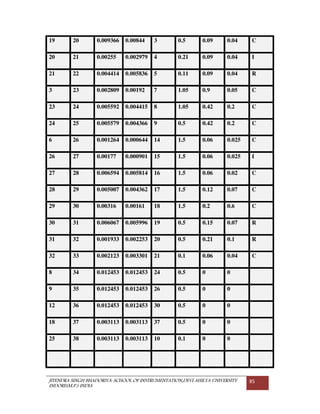
Table 5.2 : Common values for the exponent’s np and nq, for different load
components.
Load Component np(α) nq(β)
Air Conditioner 0.50 2.50
Resistance Space Heater 2.00 0.00
Fluorescent Lighting 1.00 3.00
Pump, fans other motors 0.08 1.60
Large industrial motors 0.05 0.50
Small industrial motors 0.10 0.60
For the special case, where np(α) or nq(β)are equal to 0, 1 and 2, the load model will
represent a constant power, constant current or constant impedance model respectively.](https://image.slidesharecdn.com/jitendiys-130705172418-phpapp01/85/Jitendiys-88-320.jpg)
![JITENDRA SINGH BHADORIYA-SCHOOL OF INSTRUMENTATION,DEVI AHILYA UNIVERSITY
INDORE(M.P.) INDIA
95
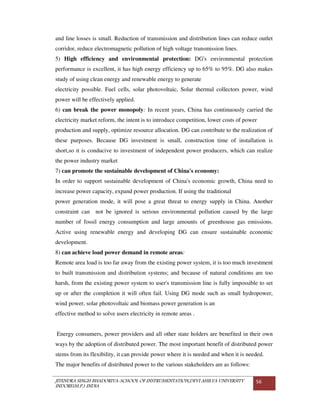
The implementation of PSO starts by random generation of an initial population of possible
solutions. For each solution, size–location pairs of the DG units introduced to the system are
chosen within technical limits of locations and sizes of the DG units. Each solution must
satisfy the operational constraints explained in chapter 1.If one of these constraints is
violated, such a solution is rejected. After generating a population of solutions satisfying the
pre-specified constraints, the objective function of each solution (individual) is evaluated.
Once the population cycle is initialized, the position of each individual in the solution space
is modified using the PSO parameters, e.g., pbest, gbest, and the agent velocity, to generate
the new population. If the DG size and/or location exceed the limit, they are adjusted back
within the specified limits (the boundaries). The operational constraints are then checked. If
any of them is violated the new solution is rejected and another one is generated and checked
until a solution that satisfies the specified limits is found. The algorithm stops when the
maximum number of generations is reached. According to PSO theory, the optimal solution
is the best solution ever found throughout the generations (gbest).
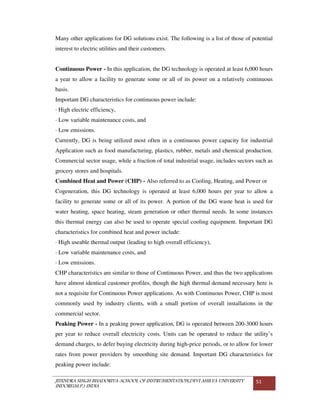
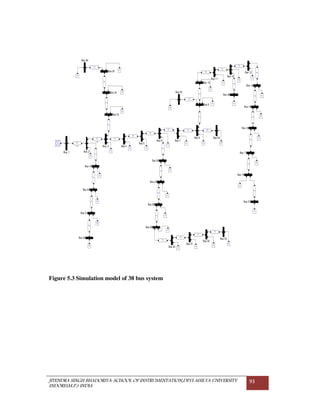
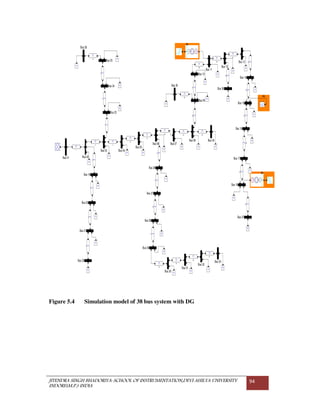
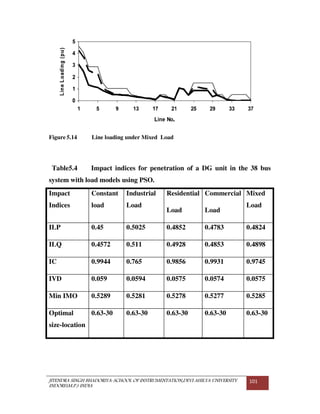
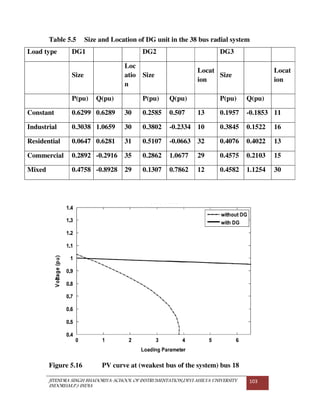
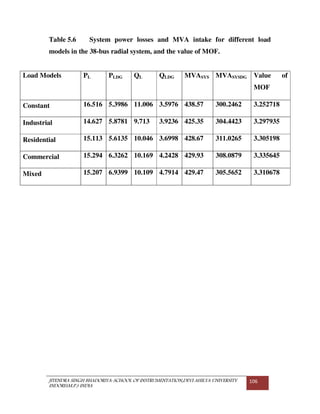
To validate the proposed method, it is applied to the 38-bus system of under the same load
conditions and using the same objective function (IMO) and same values of index weights
used in to optimally place one DG unit in the system. The results of applying the proposed
PSO to the system under different load conditions and the results given in [Table 5.6]. It must
be noted that the run time of the PSO algorithm ranged from 10 to 20 s, which is relatively a
very short time. As shown in Table 5.4, for all load models, all the indices are much reduced
when using PSO for the problem except the IC index. From the values of the IC index, it can
be concluded that the line loading with the resulting size–location pairs was higher than that
of but still within rated limits. However, the overall objective function (IMO) was reduced as
well.
From the previous results, it can be concluded that the proposed PSO method is an efficient
method to deal with the problem introduced in this research work.](https://image.slidesharecdn.com/jitendiys-130705172418-phpapp01/85/Jitendiys-96-320.jpg)


![JITENDRA SINGH BHADORIYA-SCHOOL OF INSTRUMENTATION,DEVI AHILYA UNIVERSITY
INDORE(M.P.) INDIA
110
References-
[1] V.V. Thong, J. Driesen, R. Belmans, Transmission system operation concerns with high
penetration level of distributed generation, in: Proc. of Inter. Universities Power Engineering
Conference, Brighton, 2007, pp. 867–871.
[2] D. Zhu, R.P. Broadwater, K. Tam, R. Seguin, H. Asgeirsson, Impact of DG placement on
reliability and efficiency with time-varying loads, IEEE Transactions on Power Systems 21
(1) (2006) 419–427.
[3] A.M. El-Zonkoly, "Optimal placement of multi-distributed generation units including
different load models using particle swarm optimization," Swarm and Evolutionary
Computation Elsevier, vol. 1, pp. 50–59, 2011.
[4] A. Keane, M. O’Malley, Optimal distributed generation plant mix with novel loss
adjustment factors, in: IEEE Power Eng. Society General Meeting, 2006.
[5] Y.A. Katsigiannis, P.S. Georgilakis, Optimal sizing of small isolated hybrid power
systems using tabu search, Journal of Optoelectronics and Advanced Materials 10 (5) (2008)
1241–1245.
[6] M.F. AlHajri, M.R. AlRashidi, M.E. El-Hawary, Hybrid particle swarm optimization
approach for optimal distribution generation sizing and allocation in distribution systems, in:
Proc. of Canadian Conference on Electrical and Computer Engineering, Vancouver, Canada,
2007, pp. 1290–1293.
[7] L.Y. Wong, S.R. Abdul Rahim, M.H. Sulaiman, O. Aliman, Distributed generation
installation using particle swarm optimization, in: Proc. of Inter. Power Engineering and
Optimization Conf., PEOCO2010, Shah Alam, Selangor, Malaysia, 2010, pp. 159–163.
[8] M.P. Lalitha, V.C.V. Reddy, V. Usha, Optimal DG placement for minimum real power
loss in radial distribution systems using PSO, Journal of Theoretical and Applied Information
Technology (2010) 107–116.
[9] W. El-Khattam, Y.G. Hegazy, M.M.A. Salama, An integrated distributed generation
optimization model for distribution system planning, IEEE Transactions on Power Systems
20 (2) (2005) 1158–1165.
[10] M. Mardaneh, G.B. Gharehpetian, Siting and sizing of DG units using GA and OPF
based technique, in: IEEE Region 10 Conference, vol. 3, 2004, pp. 331–334.
[11] H. lyer, S. Ray, R. Ramakumar, Voltage profile improvement with distributed
generation, in: IEEE Power Eng. Society General Meeting, vol. 3, 2005, pp. 2977–2984.](https://image.slidesharecdn.com/jitendiys-130705172418-phpapp01/85/Jitendiys-111-320.jpg)
![JITENDRA SINGH BHADORIYA-SCHOOL OF INSTRUMENTATION,DEVI AHILYA UNIVERSITY
INDORE(M.P.) INDIA
111
[12] M.A. Kashem, D.T. Le, M. Negnevitsky, G. Ledwich, Distributed generation for
minimization of power losses in distribution systems, in: IEEE Power Eng. Society General
Meeting, 2006.
[13] Mithulananthan N, Oo T. Distributed Generator Placement to Maximize the Loadability of
Distribution System. Direct.
[14] IEEE task force on load representation for dynamic performance, load representation for
dynamic performance analysis, IEEE Transactions on Power Systems 8 (2) (1993) 472–482.
[15] T. Gozel, M.H. Hocaoglu, An analytical method for the sizing and siting of distributed
generators in radial systems, International Journal of Electric Power Systems Research 79
(2009) 912–918.
[16] M.M. Elnashar, R. El-Shatshat, M.A. Salama, Optimum siting and sizing of a large
distributed generators in a mesh connected system, International Journal of Electric Power
Systems Research 80 (2010) 690–697.
[17] L.F. Ochoa, A. Padilha-Feltrin, G.P. Harrison, Evaluating distributed generation impacts
with a multi objective index, IEEE Transactions on Power Delivery 21 (3) (2006) 1452–
1458.
[18] R.K. Singh, S.K. Goswami, Optimum allocation of distributed generations based on
nodal pricing for profit, loss reduction and voltage improvement including voltage rise issue,
International Journal of Electrical Power and Energy Systems 32 (2010) 637–644.
[19] H. Hedayati, S.A. Nabaviniaki, A. Akbarimajd, A method for placement of DG units in
distribution networks, IEEE Transactions on Power Delivery 23 (3) (2008) 1620–1628.
[20] G. Celli, E. Ghiani, S. Mocci, F. Pilo, A multiobjective evolutionary algorithm for the
sizing and siting of distributed generation, IEEE Transactions on Power Systems 20 (2)
(2005) 750–757.
[22] W. Prommee, W. Ongsakul, Optimal multi-distributed generation placement by
adaptive weight particle swarm optimization, in: Proc. of Inter. Conference on Control,
Automation and Systems, Seoul, Korea, 2008, pp. 1663–1668.
[23] A. Safari, R. Jahani, H.A. Shayanfar, J. Olamaei, Optimal DG allocation in distribution
network, International Journal of Electrical and Electronics Engineering 4 (8) (2010) 550–
553.
[24] Wichit Krueasuk, Weerakorn Ongsakul, Optimal placement of distributed generation
using particle swarm optimization, in: The Proc. of Australian Universities Power
Engineering Conf., 2006, pp. 1–6.](https://image.slidesharecdn.com/jitendiys-130705172418-phpapp01/85/Jitendiys-112-320.jpg)
![JITENDRA SINGH BHADORIYA-SCHOOL OF INSTRUMENTATION,DEVI AHILYA UNIVERSITY
INDORE(M.P.) INDIA
112
[25] M. AlHajri, Sizing and placement of distributed generation in electrical distribution
systems using conventional and heuristic optimization methods, Ph.D. Thesis, Dalhousie
University, Halifax, Nova Scotia, 2009.
[27] J. Kennedy, R. Eberhart, Particle swarm optimization, in: Proc. IEEE Int. Conf. Neural
Networks, Perth, Australia, vol. IV, 1995, pp. 1942–1948.
[28] Y. Shi, R. Eberhart, A modified particle swarm optimizer, in: Proc. IEEE Int. Conf.
Evolutionary Computation ., Anchorage, UK, 1998, pp. 69–73.
[29] H. Yoshida, K. Kawata, Y. Fukuyama, A particle swarm optimization for reactive power
and voltage control considering voltage security assessment, IEEE Transactions on Power
Systems 15 (2000) 1232–1239.
[30] N. Deeb, S. Shahidehpour, Cross decomposition for multi-area optimal reactive power
planning, IEEE Transactions on Power Systems PWRS-8 (1993) 1539–1544.
[31] Power System Analysis Toolbox, PSAT. Available online:
http://www.power.uwaterloo.ca/~fmilano/psat.htm.
[32] J. Kennedy, R. Eberhart, Particle swarm optimization, in: Proc. of IEEE Inter. Conf. on
Neural Networks, ICNN, 1995, pp. 1942–1948.
[37] Y. Shi, R.C. Eberhart, Fuzzy adaptive particle swarm optimization, in: Proc. Of the 2001
Congress on Evolutionary Computation, 2001, pp. 101–106.
[38] J.J. Liang, A.K. Qin, P.N. Suganthan, S. Baskar, Comprehensive learning particle swarm
optimizer for global optimization of multimodal functions, IEEE Transactions on
Evolutionary Computation 10 (3) (2006) 281–295.
[39 ]D. Singh, D. Singh, K.S. Verma, Multiobjective optimization for DG planning with load
models, IEEE Transactions on Power Systems 24 (1) (2009) 427–436.
[40] Mithulananthan N, Than Oo and Le Van Phu, ‘Distributed generator placement in power
distribution system using genetic algorithm to reduce losses’, TIJSAT, 9(3) (2004), 55–62.
[41] Ackermann, T., Andersson, G., S.oder, L., (2001). “Distributed generation: a
definition”. Electric Power Systems Research 57, pp. 195–204.
[42] J. Martin, "Distributed vs. centralized electricity generation: are we witnessing a change
of paradigm? An introduction to distributed generation," (HEC Paris), May 2009.
[43] El-Kattam,W., Salama, M.M.A, (2004). “Distributed Generation Technologies:
definitions and benefits”. Electric Power Research, 71, pp. 119-128.
[44] McDonald, J., (2008). “Adaptive intelligent power systems: active distribution
networks”. Energy Policy 36, pp. 4346–4351.](https://image.slidesharecdn.com/jitendiys-130705172418-phpapp01/85/Jitendiys-113-320.jpg)
![JITENDRA SINGH BHADORIYA-SCHOOL OF INSTRUMENTATION,DEVI AHILYA UNIVERSITY
INDORE(M.P.) INDIA
113
[45] Pehnt, M., Schneider, L., (2006). “Embedding Micro Cogeneration in the Energy Supply
System”, in Pehnt, M., Cames, M., Fischer, C., Praetorius, B., Shneider, L., Schumacher, K.,
Voss, J.P. Micro cogeneration towards decentralized energy
systems, Berlin: Springer, pp. 197-218.
[46] F. Milano, An open source power system analysis toolbox. Power Engineering Society
General Meeting, 2006. IEEE, Montreal, Que, 2006.](https://image.slidesharecdn.com/jitendiys-130705172418-phpapp01/85/Jitendiys-114-320.jpg)


This dissertation examines the optimal placement and sizing of multiple distributed generation (DG) units in a distribution system considering different load models using particle swarm optimization (PSO). The author develops a multi-objective function to optimize that includes parameters like active and reactive power losses, voltage profile, line loading, short circuit level, and grid intake. PSO is used as the optimization technique to determine the best DG unit sizes and locations. The approach is tested on the IEEE 38-bus test system and results show the effectiveness of using PSO for optimal DG placement and sizing while considering different load models.