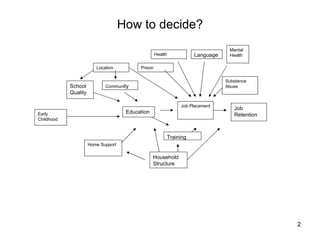
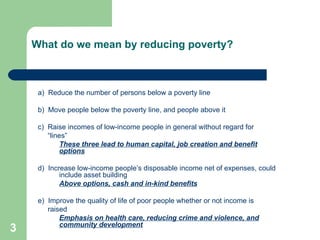
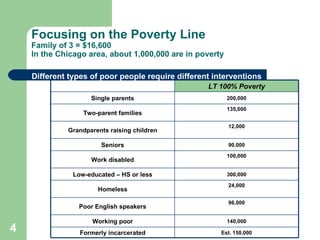
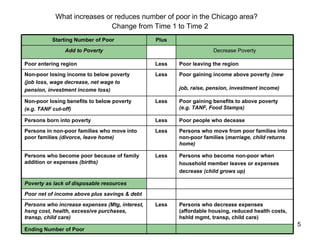
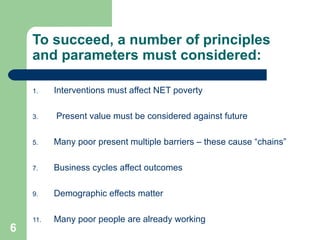
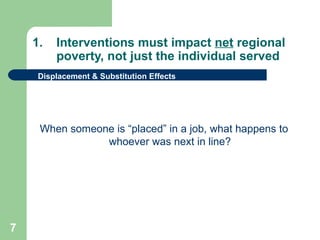
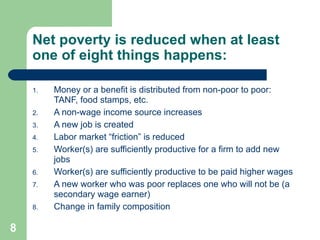
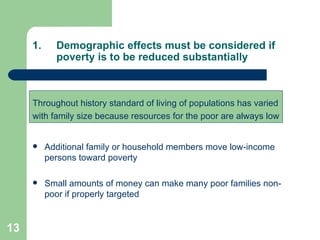
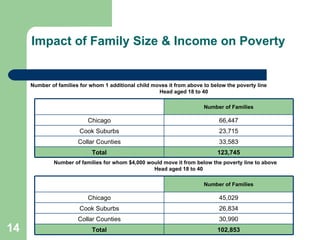
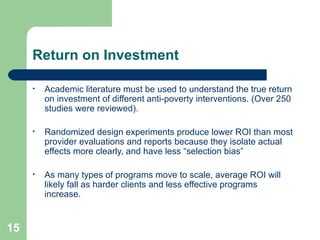
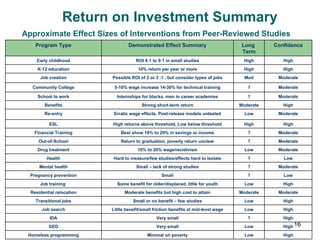
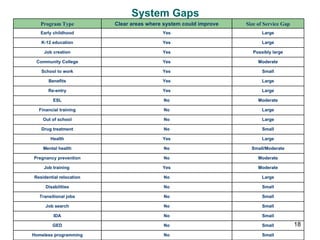
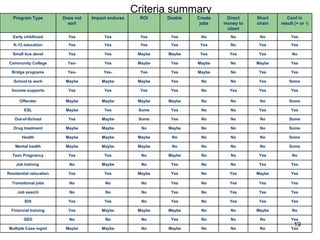
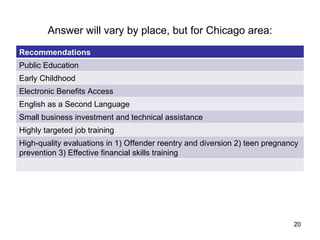
The document discusses strategies for creating an effective anti-poverty program in the Chicago area. It analyzes different types of interventions and barriers faced by the poor. Early childhood education, job creation, income supports, and English language learning are identified as promising approaches. Successful interventions need to consider displacement effects, demographic trends, business cycles, and varying returns on investment across program types.
1. Creating the An Anti-Poverty Program James Lewis, Ph.D. Chicago Community Trust March, 2010
2. How to decide? Education Early Childhood Location Substance Abuse Health Mental Health Prison School Quality Commun ity Job Placement Job Retention Language Training Household Structure Home Support
3.
4. Focusing on the Poverty Line Family of 3 = $16,600 In the Chicago area, about 1,000,000 are in poverty Different types of poor people require different interventions LT 100% Poverty Single parents 200,000 Two-parent families 135,000 Grandparents raising children 12,000 Seniors 90,000 Work disabled 100,000 Low-educated – HS or less 300,000 Homeless 24,000 Poor English speakers 96,000 Working poor 140,000 Formerly incarcerated Est. 150,000
5. What increases or reduces number of poor in the Chicago area? Change from Time 1 to Time 2 Starting Number of Poor Plus Add to Poverty Decrease Poverty Poor entering region Less Poor leaving the region Non-poor losing income to below poverty (job loss, wage decrease, net wage to pension, investment income loss) Less Poor gaining income above poverty (new job, raise, pension, investment income) Non-poor losing benefits to below poverty (e.g. TANF cut-off) Less Poor gaining benefits to above poverty (e.g. TANF, Food Stamps) Persons born into poverty Less Poor people who decease Persons in non-poor families who move into poor families (divorce, leave home) Less Persons who move from poor families into non-poor families ( marriage, child returns home) Persons who become poor because of family addition or expenses (births) Less Persons who become non-poor when household member leaves or expenses decrease (child grows up) Poverty as lack of disposable resources Poor net of income above plus savings & debt Persons who increase expenses (Mtg, interest, hsng cost, health, excessive purchases, transp, child care) Less Persons who decrease expenses (affordable housing, reduced health costs, hshld mgmt, transp, child care) Ending Number of Poor
6.
7.
8.
9.
10.
11. Household heads 18-64 in Poverty by Types of Barriers and Possible Strategies Summary Table on Barriers Num Probs Education Family English Wages Persons 4 HS or Less Single parent Poor No 13,408 3 HS or Less Other family Poor No 24,732 3 HS or Less Single parent Poor Wages 12,427 Most are foreign-born. With little or no wages, minimal return expected from better English, but would be a place to begin. May not be eligible for all benefits. 3 HS or Less Single parent OK No 79,502 Mostly single mothers with little education or skills. 2 HS or Less Other family Poor Wages 20,497 2 HS or Less Other family OK No 74,042 Has little education, but has either 2 parents or no children. Good candidates for community college. 25% are already working. 2 HS or Less Single parent OK Wages 48,376 Hard to go to school as single parent w/job. Focus on daycare (children) and maximizing benefits. 2 HS Plus Other family Poor No 4,080 2 HS Plus Single parent Poor No 4,208 2 HS Plus Single parent Poor Wages 1,060 Has some education. Improving English would help take better advantage of it. Daycare might help unemployed single parents. 2 HS Plus Single parent OK No 27,701 May need daycare and help finding a job. Num Probs Education Family English Wages Persons 1 HS or Less Other family OK Wages 51,909 Is working, and either 2 parents or no kids, but poor education. Best candidate for community college. 1 HS Plus Single parent OK Wages 38,536 Single parent working. Needs to focus on benefits. Possibly could do training to build on education. 1 HS Plus Other family Poor Wages 4,208 1 HS Plus Other family OK No 53,209 Should have minimal family encumbrance, and some education, but isn’t working. Needs placement, possibly training. 0 HS Plus Other family OK Wages 57,391 Has basis of education and work experience, either 2 parents or no kids. Best candidate for training.
12.
13.
14. Impact of Family Size & Income on Poverty Number of families for whom 1 additional child moves it from above to below the poverty line Head aged 18 to 40 Number of families for whom $4,000 would move it from below the poverty line to above Head aged 18 to 40 Number of Families Chicago 66,447 Cook Suburbs 23,715 Collar Counties 33,583 Total 123,745 Number of Families Chicago 45,029 Cook Suburbs 26,834 Collar Counties 30,990 Total 102,853
15.
16. Return on Investment Summary Approximate Effect Sizes of Interventions from Peer-Reviewed Studies Program Type Demonstrated Effect Summary Long Term Confidence Early childhood ROI 4:1 to 9:1 in small studies High High K-12 education 10% return per year or more High High Job creation Possible ROI of 2 or 3 :1 , but consider types of jobs Mod Moderate Community College 5-10% wage increase 14-30% for technical training ? Moderate School to work Internships for blacks, men in career academies ? Moderate Benefits Strong short-term return Moderate High Re-entry Erratic wage effects, Post-release models untested Low Moderate ESL High returns above threshold, Low below threshold High High Financial Training Best show 10% to 20% in savings or income ? Moderate Out-of-School Return to graduation, poverty return unclear ? Moderate Drug treatment 10% to 20% wage/recidivism Low Moderate Health Hard to measure/few studies/effects hard to isolate ? Low Mental health Small – lack of strong studies ? Moderate Pregnancy prevention Small ? Low Job training Some benefit for older/displaced, little for youth Low High Residential relocation Moderate benefits but high cost to attain Moderate Moderate Transitional jobs Small or no benefit – few studies Low High Job search Little benefit/small friction benefits at mid-level wage Low High IDA Very small ? High GED Very small Low High Homeless programming Minimal on poverty Low High
17. Economic Effects-Equilibrium Impact Program Type Sorting/Displacement Raise Firm Productivity—Wages Raise Firm Productivity—Expansion Reduce Firm Friction Costs Raise Income Without Displacement Early childhood None short-term Long term Long term No For now K-12 education None short-term High High No For now Job creation Small High High No Yes Community College Moderate Low Low No Maybe School to work Moderate Low Low Some Low Benefits None N/A N/A Some High Re-entry Moderate No No Maybe Low ESL Some Moderate Moderate Some No Financial Training None Low Low No Yes Out-of-School None Moderate Moderate No Low Drug treatment Some Low Low No Maybe Health Some Some Some High Maybe Mental health Some Low Low Low No Pregnancy prevention None N/A N/A N/A Yes Job training Some Some Some Some Some Residential relocation Moderate – if to suburbs No No No Some Transitional jobs High No No Some No Job search High No No Some No IDA Low No No No Maybe GED High Low Low Low No Homeless programming High No No No No
18. System Gaps Program Type Clear areas where system could improve Size of Service Gap Early childhood Yes Large K-12 education Yes Large Job creation Yes Possibly large Community College Yes Moderate School to work Yes Small Benefits Yes Large Re-entry Yes Large ESL No Moderate Financial training No Large Out of school No Large Drug treatment No Small Health Yes Large Mental health No Small/Moderate Pregnancy prevention No Moderate Job training Yes Moderate Residential relocation No Large Disabilities No Small Transitional jobs No Small Job search No Small IDA No Small GED No Small Homeless programming No Small
19. Criteria summary Program Type Does not sort Impact endures ROI Doable Create jobs Direct money to client Short chain Conf in result (+ or -) Early childhood Yes Yes Yes Yes No No No Yes K-12 education Yes Yes Yes Yes Yes No Yes Yes Small bus devel Yes Yes Maybe Maybe Yes Yes Yes No Community College Yes- Yes Maybe Yes Maybe No Maybe Yes Bridge programs Yes- Yes- Yes Yes Maybe No Yes Yes School to work Maybe Maybe Maybe Yes No No Yes Some Income supports Yes Yes Yes Yes No Yes Yes Yes Offender Maybe Maybe Maybe Maybe No No No Some ESL Maybe Yes Some Yes No No Yes Yes Out-of-School Yes Maybe Some Yes No No No Some Drug treatment Maybe Maybe No Maybe No No No Some Health Maybe Maybe Maybe No No No No Some Mental health Maybe Maybe Maybe No No No No Some Teen Pregnancy Yes Yes No Maybe No No Yes No Job training No Maybe No Yes No No Yes Yes Residential relocation Yes Yes Maybe Yes No Yes Maybe Yes Transitional jobs No No No Yes No Yes Yes Yes Job search No No No Yes No Yes Yes Yes IDA Yes Yes No Yes No Yes Yes Yes Financial training Yes Maybe Maybe Maybe No No Maybe No GED No No No Yes No No No Yes Multiple Case mgmt Maybe Maybe No Maybe No No No Yes
20. Answer will vary by place, but for Chicago area: Recommendations Public Education Early Childhood Electronic Benefits Access English as a Second Language Small business investment and technical assistance Highly targeted job training High-quality evaluations in 1) Offender reentry and diversion 2) teen pregnancy prevention 3) Effective financial skills training