Download to read offline

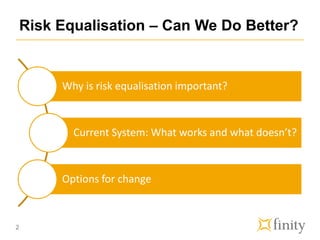
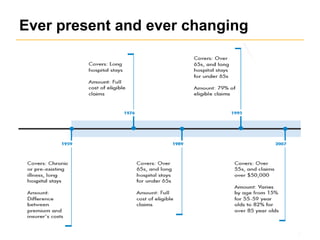
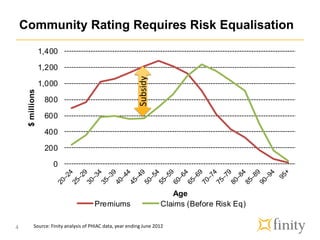
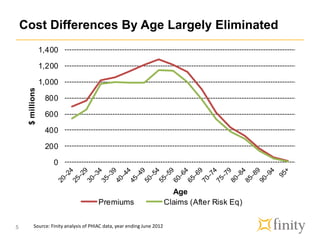
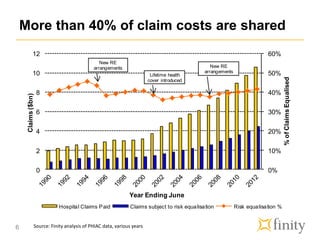
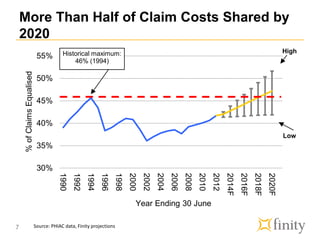
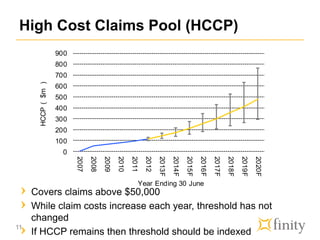
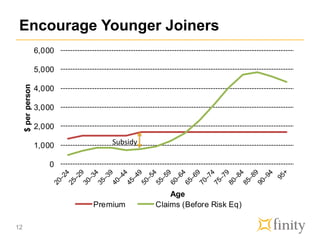


This document discusses options for improving Australia's health insurance risk equalization system. The current system largely eliminates cost differences by age through subsidies, but other cost differences remain. It shares over 40% of claim costs between insurers. The document evaluates options like risk-based capitation, a high-cost claims pool, and incentives for younger people to join. It concludes that while risk equalization systems require periodic change, modifications to the high-cost pool and incentives for youth could lengthen the life of Australia's current system before considering more substantial reforms like risk-based capitation.


![How Your State Is Affected By Property Taxes [Infographic]](https://cdn.slidesharecdn.com/ss_thumbnails/state-property-taxes-150515193432-lva1-app6892-thumbnail.jpg?width=640&height=640&fit=bounds)


![Awareness of digital currency[1] (1).pptx](https://cdn.slidesharecdn.com/ss_thumbnails/awarenessofdigitalcurrency11-260125155504-b1badee4-thumbnail.jpg?width=640&height=640&fit=bounds)


