Jamaica - Trade Profile [UWI's Shridath Ramphal Centre]
•
1 like•296 views

Jamaica has a population of 2.7 million people within an area of 10,991 square kilometers. Its main exports include sugar, inorganic chemicals, precious metal compounds, and beverages. The United States is its largest export market, accounting for 49% of exports. Imports exceed exports, with its main imports including mineral fuels, vehicles, and electrical equipment from the United States, Venezuela, and other countries. The services trade balance is positive, with travel exports making up 71% of total exported services.

Recommended
Recommended
More Related Content
What's hot
What's hot (14)
Viewers also liked
Viewers also liked (17)
Similar to Jamaica - Trade Profile [UWI's Shridath Ramphal Centre]
Similar to Jamaica - Trade Profile [UWI's Shridath Ramphal Centre] (20)
More from Office of Trade Negotiations (OTN), CARICOM Secretariat
More from Office of Trade Negotiations (OTN), CARICOM Secretariat (20)
Jamaica - Trade Profile [UWI's Shridath Ramphal Centre]
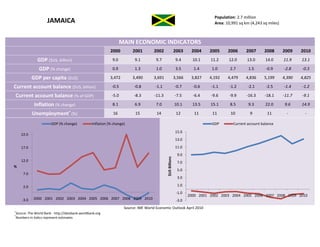
- 1. Population: 2.7 million JAMAICA Area: 10,991 sq km (4,243 sq miles) MAIN ECONOMIC INDICATORS 2000 2001 2002 2003 2004 2005 2006 2007 2008 2009 2010 GDP ($US, billion) 9.0 9.1 9.7 9.4 10.1 11.2 12.0 13.0 14.0 11.9 13.1 GDP (% change) 0.9 1.3 1.0 3.5 1.4 1.0 2.7 1.5 -0.9 -2.8 -0.3 GDP per capita ($US) 3,472 3,490 3,691 3,566 3,827 4,192 4,479 4,836 5,199 4,390 4,825 Current account balance ($US, billion) -0.5 -0.8 -1.1 -0.7 -0.6 -1.1 -1.2 -2.1 -2.5 -1.4 -1.2 Current account balance (% of GDP) -5.0 -8.3 -11.3 -7.5 -6.4 -9.6 -9.9 -16.3 -18.1 -11.7 -9.1 Inflation (% change) 8.1 6.9 7.0 10.1 13.5 15.1 8.5 9.3 22.0 9.6 14.9 Unemployment+ (%) 16 15 14 12 11 11 10 9 11 - - GDP (% change) Inflation (% change) GDP Current account balance 15.0 22.0 13.0 17.0 11.0 9.0 $US Billions 12.0 7.0 % 5.0 7.0 3.0 2.0 1.0 -1.0 2000 2001 2002 2003 2004 2005 2006 2007 2008 2009 2010 -3.0 2000 2001 2002 2003 2004 2005 2006 2007 2008 2009 2010 -3.0 Source: IMF World Economic Outlook April 2010 + Source: The World Bank - http://databank.worldbank.org * Numbers in italics represent estimates
- 2. Population: 2.7 million JAMAICA Area: 10,991 sq km (4,243 sq miles) MAIN TRADE INDICATORS – GOODS 2005 2006 2007 2008 2009 Trade Balance ($US thousands) -3,370,364 -3,052,571 -4,523,668 -6,026,595 -3,748,219 Total Exported Value ($US thousands) 1,514,467 1,988,808 2,223,961 2,438,810 1,316,037 Total Imported Value ($US thousands) 4,884,831 5,041,379 6,747,629 8,465,405 5,064,256 Top 10 Markets by % of Total Exported Value (2009) Top 10 Markets by % of Total Imported Value (2009) United States of America 49% United States of America 37% Canada 10% Venezuela 13% United Kingdom 10% Trinidad and Tobago 11% Norway 4% China 5% Iceland 3% Brazil 3% Japan 3% Japan 2% Netherlands 3% Mexico 2% France 2% Canada 2% Trinidad and Tobago 2% Germany 2% China 1% United Kingdom 2% Sugars and Top 5 Exports by % of Total Exported Value (2009) Vehicles Top 5 Imports by % of Total Imported Value (2009) sugar other than confectionery, railway, Beverages, Ores, slag 6% tramway, 4% spirits and Inorganic and ash, 6% vinegar, 4% chemicals, precious metal compound, Electrical, isotopes, 28% Mineral fuels, Mineral electronic oils, distillation fuels, oils, equipment, 5% products, 16% distillation products, Nuclear Beverages, 28% reactors, spirits and boilers, vinegar, 21% machinery, 6% Source: International Trade Centre – www.trademap.org
- 3. Population: 2.7 million JAMAICA Area: 10,991 sq km (4,243 sq miles) MAIN TRADE INDICATORS – SERVICES 2004 2005 2006 2007 2008 Trade Balance ($US thousands) 571,690 607,490 627,690 419,600 427,549 Total Exported Value ($US thousands) 2,297,130 2,329,660 2,648,680 2,706,550 2,794,613 Total Imported Value ($US thousands) 1,725,440 1,722,170 2,020,990 2,286,950 2,367,064 Top Exports by % of Total Exported Value (2008) Top Imports by % of Total Imported Value (2008) Travel 71% Transportation 47% Transportation 17% Other business services 23% Communications services Travel 11% 5% Insurance services 8% Other business services 2% Government services 3% Financial services 2% Communications services 2% Personal, cultural & recreational services 1% Royalties & license fees 2% Government services 1% Financial services 2% Computer & information services 1% Computer & information services 1% Royalties & license fees 1% Personal, cultural & recreational services 0.2% Insurance services 0.4% Construction services 0.2% Source: International Trade Centre – www.trademap.org