Download to read offline


![M. Khalili, H. Arabshahi, M. H. Tayarani and M. Bazrafshan / International Journal of
Engineering Research and Applications (IJERA) ISSN: 2248-9622 www.ijera.com
Vol. 3, Issue 4, Jul-Aug 2013, pp.1636-1639
1639 | P a g e
0.0 2.0x10
17
4.0x10
17
6.0x10
17
8.0x10
17
1.0x10
18
4
5
6
7
8
9
10
Electronmobility
(cm
2
/v.s)
Ionized impurity density(cm
-3
)
SiC T=250K
SiC T=300K
SiC T=350K
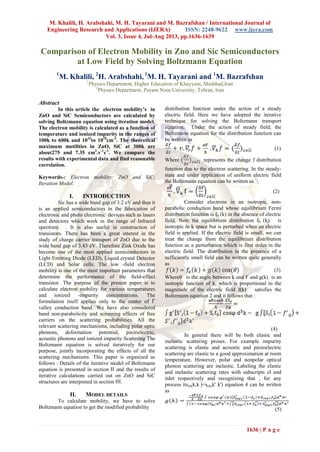
Fig 8. Changes the electron mobility function in
terms of electron concentration in bulk SiC at the
different temperature.
IV. CONCLUTION
Our calculation results show that the
electron mobility decrease by electrons concentration
increasing and the electron mobility decrease by
temperature increasing .electron mobility ZnO more
than SiC.
V. ACKNOWLEDGEMENT
I would like to thank A. Vatan-khahan and
M. Ghafourian for their useful comments.
REFERENCES
[1] Vatan-khahan , M. H . Tayarani, ,
A.Saderemomtaz and H.
Arabshahi, « Comparison of electron
scattering mechanisims and electron
mobility in AIN and GaN at low electric
field application », Internatinal journal of
scieence and Advanced Technology(ISSN
2221-8386),(july 2011),pp116-119.
[2] H. Arabshahi, A. Vatan- khahan and M. H.
Tayarani ,”Comparision of low field electron
transport properties in InN and GaN
semiconductors by solving Boltzmann
equation using iteration model”,Internatonal
journal of science and Advance Technology
(ISSN 2221-8386),(2011),PP 6-11.
[3] H. Arabshahi , M. Reza Rokn –Abadi and
F.Badieyan Bagh-siyahi,”Comparison of
high field electron transport propertis in
wurtzite phase of ZnO , GaN and
SiC”,Research journal of applied
science5(3):215-220,2010
[4] H. Arabshahi,A. pashaei and M. H.
Tayarani,”Comparison of low field electron
transport propertiese in compounds of group
sΙΙΙ-V semiconductors by solving Boltzmann
equation using iteration model”, Internatinal
journal of enigeering invention ,ISSN:2278-
7461,(2012)PP:56-61](https://image.slidesharecdn.com/iz3416361639-130729003046-phpapp01/85/Iz3416361639-4-320.jpg)

This study calculates the electron mobility of ZnO and SiC semiconductors using the Boltzmann equation and an iterative model, focusing on temperature ranges from 100K to 600K and ionized impurity concentrations from 10^16 to 10^18 cm^-3. The results indicate that electron mobility decreases with increasing temperature and impurity concentration, with ZnO exhibiting higher mobility than SiC at 300K. The findings correlate well with experimental data and highlight the impact of phonon interactions and scattering rates on mobility.


