Download to read offline
![290 Murray et al. Site-specific IVUS analysis
© Cardiovascular Diagnosis and Therapy. All rights reserved. www.thecdt.org Cardiovasc Diagn Ther 2014;4(4):287-298
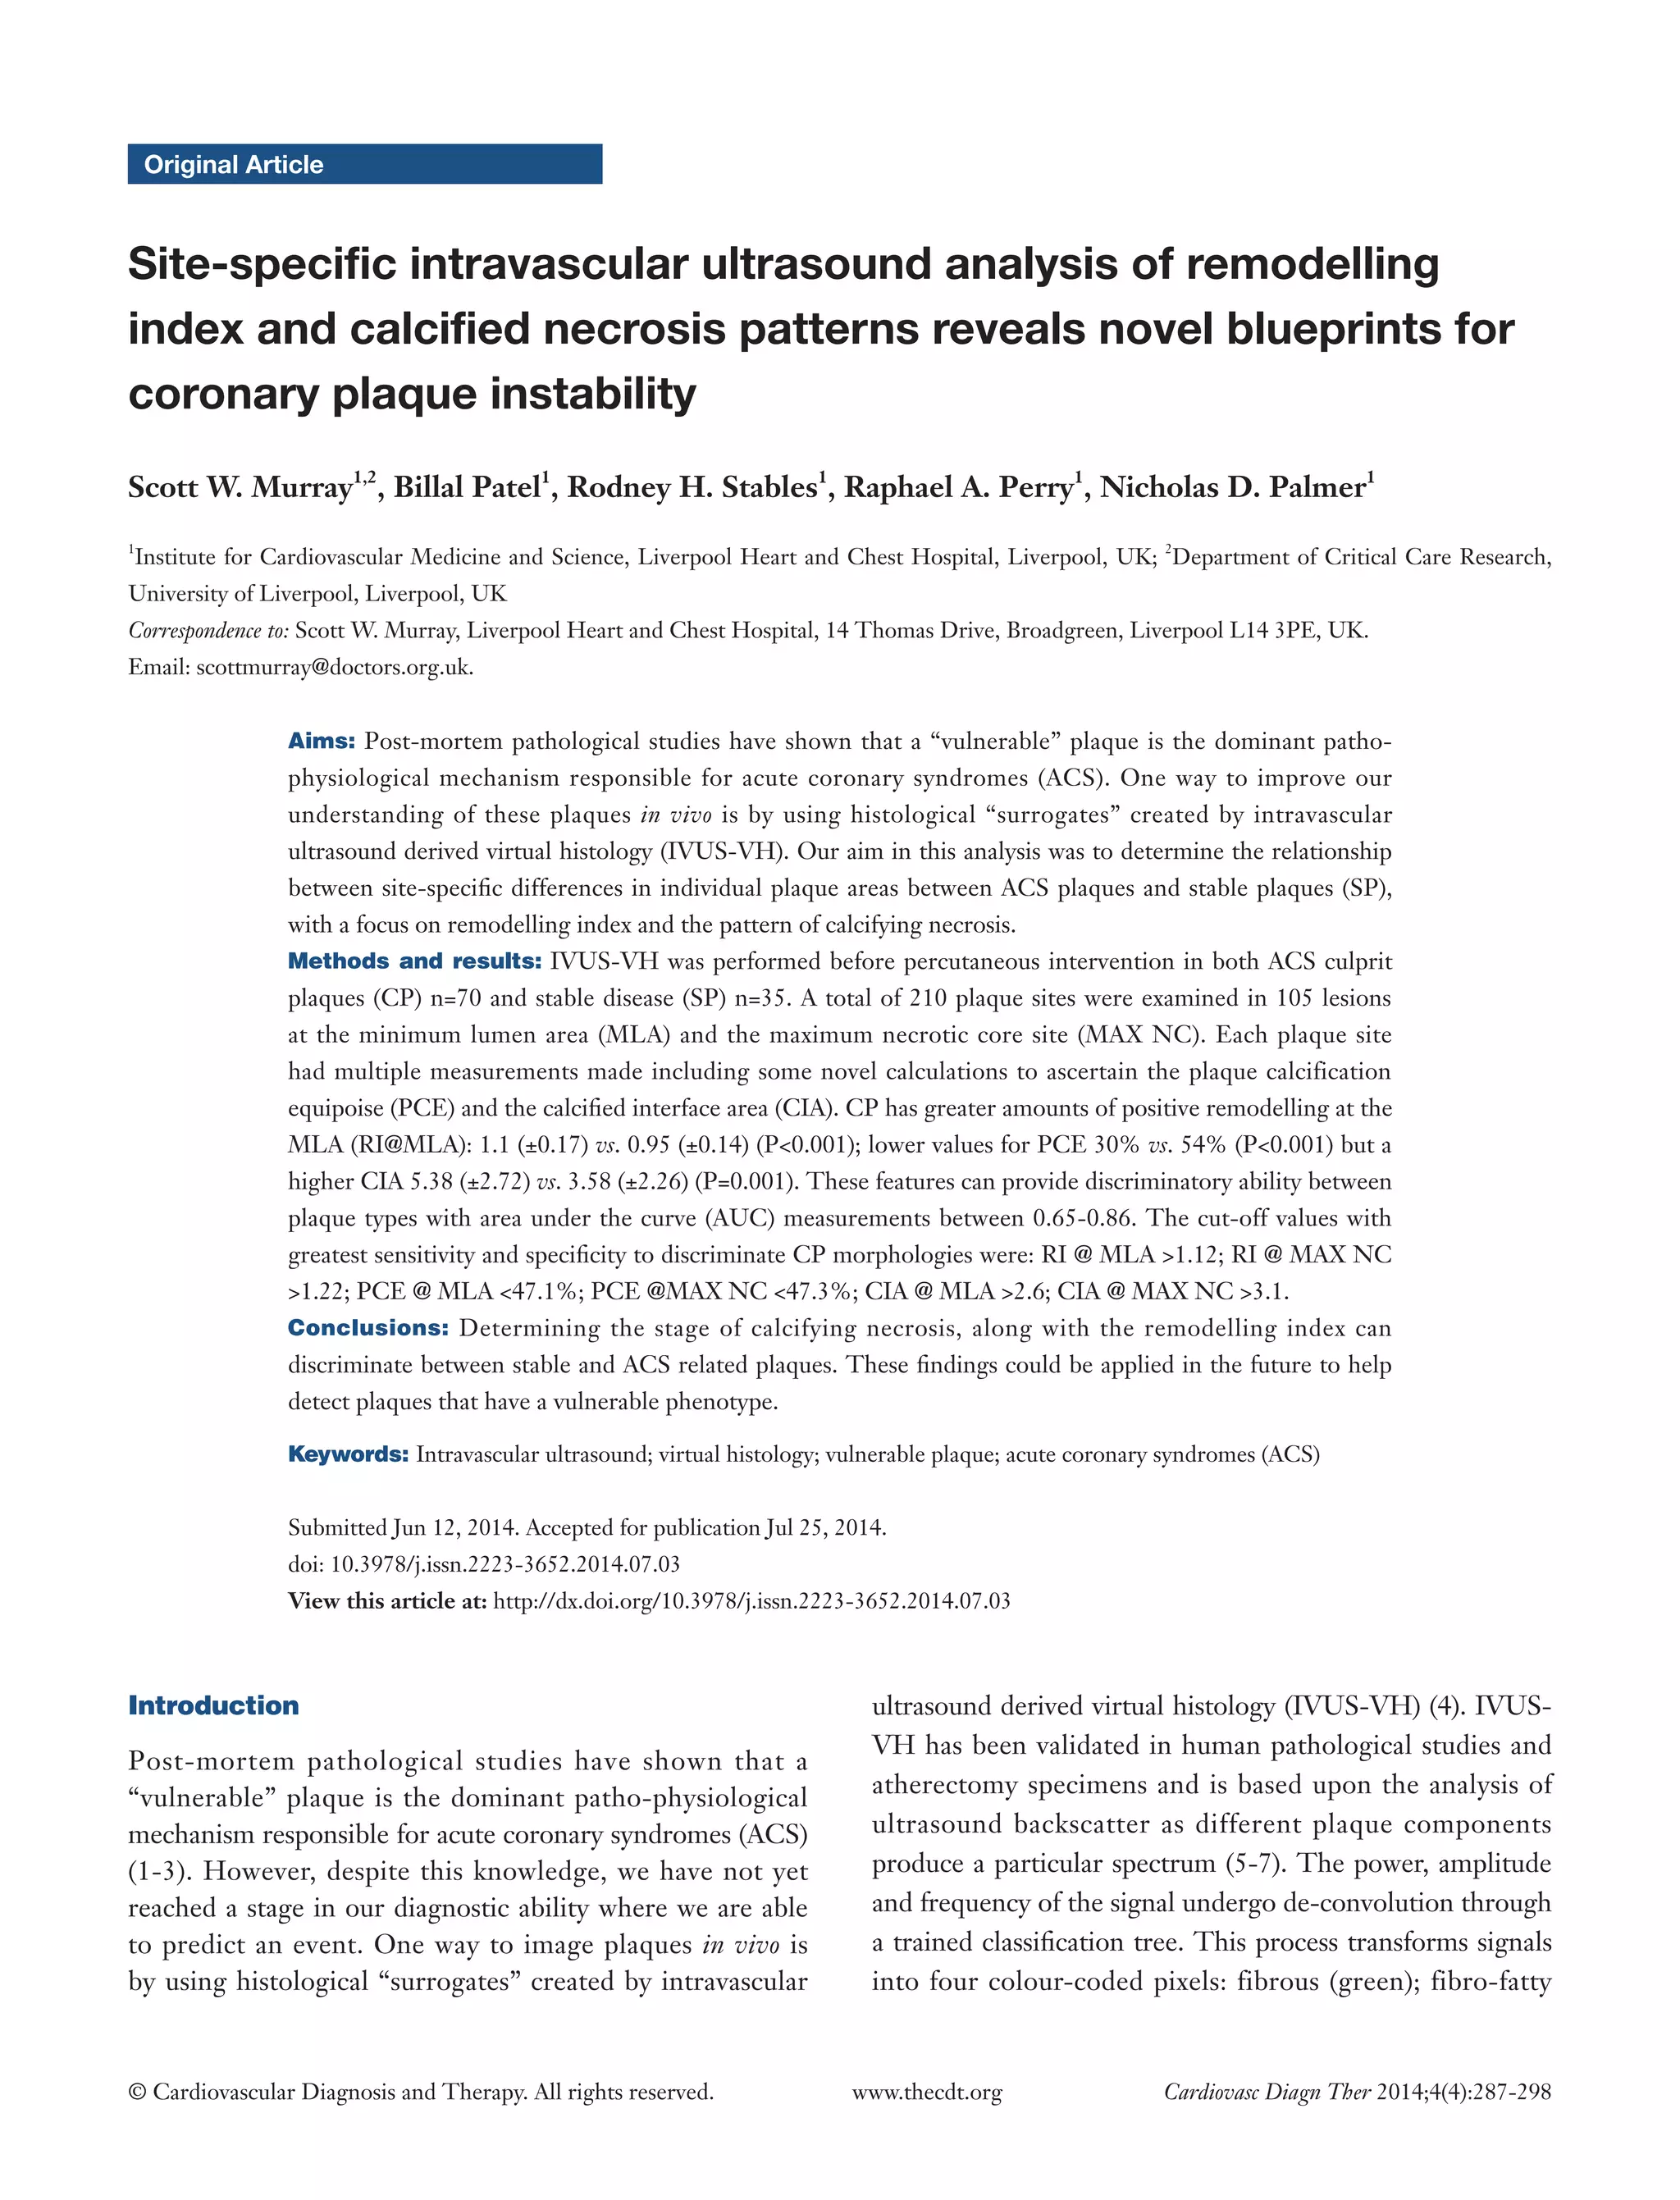
a total of n=210 separate plaque sites were analysed and measured. In general, more left anterior descending arteries were examined in the stable group with more right coronary and circumflex arteries being involved in the ACS group. More ACS patients had suffered a previous myocardial event. An overview of the focused IVUS and VH comparisons for each plaque type and site is present in Tables 2-5. Table 2 shows that in SP, despite the obvious differences in lumen area [MAX NC 6.04 (±2.97) vs. MLA 3.61 (±1.34) mm], there remains a substantial plaque burden at the MAX NC site (59%). Although plaque burden is somewhat greater at the MLA (68%), the lumen is preserved at the MAX NC site and this appears to be accommodated by a greater amount of positive remodelling [1.1 (±0.17) vs. 0.95 (±0.14)]. The MLA point of a stable plaque is more likely to display negative remodelling [RI 0.95 (±0.14)]. Also, each of these individual plaque sites appears to have similar values for basic NC/DC ratios [2.57 (±2.25) vs. 2.74 (±2.82), P=ns].
Table 2 Comparison of sites within a stable angina plaque (n=70)
Variables
Plaque at maximum
necrotic core site (MAX NC)
Plaque at minimum
lumen area site (MLA)
P value
Lumen area
6.04 (±2.97)
3.61 (±1.34)
<0.001
Plaque burden, %
59
68
0.004
NC/DC
2.57 (±2.25)
2.74 (±2.82)
0.79 (ns)
Remodelling index
1.1 (±0.17)
0.95 (±0.14)
<0.001
Calcium interface area (CIA)
3.58 (±2.26)
2.36 (±1.07)
0.005
Plaque calcification equipoise (PCE), %
54
56
0.68 (ns)
DC, dense calcium; ns, non significant.
Table 3 Comparison of sites within an ACS plaque (n=140)
Variables
Plaque at maximum
necrotic core site (MAX NC)
Plaque at minimum
lumen area site (MLA)
P value
Lumen area
5.93 (±2.67)
2.98 (±1.27)
<0.001
Plaque burden, %
66
79
<0.001
NC/DC
4.38 (±2.72)
3.46 (±3.48)
0.08 (ns)
Remodelling index
1.34 (±0.18)
1.20 (±0.13)
<0.001
Calcium interface area (CIA)
5.38 (±2.72)
4.33 (±3.61)
0.001
Plaque calcification equipoise (PCE), %
30
43
0.004
ACS, acute coronary syndromes; DC, dense calcium; ns, non significant.
Table 4 Comparison of MAX NC site in both stable and ACS plaques (n=105)
Variables
Plaque at maximum necrotic
core site (MAX NC)—stable
Plaque at maximum necrotic core site (MAX NC)—ACS
P value
Lumen area
6.04 (±2.97)
5.93 (±2.67)
0.85
Plaque burden, %
59
66
0.012
NC/DC
2.57 (±2.25)
4.38 (±2.72)
<0.001
Remodelling index
1.1 (±0.17)
1.34 (±0.18)
<0.001
Calcium interface area (CIA)
3.58 (±2.26)
5.38 (±2.72)
0.001
Plaque calcification equipoise (PCE), %
54
30
<0.001
ACS, acute coronary syndromes; DC, dense calcium.](https://image.slidesharecdn.com/ivuscdt-04-04-287-140917113118-phpapp02/75/Site-specific-intravascular-ultrasound-analysis-of-remodelling-index-and-calcified-necrosis-patterns-reveals-novel-blueprints-for-coronary-plaque-instability-4-2048.jpg)
![Cardiovascular Diagnosis and Therapy, Vol 4, No 4 August 2014 291
© Cardiovascular Diagnosis and Therapy. All rights reserved. www.thecdt.org Cardiovasc Diagn Ther 2014;4(4):287-298
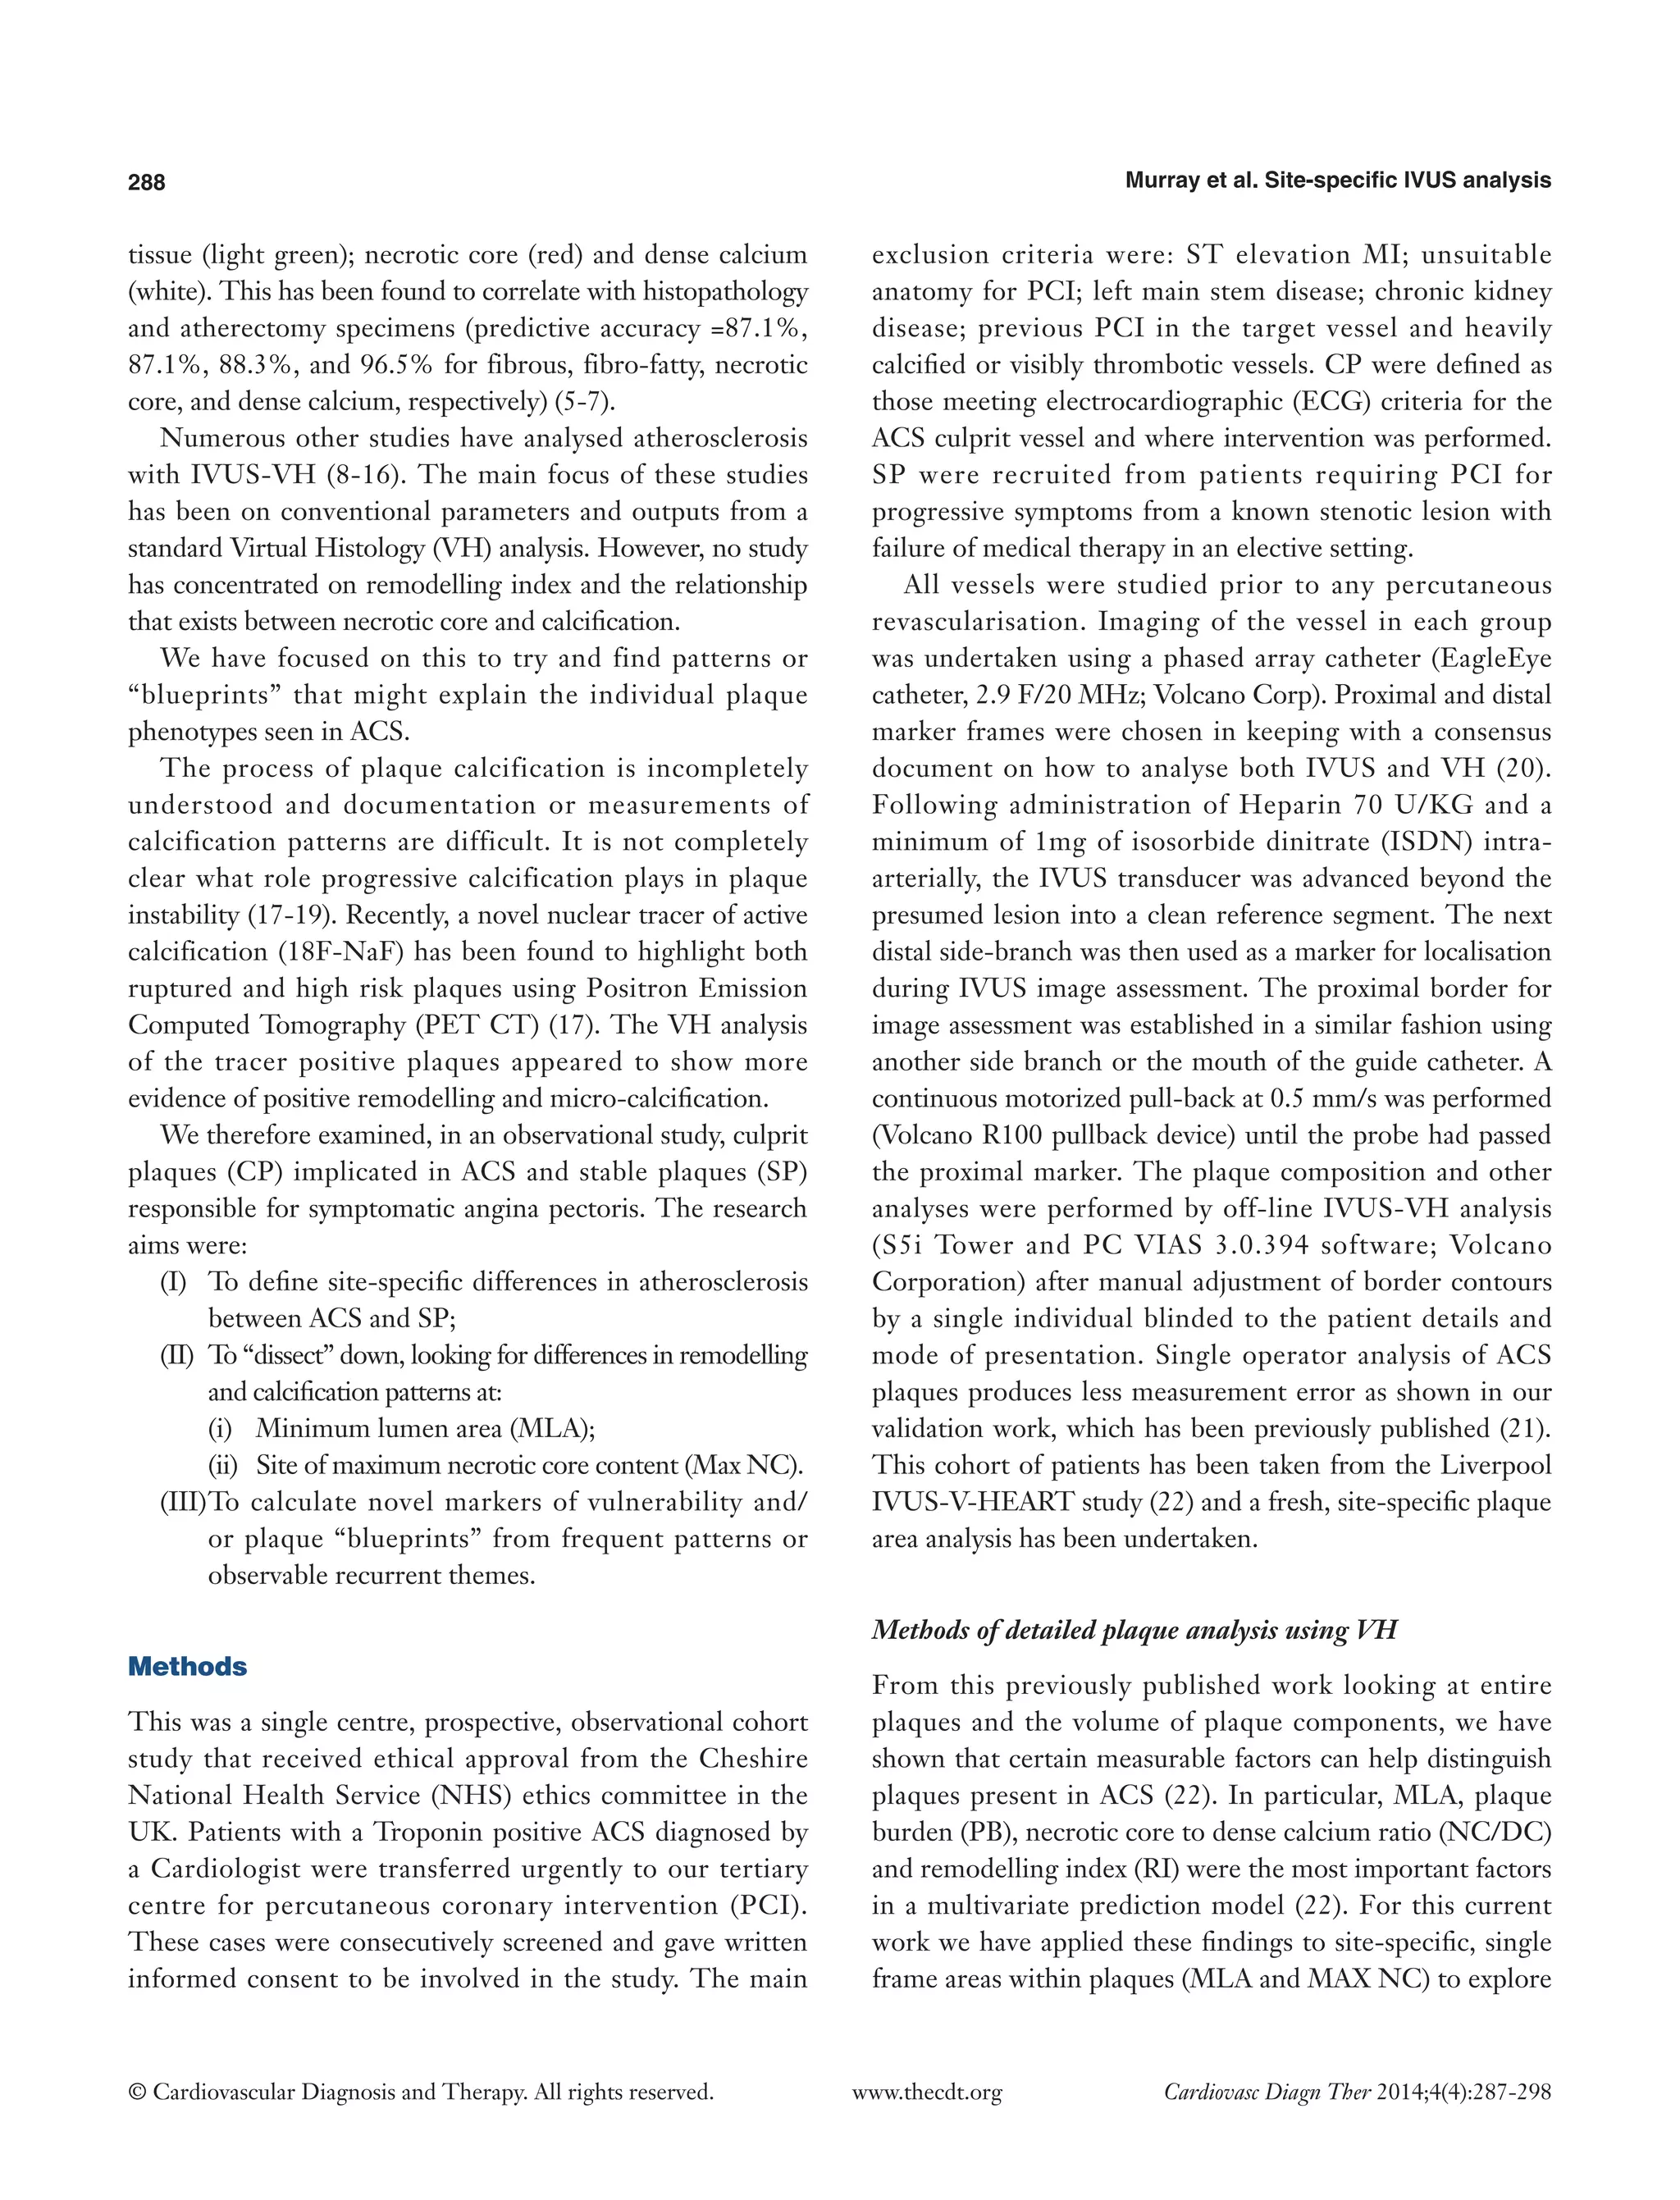
However, the actual pattern of calcification differs at the MAX NC site, having a greater CIA [MAX NC 3.58 (±2.26) vs. MLA 2.36 (±1.07), P<0.001]. Table 3 shows the results for ACS CP and interestingly a similar pattern emerges. However, these plaques appear to have less calcification overall and greater amounts of positive remodelling both at the MLA and MAX NC site, when compared to stable plaque disease. Moreover, the MAX NC site within a culprit plaque has the greatest amount of positive remodelling across all the plaque types [RI 1.20 (±0.13) vs. 1.34 (±0.18), P<0.001].
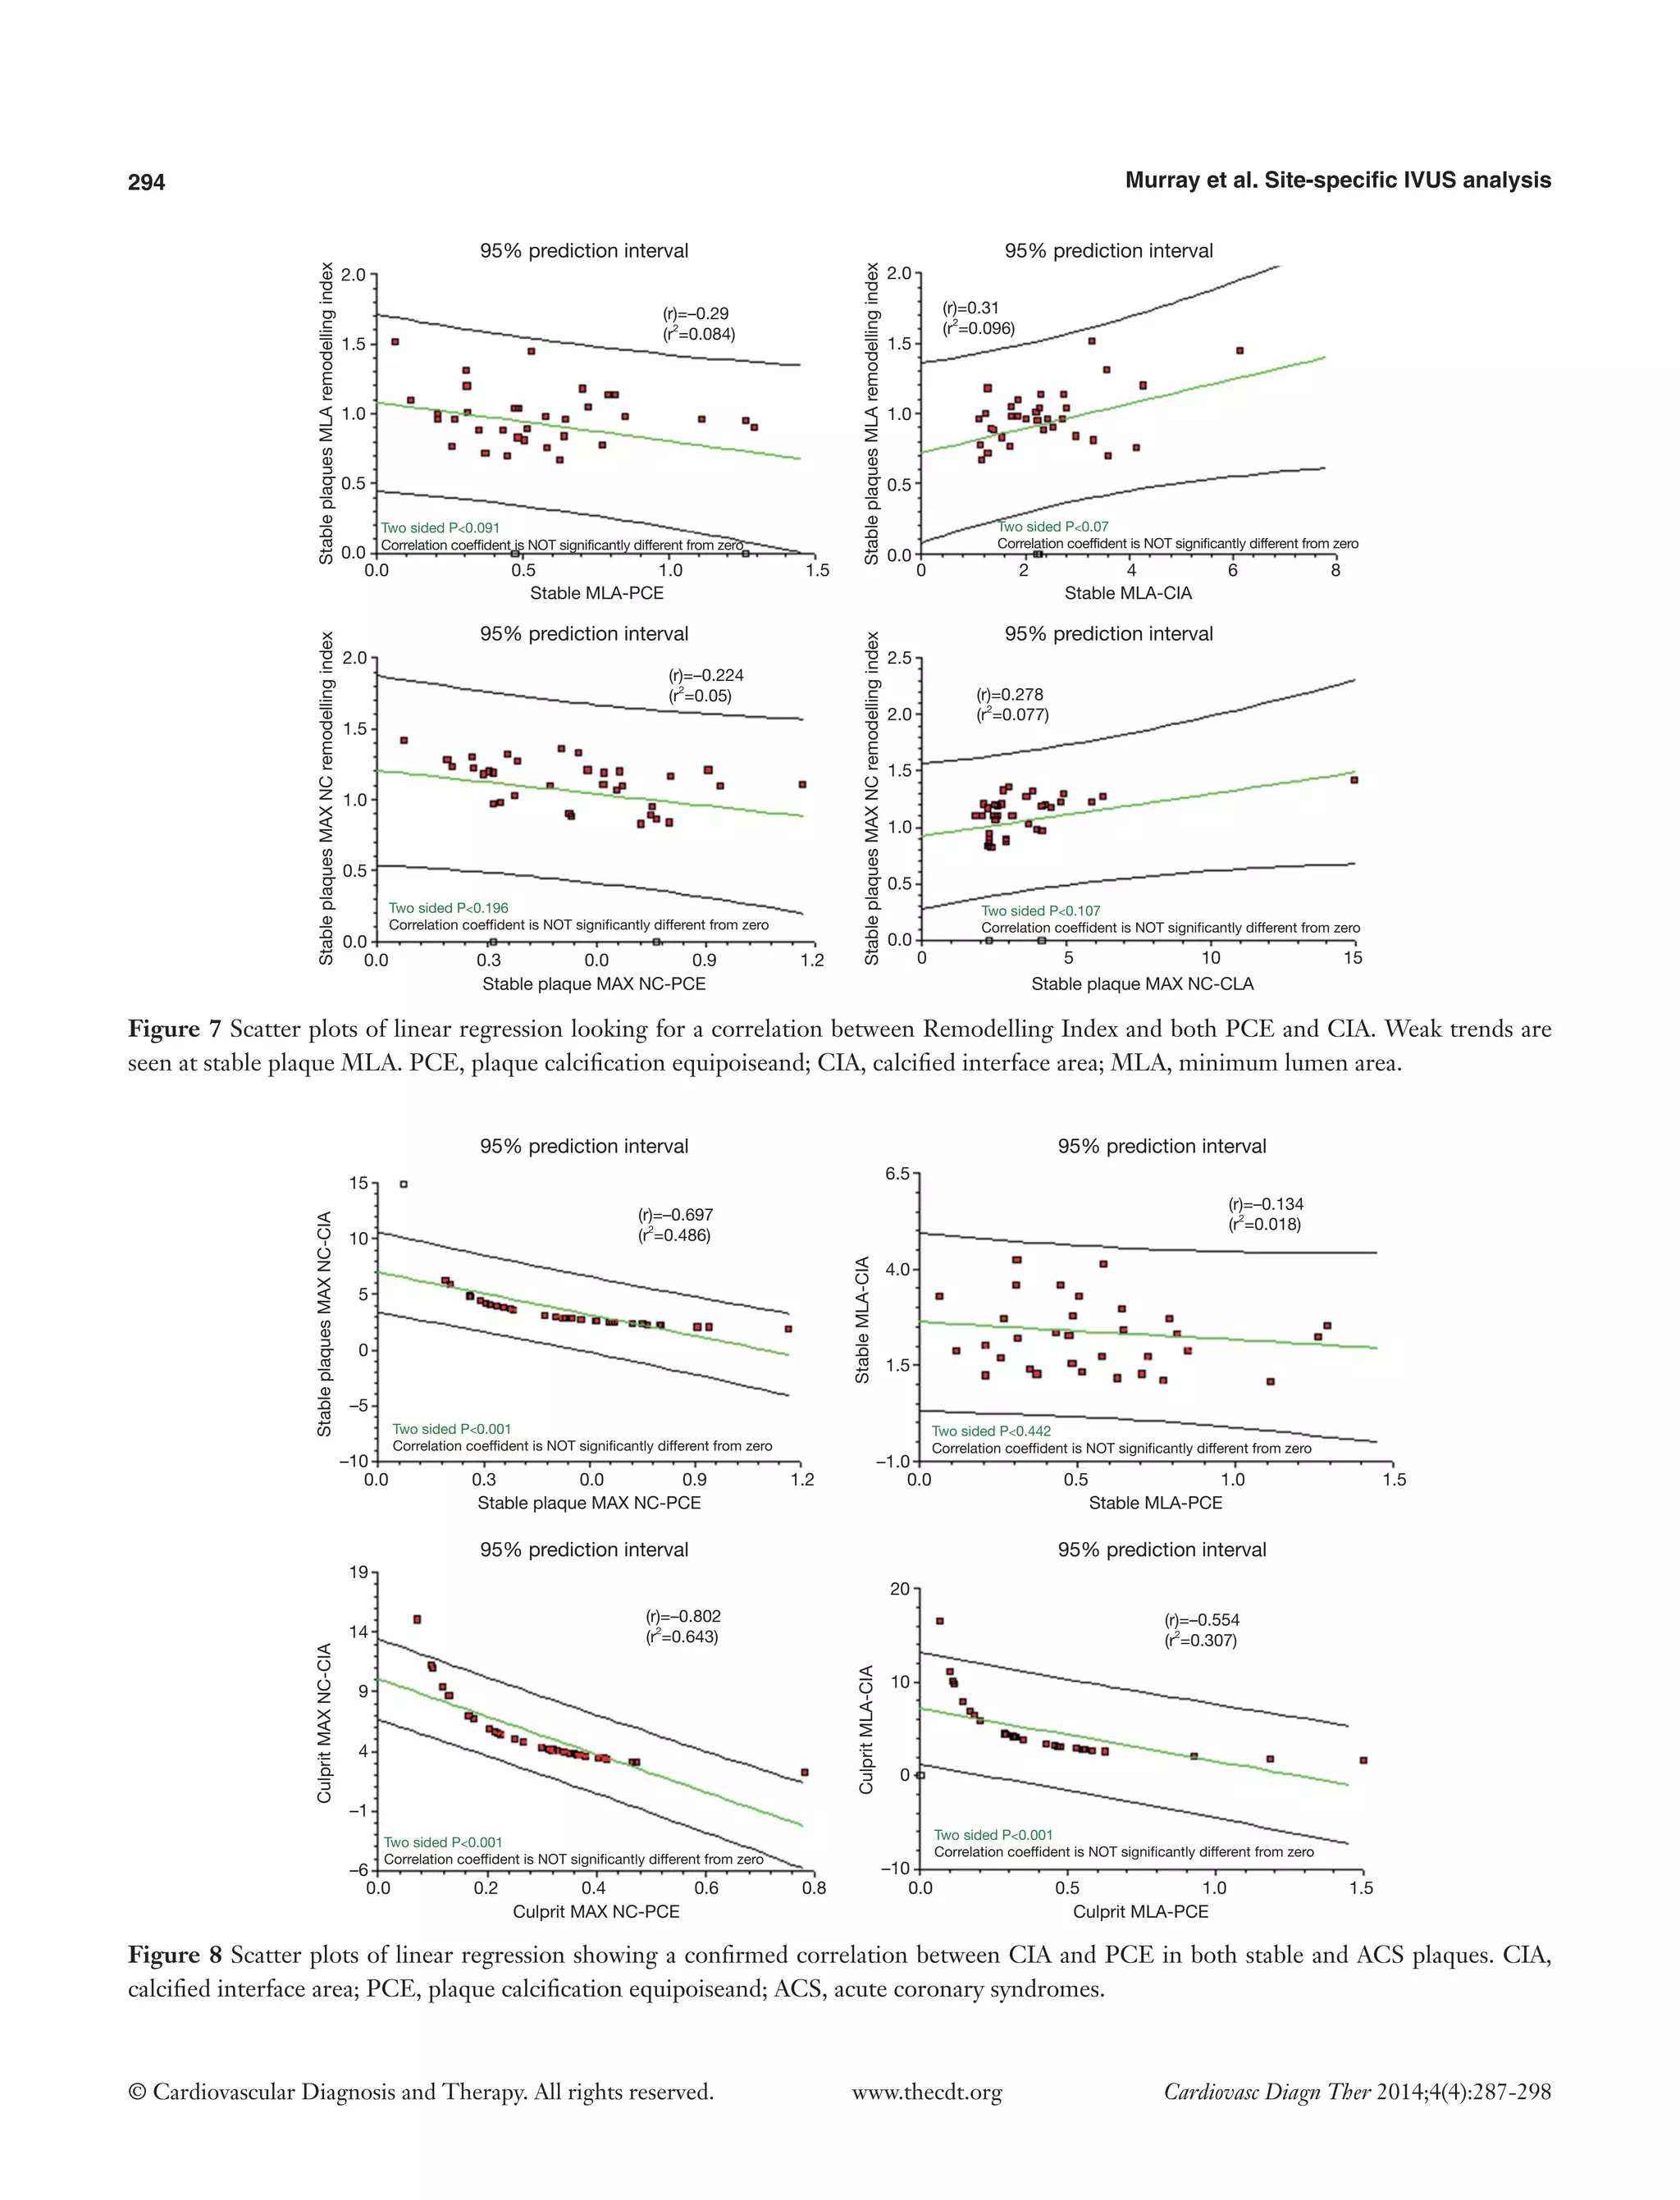
On direct comparison between CP and SP at these specific points in the plaque (Tables 4 and 5) we can again observe important statistical differences. These results, demonstrated visually in Figure 1, explain the intricate pathological changes that are seen in plaques, at different stages of atherosclerosis. Graphical explanations of the results (as an aid to comprehension) are displayed in Figures 2-4.
Table 5 Comparison of MLA site in both stable and ACS plaques (n=105)
Variables
Plaque at maximum necrotic
core site (MAX NC)—stable
Plaque at maximum
necrotic core site (MAX NC)—ACS
P value
Lumen area
3.61 (±1.34)
2.98 (±1.27)
0.021
Plaque burden, %
68
79
<0.001
NC/DC
2.74 (±2.82)
3.46 (±3.48)
0.26
Remodelling index
0.95 (±0.14)
1.20 (±0.13)
<0.001
Calcium interface area (CIA)
2.36 (±1.07)
4.33 (±3.61)
<0.001
Plaque calcification equipoise (PCE) %
56
43
0.068
ACS, acute coronary syndromes; DC, dense calcium; ns, non significant.
Figure 1 Virtual Histology evolution of plaque from primitive necrosis and spotty calcium through to calcium arcs. Each stage shows values for NC/DC ratio. PCE, plaque calcification equipoiseand; CIA, calcified interface area; NC/DC, necrotic core to dense calcium ratio.
NC 2.1 mm2
NC 2.2 mm2
NC 1.5 mm2
NC 2.8 mm2
DC 0.6 mm2
NC/DC 3.5; PCE=29%; CIA=4.5
NC/DC 1.1; PCE=90%; CIA=2.1
NC/DC 0.9; PCE=113%; CIA=1.88
NC/DC 1.5; PCE=64%; CIA=3.8
DC 1.8 mm2
DC 1.7 mm2
DC 2.0 mm2](https://image.slidesharecdn.com/ivuscdt-04-04-287-140917113118-phpapp02/75/Site-specific-intravascular-ultrasound-analysis-of-remodelling-index-and-calcified-necrosis-patterns-reveals-novel-blueprints-for-coronary-plaque-instability-5-2048.jpg)
![Cardiovascular Diagnosis and Therapy, Vol 4, No 4 August 2014 297
© Cardiovascular Diagnosis and Therapy. All rights reserved. www.thecdt.org Cardiovasc Diagn Ther 2014;4(4):287-298
data analysis. J Am Coll Cardiol 2005;46:2038-42.
8. Calvert PA, Obaid DR, O’Sullivan M, et al. Association between IVUS findings and adverse outcomes in patients with coronary artery disease: the VIVA (VH-IVUS in Vulnerable Atherosclerosis) Study. JACC Cardiovasc Imaging 2011;4:894-901.
9. Stone GW, Maehara A, Lansky AJ, et al. A prospective natural-history study of coronary atherosclerosis, N Engl J Med 364 2011 226-35.
10. García-García HM, Goedhart D, Schuurbiers JC, et al. Virtual histology and remodelling index allow in vivo identification of allegedly high-risk coronary plaques in patients with acute coronary syndromes: a three vessel intravascular ultrasound radiofrequency data analysis. EuroIntervention 2006;2:338-44.
11. Hong MK, Mintz GS, Lee CW, et al. Comparison of virtual histology to intravascular ultrasound of culprit coronary lesions in acute coronary syndrome and target coronary lesions in stable angina pectoris. Am J Cardiol 2007;100:953-9.
12. Hong MK, Mintz GS, Lee CW, et al. A three-vessel virtual histology intravascular ultrasound analysis of frequency and distribution of thin-cap fibroatheromas in patients with acute coronary syndrome or stable angina pectoris. Am J Cardiol 2008;101:568-72.
13. Qian J, Maehara A, Mintz GS, et al. Relation between individual plaque components and overall plaque burden in the prospective, multicenter virtual histology intravascular ultrasound registry. Am J Cardiol 2009;104:501-6.
14. Rodriguez-Granillo GA, McFadden EP, Valgimigli M, et al. Coronary plaque composition of nonculprit lesions, assessed by in vivo intracoronary ultrasound radio frequency data analysis, is related to clinical presentation. Am Heart J 2006;151:1020-4.
15. Surmely JF, Nasu K, Fujita H, et al. Coronary plaque composition of culprit/target lesions according to the clinical presentation: a virtual histology intravascular ultrasound analysis. Eur Heart J 2006;27:2939-44.
16. Nakamura T, Kubo N, Funayama H, et al. Plaque characteristics of the coronary segment proximal to the culprit lesion in stable and unstable patients. Clin Cardiol 2009;32:E9-12.
17. Joshi NV, Vesey AT, Williams MC, et al. 18F-fluoride positron emission tomography for identification of ruptured and high-risk coronary atherosclerotic plaques: a prospective clinical trial. Lancet 2014;383:705-13.
18. Ehara S, Kobayashi Y, Yoshiyama M, et al. Spotty calcification typifies the culprit plaque in patients with acute myocardial infarction: an intravascular ultrasound study. Circulation 2004;110:3424-9.
19. Fujii K, Carlier SG, Mintz GS, et al. Intravascular ultrasound study of patterns of calcium in ruptured coronary plaques. Am J Cardiol 2005;96:352-7.
20. García-García HM, Mintz GS, Lerman A, et al. Tissue characterisation using intravascular radiofrequency data analysis: recommendations for acquisition, analysis, interpretation and reporting. EuroIntervention 2009;5:177-89.
21. Murray SW, Stables RH, Hart G, et al. Defining the magnitude of measurement variability in the virtual histology analysis of acute coronary syndrome plaques. Eur Heart J Cardiovasc Imaging 2013;14:167-74.
22. Murray SW, Stables RH, Garcia-Garcia HM, et al. Construction and validation of a plaque discrimination score from the anatomical and histological differences in coronary atherosclerosis: the Liverpool IVUS-V- HEART (Intra Vascular UltraSound-Virtual-Histology Evaluation of Atherosclerosis Requiring Treatment) study. EuroIntervention 2014. [Epub ahead of print].
23. Missel E, Mintz GS, Carlier SG, et al. Necrotic Core and its Ratio to dense calcium are predictors of high-risk non ST elevation acute coronary syndromes. Am J Cardiol 2008;101:573-8.
24. Missel E, Mintz GS, Carlier SG, et al. In vivo virtual histology intravascular ultrasound correlates of risk factors for sudden coronary death in men: results from the prospective, multi-centre virtual histology intravascular ultrasound registry. Eur Heart J 2008;29:2141-7.
25. Maehara A, Mintz GS, Bui AB, et al. Morphologic and angiographic features of coronary plaque rupture detected by intravascular ultrasound. J Am Coll Cardiol 2002;40:904-10.
26. Beckman JA, Ganz J, Creager MA, et al. Relationship of clinical presentation and calcification of culprit coronary artery stenoses. Arterioscler Thromb Vasc Biol 2001;21:1618-22.
27. Obaid DR, Calvert PA, McNab D, et al. Identification of coronary plaque sub-types using virtual histology intravascular ultrasound is affected by inter-observer variability and differences in plaque definitions. Circ Cardiovasc Imaging 2012;5:86-93.
28. Hoshino T, Chow LA, Hsu JJ, et al. Mechanical stress analysis of a rigid inclusion in distensible material: a model of atherosclerotic calcification and plaque vulnerability Am J Physiol Heart Circ Physiol 2009;297:H802-10.
29. Vengrenyuk Y, Carlier S, Xanthos S, et al. A hypothesis for](https://image.slidesharecdn.com/ivuscdt-04-04-287-140917113118-phpapp02/75/Site-specific-intravascular-ultrasound-analysis-of-remodelling-index-and-calcified-necrosis-patterns-reveals-novel-blueprints-for-coronary-plaque-instability-11-2048.jpg)

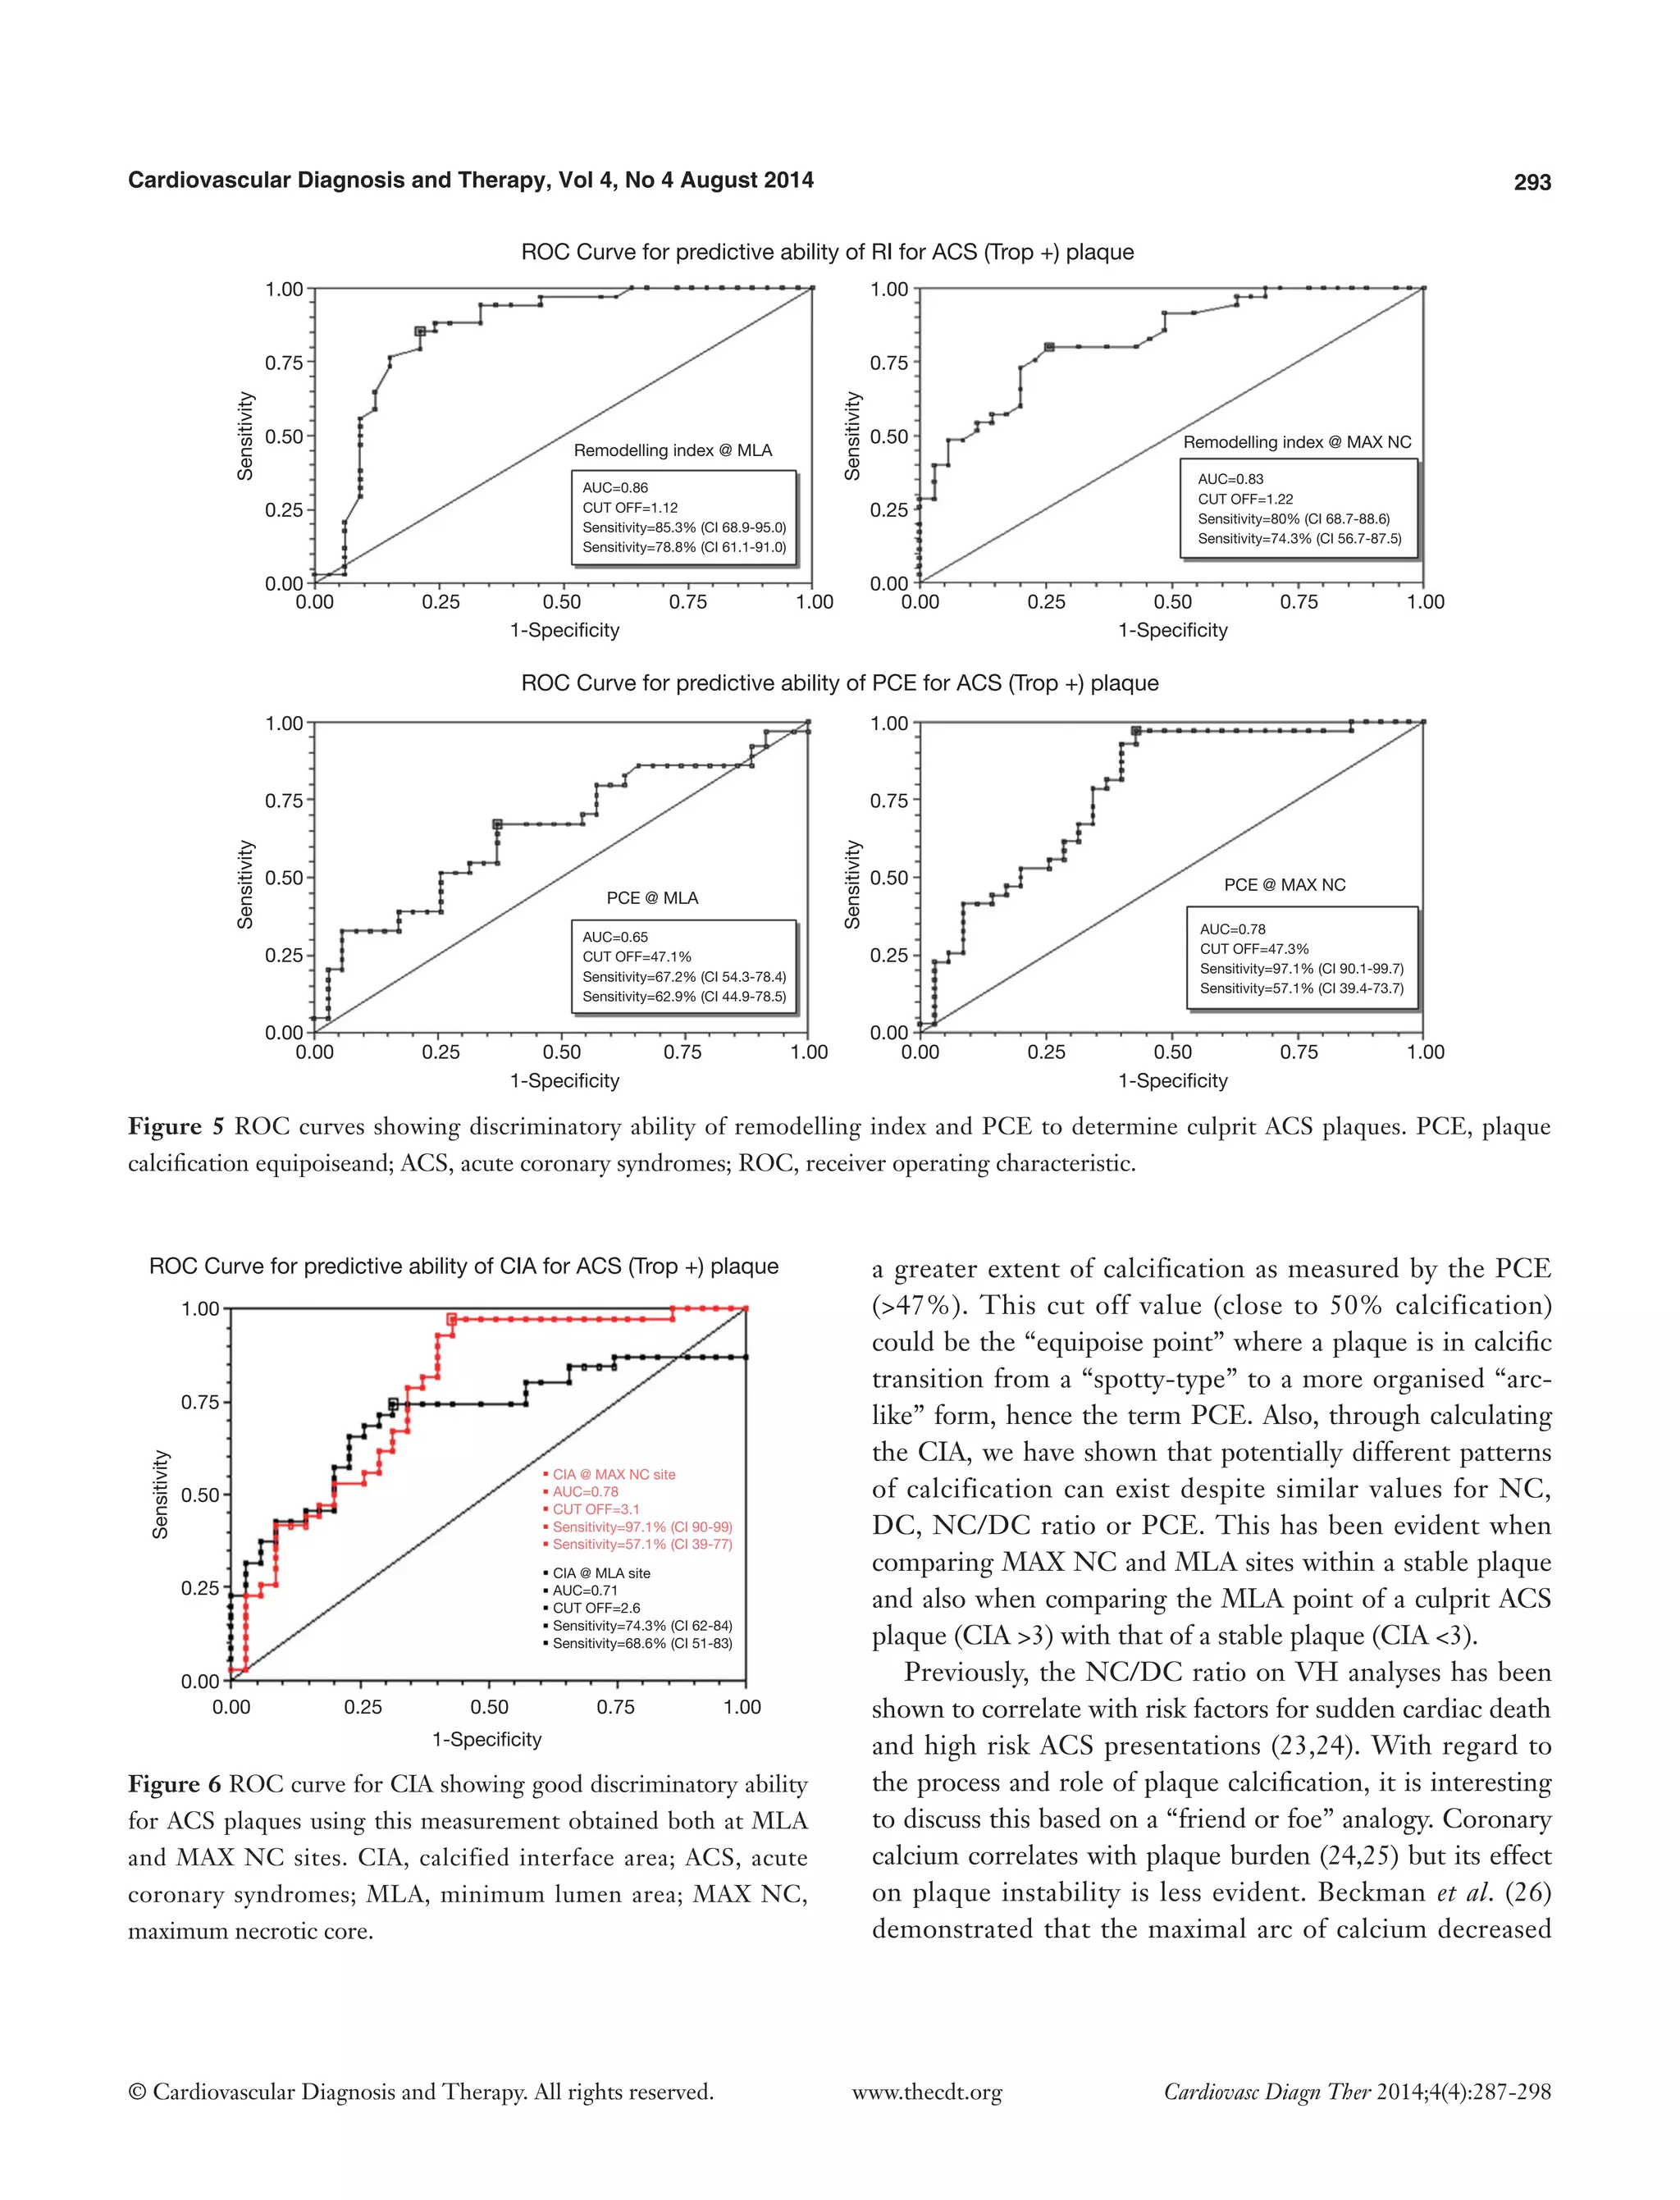
This study utilizes intravascular ultrasound-derived virtual histology (IVUS-VH) to analyze the differences in plaque characteristics between acute coronary syndrome (ACS) culprit plaques and stable plaques, focusing on features such as remodeling index, necrotic core patterns, and calcification. Results indicate that ACS plaques exhibit greater positive remodeling and higher calcified interface area compared to stable plaques, providing potential novel markers to differentiate plaque vulnerability. The findings aim to enhance understanding and detection of plaques at risk of instability, supporting improved diagnostic and therapeutic strategies.


