Downloaded 47 times


![39
Measuring the Information Society 2012
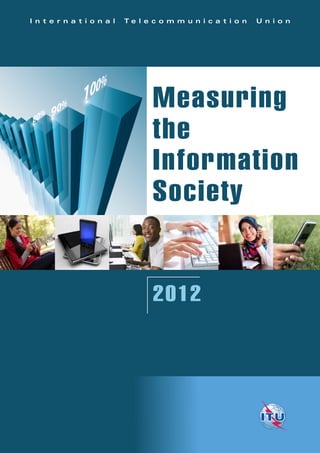
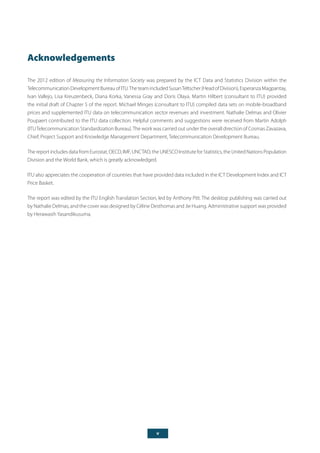
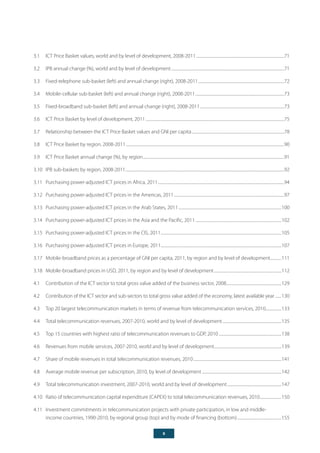
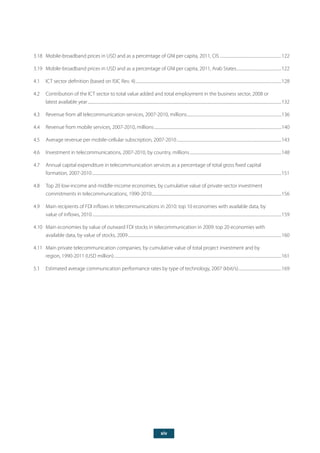
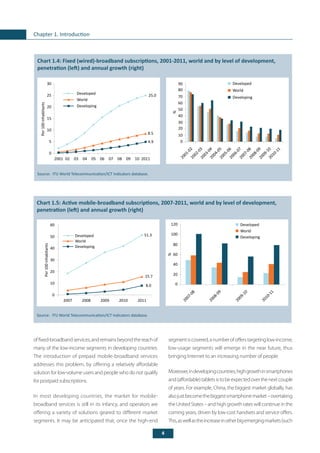
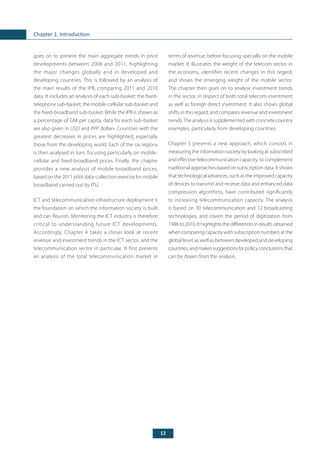
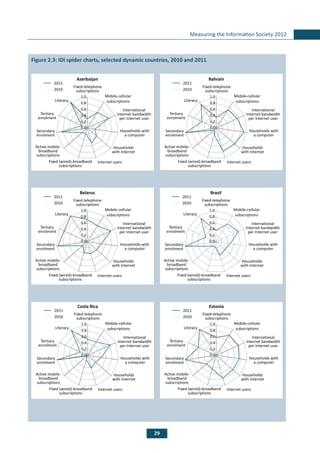
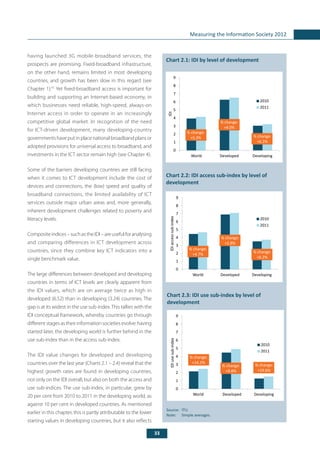
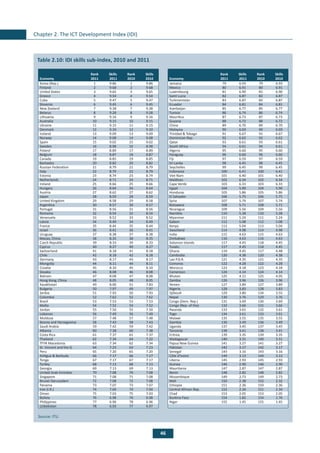
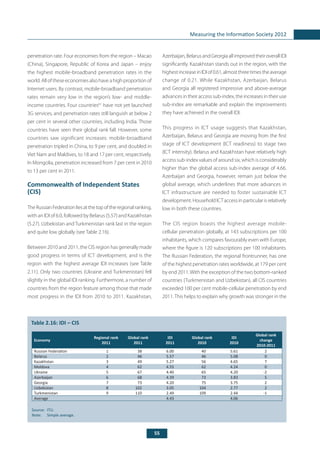
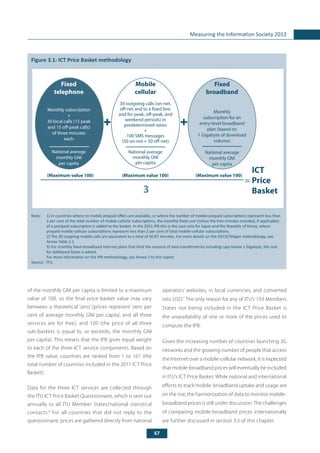
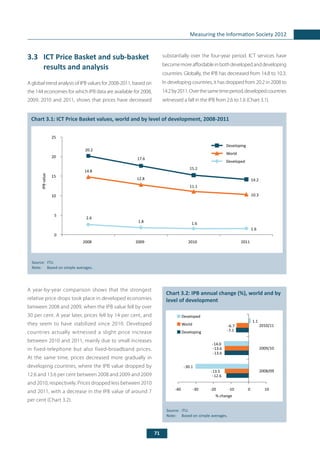
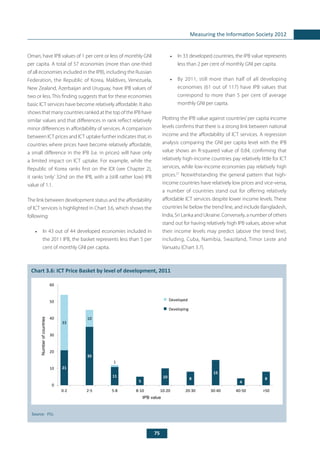
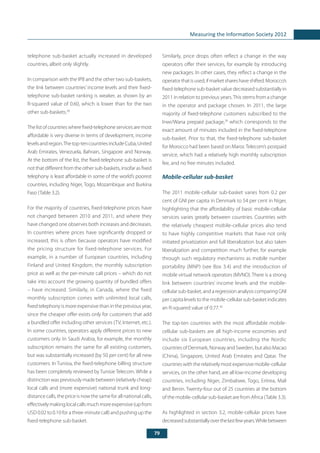
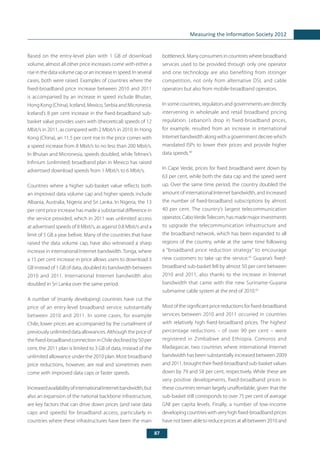
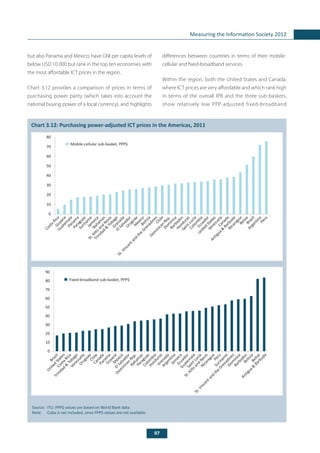
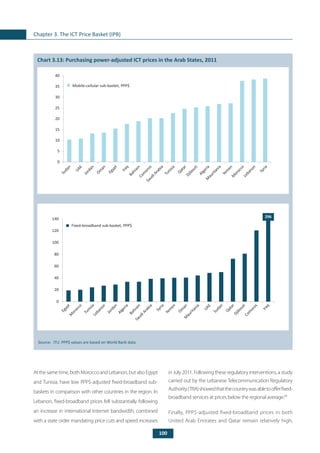
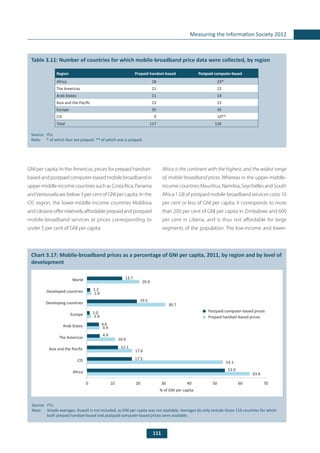
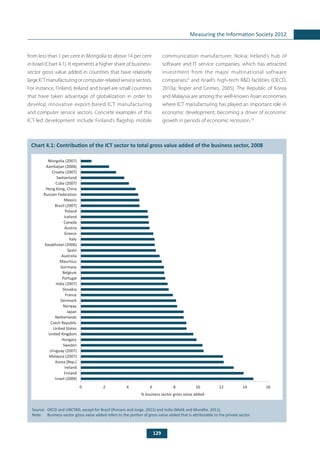
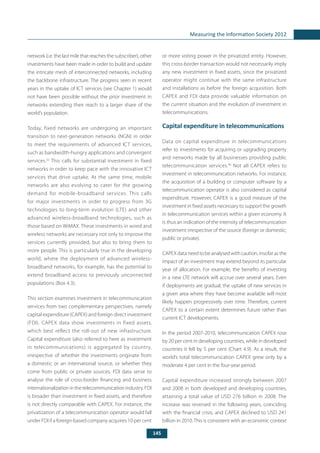
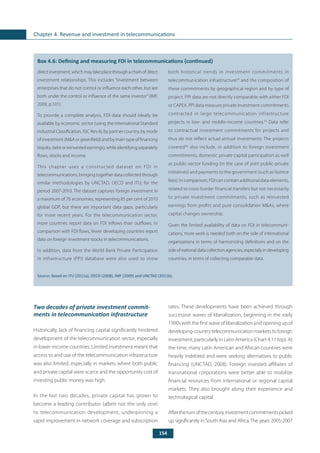
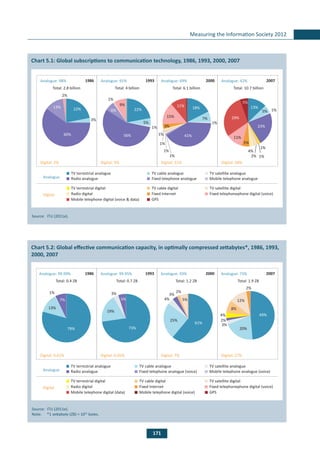
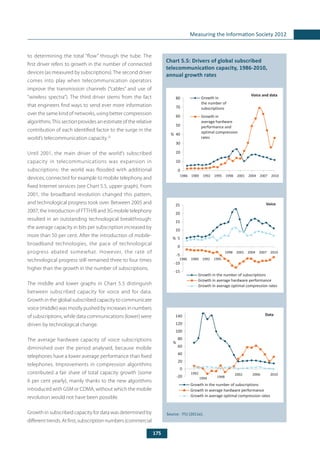
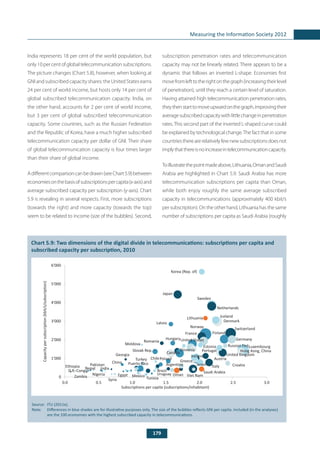
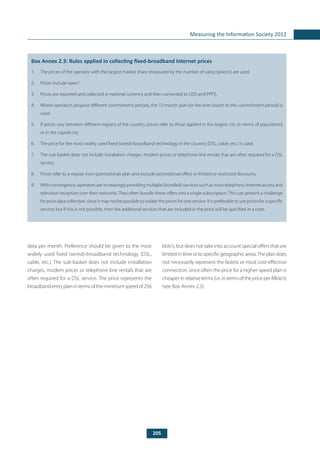
Box 2.5: Hong Kong (China): Asia and the Pacific’s high-density, high-speed broadband hub
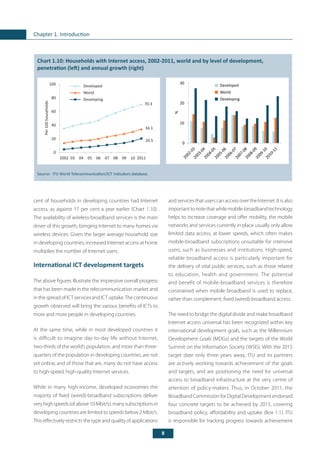
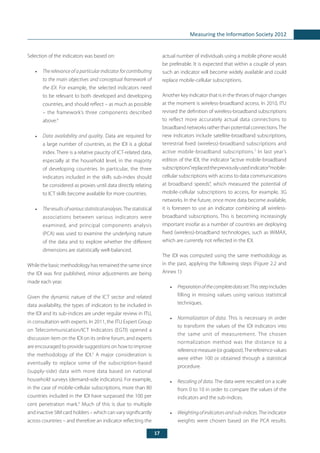
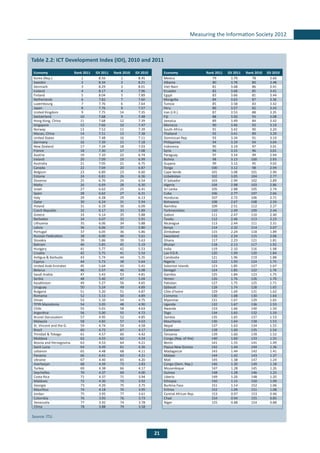
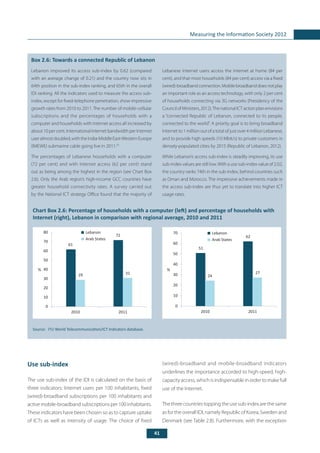
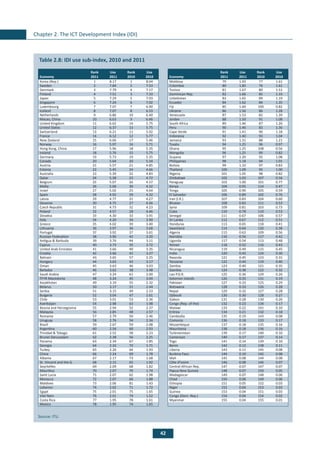
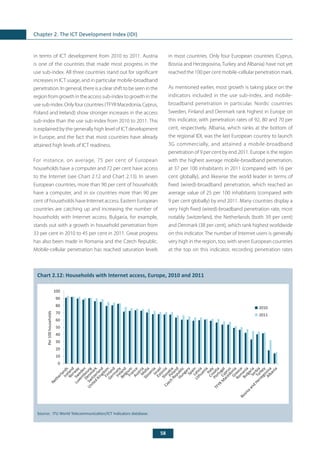
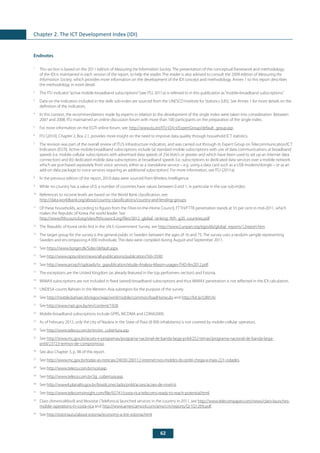
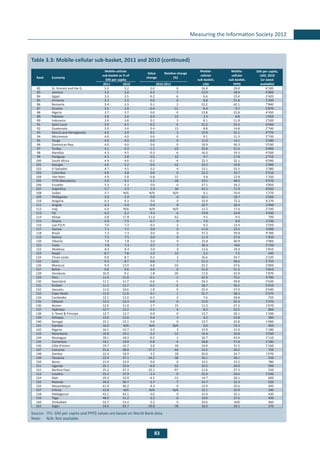
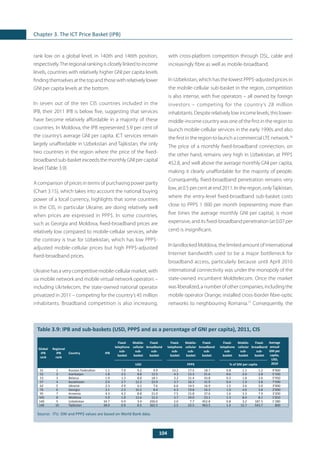
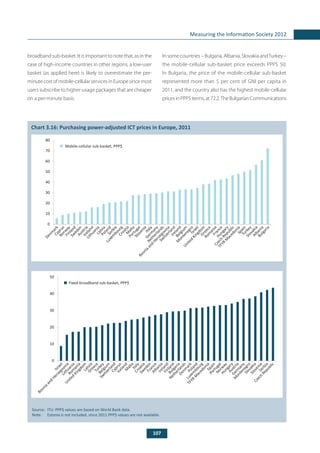
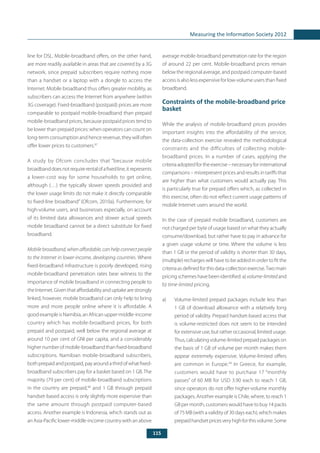
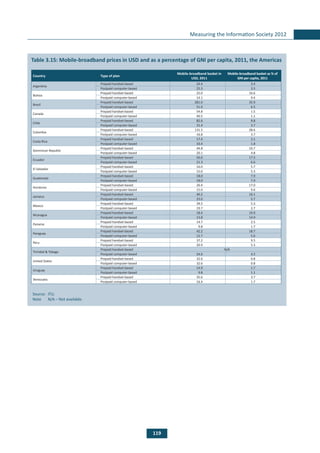
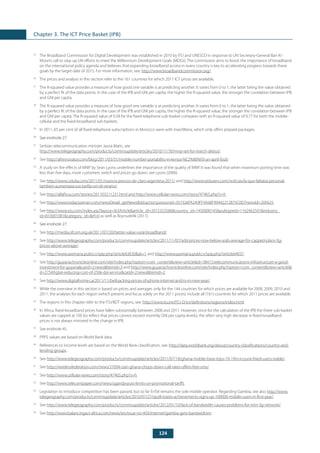
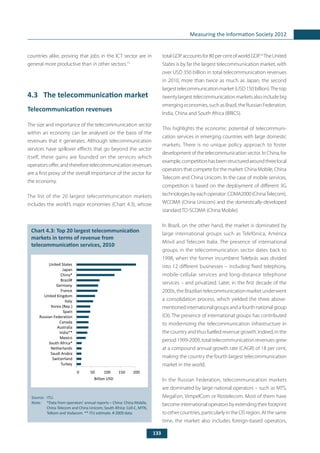
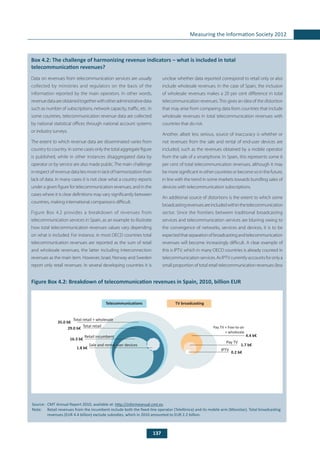
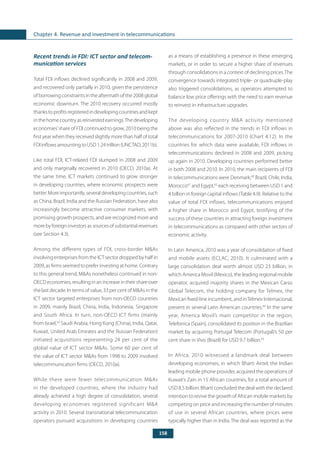
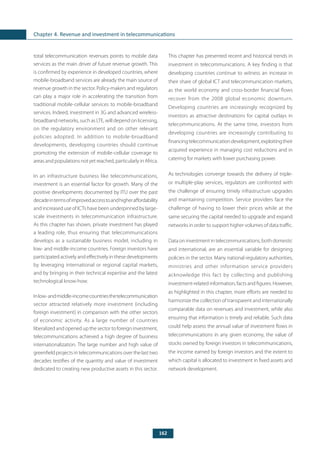
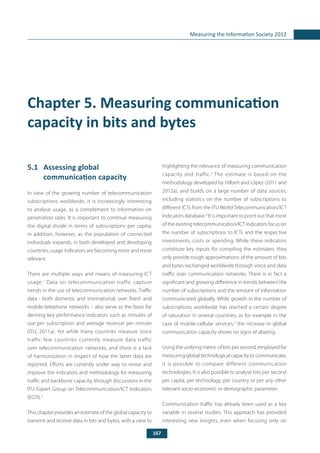
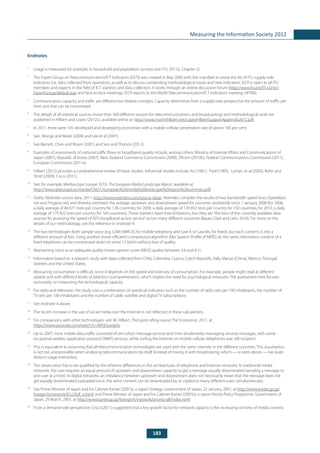
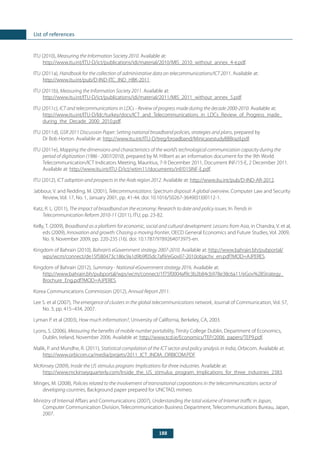
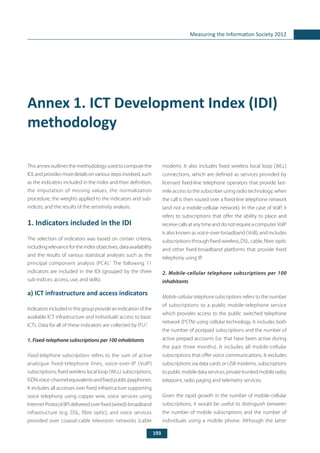
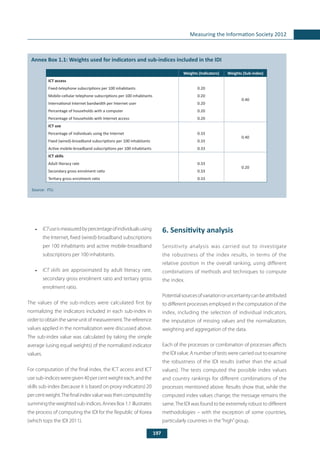
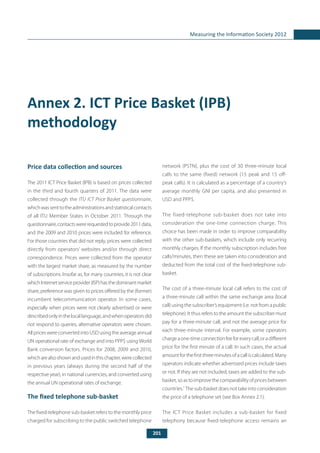
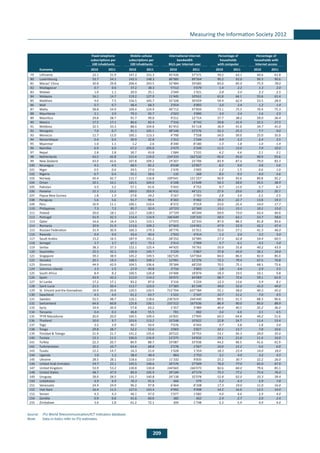
For the second year in a row, Hong Kong (China) ranks first
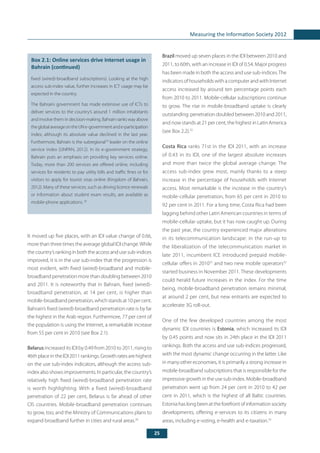
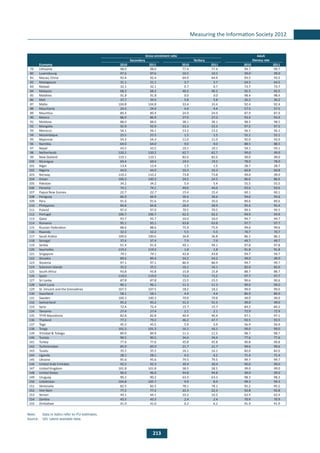
in the access sub-index, with an impressive value of 9.21.
Its international Internet bandwidth per Internet user is
the highest of all economies included in the IDI (see Chart
Box 2.5). Hong Kong (China)’s regulator has made it a policy
priority to attract new submarine cables.46
The city state
already stands out in international comparison and is poised
to hold onto its outstanding position with the landing of a
tenth submarine cable, the Asia Submarine-cable Express
(ASE), by end 2012. According to OFCA, the landing of ACE
“will further strengthen our [Hong Kong (China)’s] position
as the telecommunications and Internet hub in the Asia
Pacific region”.47
Broadband infrastructure does not stop at
the landing stations. According to OFCA, fibre-to-the-home/
building household penetration stood at 45 per cent in
February 2012.48
Even though this already represents one of
the highest rates worldwide, further measures are being taken
to increase penetration. A registration scheme for residential
buildings was started in late 2010 to take stock of buildings
connected, in combination with a promotional campaign to
further increase public awareness of FTTH.49
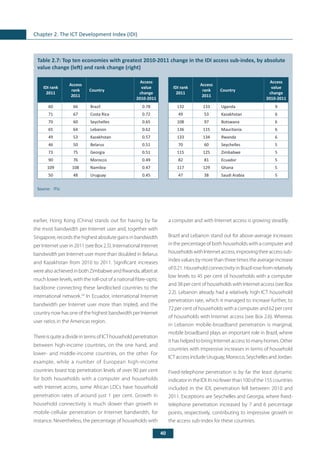
A highly developed broadband infrastructure, low prices and a
high level of competition (185 ISPs were licensed as of February
2012) resulted in a fixed (wired)-broadband penetration of 32
per cent in 2011, one of the highest rates worldwide. Mobile-
broadband penetration has seen impressive growth, from 39
per cent in 2010 to 52 per cent in 2011. The city state is home
to four 3G operators employing a variety of mobile-broadband
technologies(includingHSDPA,HSPA+andW-CDMA).LTEisbeing
graduallydeployedbythreeoperators,whichwillfurtherincrease
the speed and quality of mobile-broadband services.50
In order
to sustain market growth, OFCA works with mobile-broadband
operators to publish service performance statistics “covering
aspects related to network reliability, service restoration time,
customer hotline performance, customer complaint handling
andtechnicalperformance.”51
Furthermore,theOFCABroadband
Performance Test has been developed, allowing customers to
measurefixed-andmobile-broadbandperformanceandspeeds.52
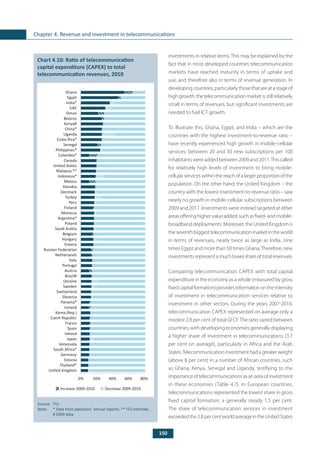
Chart Box 2.5: International Internet bandwidth
per Internet user, top five economies for this
indicator, 2010 and 2011
Source: ITU World Telecommunication/ICT Indicators database.
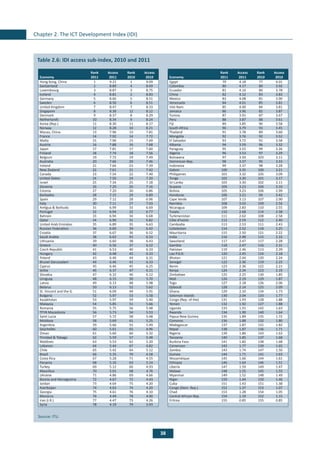
The most dynamic countries in terms of the access sub-
index are all developing countries (with the exception of
Belarus), many ranked low in the IDI. Most notably, the top
ten most dynamic countries in terms of the access sub-
index include the African LDCs Uganda and Rwanda, as well
as the Arab LDC Mauritania. Whereas top IDI performers
already have a highly developed ICT infrastructure, many
developing countries are building and enhancing ICT
readiness, which will eventually also lead to increases in
ICT use and impact.
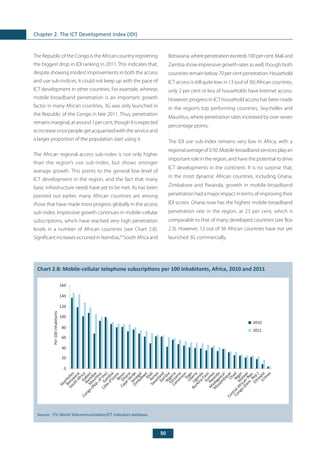
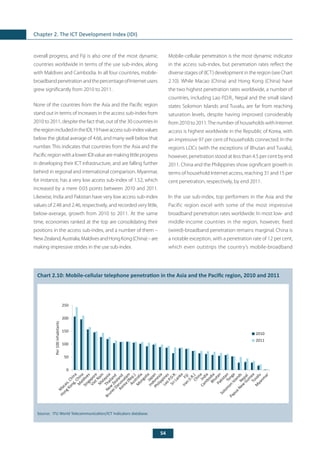
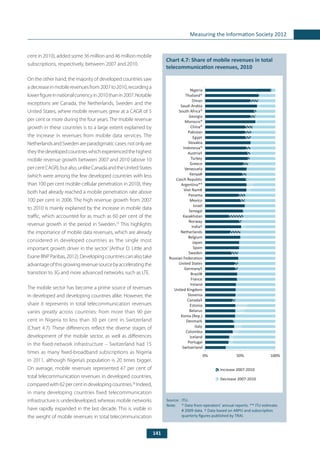
The number of mobile-cellular subscriptions continued to
grow at double-digit rates in almost 60 of the economies
included in the IDI. The biggest growth is taking place in
developing countries, with Namibia showing one of the
highest increases, reaching 105 per cent penetration by end
2011.53
Other African countries with high mobile-cellular
growth rates include Botswana and South Africa, where
penetration has passed the 100 per cent mark, and Uganda,
wherepenetrationstandsat48percentin2011.Penetration
rates in developed countries are stagnating, most countries
having reached saturation levels. By end 2011, mobile-
cellular penetration had already moved beyond 100 per
cent in 83 countries (out of 155 included in the IDI), and in
a total of 132 countries it has passed the 50 per cent mark.
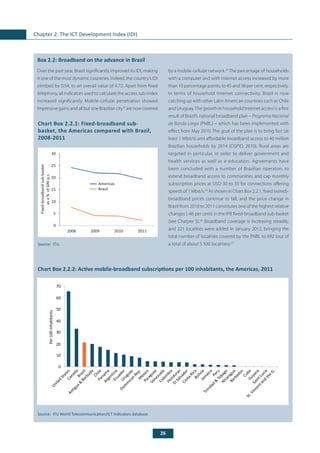
International Internet bandwidth per Internet user
continues to increase in most countries. As mentioned
0
200'000
400'000
600'000
800'000
1'000'000
2010
2011
Bit/s/user
HongKong,
ChinaSt.Vincentand
the
Grenadines
Sinpagore
Iceland
Sw
eden](https://image.slidesharecdn.com/mis2012withoutannex4-131010224350-phpapp02/85/Measuring-the-Information-Society-Informe-ICT-55-320.jpg)

![123
Measuring the Information Society 2012
Endnotes
1
The link between the IDI and the IPB (i.e. ICT prices and uptake) was also highlighted in ITU (2011b), Chapter 3, p. 61.
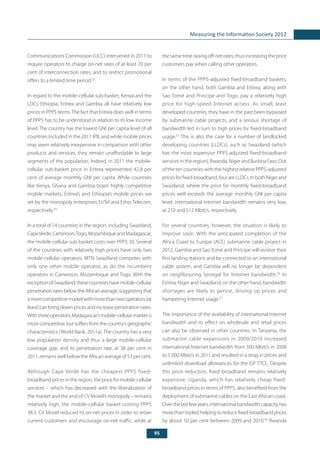
2
Fixed-broadband, as per the ITU Handbook for the Collection of Administrative Data on Telecommunications/ICT is defined as subscriptions to high-
speed access to the public Internet (a TCP/IP connection), at downstream speeds equal to, or greater than, 256 kbit/s, see: ITU (2011a).
3
In the Central African Republic, the number of fixed-telephone subscriptions has decreased to as few as 2 340 (resulting in a penetration rate of
0.05%), and penetration rates are also very low in such countries as Rep. of the Congo (0.24%), Liberia (0.08%), and Tanzania (0.35%). In Nauru, fixed-
telephone services were discontinued in 2010.
4
While the ICT Price Basket is a useful tool to assess the effects of different policies, it is important to bear in mind that not all regulatory changes will
have an immediate impact on prices. Certain policies may take some time before they bring about a concrete change in prices. Others, such as the
revision of interconnection charges, may have a more immediate effect.
5
World Bank, current USD, Atlas method.
6
The ITU ICT Price Basket Questionnaire has been sent to country statistical contacts once a year, since 2009. Before that, prices were collected as part
of the regular (long) ITU World Telecommunication/ICT Indicators questionnaire.
7
For this, the average annual UN operational rate of exchange is used.
8
The mobile-cellular sub-basket refers to a 30-call basket, which is the entry-level basket of the 2009 OECD methodology, but with the following
differences: the 2009 OECD methodology is based on the prices of the two largest mobile operators. The ITU mobile-cellular sub-basket uses (only)
the largest mobile operator’s prices. Additionally, the ITU mobile-cellular sub-basket does not take into account calls to voicemail (which in the
OECD basket represent 4 per cent of all calls). For more information, refer to Annex 2.
9
For example, if country A and country B have the same price in USD for any given ICT service, but in country A prices of other products are in
general cheaper (in USD), then applying PPP exchange rates to the ICT service price in country A will make this service more expensive. That is
so because, compared to country B, in country A the same amount of USD (exchanged into national currency at market exchange rates) can buy
more products or services. Therefore, the ICT service in country A is more expensive in terms of what could be bought with that amount in each
country. The International Comparison Program (ICP) is the major global initiative to produce internationally comparable price levels. It is overseen
by a Global Office housed in the World Bank and is implemented through the national statistical offices of 107 countries. Together with the OECD/
Eurostat PPP data, it provides a set of 150 benchmark countries and PPP data for all countries in the ICT Price Basket, except for Cuba, Estonia (which
changed its currency to EUR on 1 January, 2011) and Zimbabwe. For more information on PPP methodology and data, see http://go.worldbank.org/
UI22NH9ME0.
10
The World Bank’s Atlas method is used for the Bank’s official estimates of the size of economies in terms of GNI converted to current USD. GNI takes
into account all production in the domestic economy (i.e. GDP) plus the net flows of factor income (such as rents, profits and labour income) from
abroad. The Atlas method smooths exchange-rate fluctuations by using a three-year moving average, price-adjusted conversion factor. See:
http://web.worldbank.org/WBSITE/EXTERNAL/DATASTATISTICS/0,,contentMDK:20399244~menuPK:1504474~pagePK:64133150~piPK:64133175~th
eSitePK:239419,00.html.
11
Operators with large market shares, for example, may tend to offer very low on-net prices (encouraging customers to remain committed by offering
cheaper calls to the majority of its other customers) but much higher off-net prices, whereas new market entrants may (initially) offer much cheaper
prices to increase their market share. See also Box 3.1 in ITU (2011b).
12
See http://www.telecompaper.com/news/free-mobile-launches-service.
13
See http://www.telecompaper.com/news/bouygues-telecom-cuts-price-of-mid-range-mobile-services.
14
See http://www.rethink-wireless.com/2012/03/09/free-mobile-cost-french-rivals-28-profits.htm.
15
See http://www.arcep.fr/index.php?id=8571&tx_gsactualite_pi1[uid]=1485&tx_gsactualite_pi1[backID]=1&cHash=4ce87680cd.
16
See http://www.lefigaro.fr/societes/2012/03/02/20005-20120302ARTFIG00597-le-reseau-free-mobile-fortement-perturbe.php. See also:
http://www.arcep.fr/index.php?id=8571&tx_gsactualite_pi1[uid]=1482&tx_gsactualite_pi1[backID]=1&cHash=526fec2e34.
17
See, for example: http://www.fcc.gov/blog/new-fcc-website-help-consumers-beat-%E2%80%98bill-shock%E2%80%99 and also ITU (2011b), p. 89.
18
See http://www.tra.org.bh/en/pdf/GCCRoamingDecisionPressRelease_en.pdf.
19
See http://www.wired.com/gadgetlab/2011/10/fcc-ctia-bill-shock-guidelines/.
20
See for example regulation in France on mobile phone contracts: http://www.telegeography.com/products/commsupdate/articles/2010/12/01/
arcep-calls-for-shorter-fairer-mobile-contracts/.
21
In Japan and Republic of Korea, the number of prepaid subscriptions represents 1 and 2 per cent of the total number of mobile-cellular
subscriptions, respectively.
22
For concrete examples of exceptions and concrete country examples, please refer directly to the sub-basket sections.
23
In relative terms. In absolute terms, the difference is smaller for the fixed-telephone sub-basket.
24
It should be noted that the individual sub-baskets are not capped at 100 per cent (they are only capped for the calculation of the IPB), and so the
value changes in countries with very high fixed-broadband prices are reflected in the percentage change. The fixed-broadband sub-basket is the
only sub-basket where values exceed 100 (i.e. when the price of the fixed-broadband sub-basket is higher than the average monthly GNI per capita
in a country).](https://image.slidesharecdn.com/mis2012withoutannex4-131010224350-phpapp02/85/Measuring-the-Information-Society-Informe-ICT-139-320.jpg)
![125
Measuring the Information Society 2012
57
See http://www.ace-submarinecable.com/ace/default/EN/all/ace_en/the_project.htm, http://www.submarinecablemap.com/.
58
See http://www.cellular-news.com/story/45244.php?s=h.
59
See http://www.rdb.rw/departments/information-communication-technology.html.
60
According to the CTIA semi-annual survey, the average US-American citizen makes about 400 minutes of calls per month and sends some 200 sms.
Operators have adapted by offering a large number of high-volume or unlimited packages, based on which the actual cost per minute and per
call is much cheaper than the one on which the IPB is based. For example:“Tracfone offers its“Straight Talk”plan of unlimited minutes and text,
nationwide, any time, for USD 45 a month, and Boost has a USD 50 a month plan that offers users unlimited talk, text, web and walkie-talkie
service”. See http://telecoms.cytalk.com/2011/05/us-canada-and-spain-win-the-battle-for-most-expensive-cellphone-bills/. Similarly, in its 2011
Communications Outlook, OECD confirms that“Users in the United States tended to make far larger average use of mobile telephony than in other
countries, because of the more widespread use of unlimited voice services or large buckets of minutes”, see OECD (2011).
61
See http://www.ft.com/cms/s/0/74e1a934-0914-11df-ba88-00144feabdc0.html#axzz1sU0BzEbd.
62
See http://www.anatel.gov.br/Portal/documentos/sala_imprensa/23-3-2012--15h50min36s-Redução-VC.pdf.
63
“In March [2011] Cofetel ordered that interconnection fees be reduced from 0.95 pesos ($0.08) to 0.39 pesos, taking Mexico from a relatively
high rate to one of the lowest in the OECD. Retail prices have already fallen: Telcel cut the price of its off-net calls by two-thirds, and Telefónica by
half. Telmex lowered the price of calls to mobiles (thereby probably reducing the national inflation rate). The cuts may not end there: Cofetel is
considering applying“asymmetric regulation”to América Móvil, which could force it to charge less to its rivals than they charge it.”See:
http://www.economist.com/node/21546028. See also: OECD (2012b) and: http://www.totaltele.com/view.aspx?ID=472383.
64
See http://www.pyramidresearch.com/pr_prlist/PR111610_INSLA2.8.htm.
65
See http://www.fiercetelecom.com/story/finding-niche-mvnos-latin-america/2010-06-01.
66
See http://wirelessfederation.com/news/90633-virgin-mobile-to-launch-mvno-services-in-chile-in-2012-latin-america/.
67
See http://www.commsmea.com/11750-growth-factor/2/ as well as http://www.zawya.com/story.cfm/sidZAWYA20111030050118/Jordans_
mobile_phone_market_booms_expands and http://www.cellular-news.com/story/43648.php?s=h.
68
See http://www.tra.gov.om/newsite1/NewsDetails.aspx?newsid=56 and http://www.prepaidmvno.com/2011/06/22/oman-telecom-sector-tough-
competition-in-the-mobile-segment-and-growth-potential-for-the-fixed-and-broadband-zawya/.
69
See http://www.tra.gov.lb/TRA-presentations-2011.
70
See http://telecomlead.com/inner-page-details.php?id=6741&block=Service%20Provider and http://www.lankabusinessonline.com/fullstory.
php?nid=1532697933.
71
See http://www.gartner.com/it/page.jsp?id=1963915.
72
See http://www.trai.gov.in/WriteReadData/PressRealease/Document/Press%20release%201%20er.pdf.
73
See http://www.wirelessintelligence.com/analysis/2012/01/china-approaches-1-billion-mobile-connections-as-3g-services-gain-traction/.
74
See http://www.gomonews.com/china-mobile-loses-profit-as-mobile-3g-users-go-elsewhere/ and http://quicktake.morningstar.com/err/abde/chl.
pdf.
75
Like other operators in South Asia, those in Sri Lanka have adopted a‘budget telecom model’, a business model which is based on low cost, low
prices and high volume, aimed at being profitable even by serving low-income areas and populations. A key characteristic of this model is the
reduction of network costs by“sharing passive and active infrastructure, by outsourcing key parts of the operation including even the management
of the core network”. On the end-user side, this model takes into account the often limited ability of consumers to pay for a monthly subscription,
and is based on prepaid services. The model may also play an important role in spreading mobile-broadband services. See Galpaya (2011) and
Box 2.2. in Simon (2011).
76
See http://www.uzdaily.com/articles-id-10951.htm.
77
See http://broadbandtoolkit.org/7.4.
78
While the price of the entry-level fixed-broadband basket has been the same since 2009, speeds have increased substantially, from 1 Mbit/s in 2009
to 6 Mbit/s in 2011.
79
See http://www.modernrussia.com/content/russias-strategy-competition-broadband-internet-access.
80
See http://ec.europa.eu/information_society/activities/roaming/regulation/archives/current_rules/index_en.htm.
81
See http://www.crc.bg/news.php?news_id=14&lang=en and http://www.euractiv.com/infosociety/eu-sanction-bulgaria-inflated-mobile-prices-
news-506874.
82
See http://www.euractiv.com/infosociety/eu-sanction-bulgaria-inflated-mobile-prices-news-506874 and http://www.cellular-news.com/
story/50420.php.
83
See http://www.telegeography.com/products/commsupdate/articles/2010/11/12/macedonia-gets-its-first-mvno-in-wti/ and http://www.
telegeography.com/products/commsupdate/articles/2010/09/17/minister-hints-at-plan-to-open-mobile-market-to-mvnos/.
84
See the OECD broadband portal, which includes detailed country information on broadband services, uptake, speeds and prices:
http://www.oecd.org/document/54/0,3746,en_2649_34225_38690102_1_1_1_1,00.html.
85
Hereinafter referred to as“prepaid handset-based”.
86
Hereinafter referred to as“postpaid computer-based”.](https://image.slidesharecdn.com/mis2012withoutannex4-131010224350-phpapp02/85/Measuring-the-Information-Society-Informe-ICT-141-320.jpg)


![184
Chapter 5. Measuring communication capacity in bits and bytes
25
The following formula has been used: [Growth factor of global capacity to telecommunicate] = [growth factor of subscriptions] * [growth factor
of technological progress for hardware] * [growth factor of technological progress for compression algorithms]. For an in-depth analysis of the
different drivers, see Hilbert (forthcoming).
26
For a discussion of the different definitions of the digital divide and the respective complementary policy goals, see Hilbert (2011). Hilbert, López
and Vasquez (2010) measure the digital divide in terms of hardware capacity.
27
Developed and developing countries were classified according to the UN M.49 standard: http://www.itu.int/ITU-D/ict/definitions/regions/.
28
In absolute terms.
29
These relationships may be expected to be different when considering effective capacity as opposed to subscribed capacity.
30
When taking into account the 172 countries and territories for which data were available in 2010, the correlation coefficient between country shares
in global population and country shares in total stock of telecommunication subscriptions was 0.92. The correlation coefficient between country
shares in subscribed capacity in telecommunications and country shares in global GNI was 0.87.](https://image.slidesharecdn.com/mis2012withoutannex4-131010224350-phpapp02/85/Measuring-the-Information-Society-Informe-ICT-200-320.jpg)


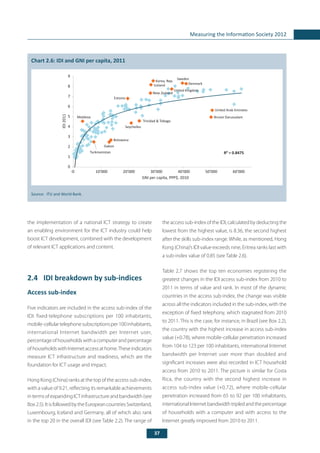
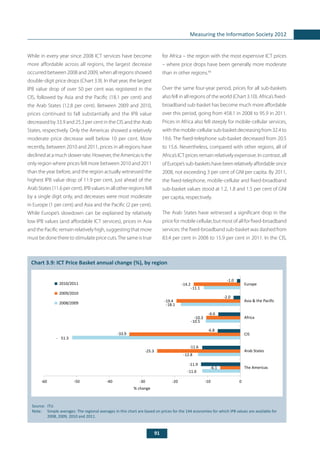
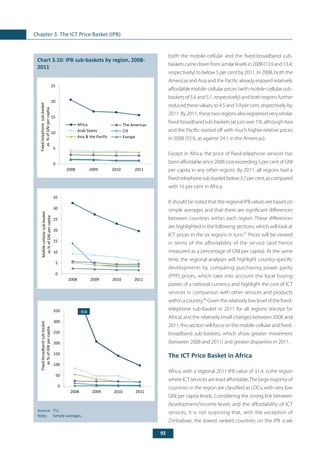
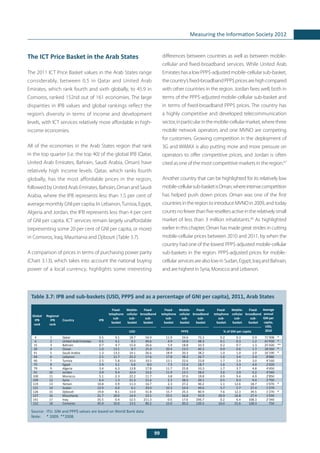
The 2012 edition of 'Measuring the Information Society' by the International Telecommunication Union presents comprehensive insights into global ICT development, emphasizing the ICT Development Index (IDI) and ICT Price Basket (IPB) metrics. It highlights significant growth in mobile broadband subscriptions, especially in developing countries, while also addressing the high costs of ICT services in low-income regions and persistent disparities between developed and developing nations. The report aims to support evidence-based policy formulation and peer learning globally for an inclusive information society.


