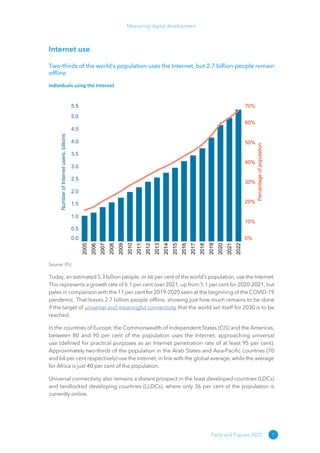
ITUPublications International Telecommunication Union
Development Sector
Measuring digital development
Facts and Figures
2022
Measuring digital development
Facts and Figures
2022
Please consider the environment before printing this report.
© ITU 2022
Some rights reserved. This work is licensed to the public through a Creative Commons Attribution-Non-
Commercial-Share Alike 3.0 IGO license (CC BY-NC-SA 3.0 IGO).
Under the terms of this licence, you may copy, redistribute and adapt the work for non-commercial purposes,
provided the work is appropriately cited. In any use of this work, there should be no suggestion that ITU
endorse any specific organization, products or services. The unauthorized use of the ITU names or logos is
not permitted. If you adapt the work, then you must license your work under the same or equivalent Creative
Commons licence. If you create a translation of this work, you should add the following disclaimer along
with the suggested citation: “This translation was not created by the International Telecommunication Union
(ITU). ITU is not responsible for the content or accuracy of this translation. The original English edition shall
be the binding and authentic edition”. For more information, please visit https://creativecommons.org/
licenses/by-nc-sa/3.0/igo/
Disclaimer
The designations employed and the presentation of the material in this publication do not imply
the expression of any opinion whatsoever on the part of ITU concerning the legal status of any
country, territory, city or area or of its authorities, or concerning the delimitation of its frontiers or
boundaries. The mention of specific companies or of certain manufacturers’ products does not
imply that they are endorsed or recommended by ITU in preference to others of a similar nature
that are not mentioned. Errors and omissions excepted, the names of proprietary products are
distinguished by initial capital letters.
All reasonable precautions have been taken by ITU to verify the information contained in this
publication. However, the published material is being distributed without warranty of any kind,
either expressed or implied. The responsibility for the interpretation and use of the material lies
with the reader. The opinions, findings and conclusions expressed in this publication do not
necessarily reflect the views of ITU or its membership.
ISBN
978-92-61-37011-5 (Electronic version)
978-92-61-37011-4 (EPUB version)
978-92-61-37021-3 (MOBI version)
iii
Foreword
ITU’s annual Facts and Figures report is unique in offering an
independent and rigorously researched snapshot of the state
of digital connectivity worldwide.
It serves as a key element in global efforts to “connect the
world” and bring universal meaningful connectivity to everyone,
everywhere. Accurate data are essential: to be sure our policies
and projects are having a real impact on bridging the digital
divide, we need to constantly track core connectivity indicators,
and drill down into the data to reveal both unexpected sticking
points, and surprising successes.
Over the past two years of the COVID-19 pandemic, we reported a “COVID-bump” that brought
greater than expected numbers online. While this year’s report indicates that that acceleration in
uptake has eased, figures show a generally positive trend overall, but highlight stalled progress
in hardest-to-reach communities.
As the world welcomes its 8 billionth inhabitant, an estimated 5.3 billion people – roughly 66 per
cent of the global population – are using the Internet. Yet some 2.7 billion people worldwide
remain totally offline, with universal connectivity still a distant prospect in least developed
countries and landlocked developing countries, where, on average, only 36 per cent of the
population is online.
Young people remain the driving force of connectivity globally, with 75 per cent of the 15-
to 24-year-old age group now online, compared with 65 per cent for the rest of the world’s
population.
And while data show slow but steady growth in fixed-broadband subscriptions, mobile continues
to dominate as the platform of choice for online access, particularly in low-income countries
where wireline connections can be scarce and costly, notably for those living outside of major
urban centres.
In poorly connected countries, two of the biggest barriers to digital uptake remain cost and
digital skills. While affordability of entry-level fixed- and mobile-broadband services improved
in 2022, the global gap remains far too wide. For an average consumer in a typical low-income
economy, the cheapest mobile broadband basket still costs more than 9 per cent of his or her
income – over six times the global average. Fixed-broadband service costs over 30 per cent,
compared with less than 2 per cent in the world’s high-income countries.
At the same time, lack of digital awareness and skills, combined with other issues such as lack
of content in local languages and low literacy levels, are conspiring to prevent many who could
connect from doing so.
As platforms and services become ever-more sophisticated, the digital divide is increasingly
being defined by people’s ability to make meaningful use of connectivity – defined as the
iv
possibility for everyone to enjoy a safe, satisfying, enriching, productive and affordable online
experience.
That is why, earlier this year, ITU and the Office of the United Nations Secretary-General's
Envoy on Technology announced a set of ambitious new targets for universal and meaningful
connectivity to be achieved by 2030.
These 15 aspirational targets, developed in response to the United Nations Secretary-General's
Roadmap for Digital Cooperation, provide concrete benchmarks and position sustainable,
inclusive and meaningful connectivity as an essential driver of global development.
With the 2030 deadline for delivering on the Sustainable Development Goals fast approaching,
identifying new strategies to achieve full digital inclusion has become a matter of utmost urgency
if we are to have any hope of meeting our Global Goals.
That means working more collaboratively to solve chronic gaps in rural access, access at
home and at school, digital skills training, quality and speed of connection, and equal digital
opportunities for marginalized groups including women and girls, as well as striving to
ensure that every country meets the affordability target set by the Broadband Commission for
Sustainable Development of less than 2 per cent of monthly gross national income per capita.
The ITU Partner2Connect Digital Coalition is one response to this pressing challenge, and has
already mobilized an unprecedented USD 29.2 billion for connectivity projects around the
world.
As we strive to intensify our efforts, and their impact, the importance of connectivity data has
never been greater. That is why I am extremely pleased to note that the vital role we play
in gathering and sharing ICT data was recognized at both our World Telecommunication
Development Conference in June, and our Plenipotentiary Conference in October/November,
with ITU Member States overwhelmingly endorsing ITU’s mandate to incubate, collect and
disseminate ICT statistics.
ITU data are relied upon, not just by the broader UN system, but by governments, the global
technology sector, development financing institutions, and the many grassroots organizations
working to promote digital inclusion within their communities.
With its hard evidence and global reach, ITU’s Facts and Figures remains one of our most powerful
advocacy tools to accelerate digital uptake worldwide and ensure that digital development is a
key priority on every country’s agenda.
Doreen Bogdan-Martin
Director, ITU Telecommunication Development Bureau
v
Foreword�����������������������������������������������������������������������������������������������������������������������������������������iii
Internet use�������������������������������������������������������������������������������������������������������������������������������������� 1
The gender digital divide�������������������������������������������������������������������������������������������������������������� 3
Youth Internet use�������������������������������������������������������������������������������������������������������������������������� 5
Internet use in urban and rural areas������������������������������������������������������������������������������������������� 6
Subscriptions����������������������������������������������������������������������������������������������������������������������������������� 8
Affordability of ICT services��������������������������������������������������������������������������������������������������������11
ICT skills�����������������������������������������������������������������������������������������������������������������������������������������14
Mobile phone ownership������������������������������������������������������������������������������������������������������������16
Mobile network coverage�����������������������������������������������������������������������������������������������������������19
International bandwidth usage��������������������������������������������������������������������������������������������������22
Methodology��������������������������������������������������������������������������������������������������������������������������������24
Table of contents
1
Measuring digital development
Facts and Figures 2022
Internet use
Two-thirds of the world’s population uses the Internet, but 2.7 billion people remain
offline
Individuals using the Internet
2005
2006
2007
2008
2009
2010
2011
2012
2013
2014
2015
2016
2017
2018
2019
2020
2021
2022
0.0
0.5
1.0
1.5
2.0
2.5
3.0
3.5
4.0
4.5
5.0
5.5
Number
of
Internet
users,
billions
0%
10%
20%
30%
40%
50%
60%
70%
Percentage
of
population
Source: ITU
Today, an estimated 5.3 billion people, or 66 per cent of the world’s population, use the Internet.
This represents a growth rate of 6.1 per cent over 2021, up from 5.1 per cent for 2020-2021, but
pales in comparison with the 11 per cent for 2019-2020 seen at the beginning of the COVID-19
pandemic. That leaves 2.7 billion people offline, showing just how much remains to be done
if the target of universal and meaningful connectivity that the world set itself for 2030 is to be
reached.
In the countries of Europe, the Commonwealth of Independent States (CIS) and the Americas,
between 80 and 90 per cent of the population uses the Internet, approaching universal
use (defined for practical purposes as an Internet penetration rate of at least 95 per cent).
Approximately two-thirds of the population in the Arab States and Asia-Pacific countries (70
and 64 per cent respectively) use the Internet, in line with the global average, while the average
for Africa is just 40 per cent of the population.
Universal connectivity also remains a distant prospect in the least developed countries (LDCs)
and landlocked developing countries (LLDCs), where only 36 per cent of the population is
currently online.
2
Measuring digital development
Facts and Figures 2022
Percentage of individuals using the Internet, by region, 2022
World
Africa
Americas
Arab
States
Asia-Pacific
CIS
Europe
Low-income
Lower-middle-income
Upper-middle-income
High-income
LDCs
LLDCs
SIDS
Total
66%
40%
83%
70%
64%
84%
89%
26%
56%
79%
92%
36% 36%
66%
Source: ITU
3
Measuring digital development
Facts and Figures 2022
The gender digital divide
The world takes a small step towards digital gender parity
Percentage of female and male population using the Internet, 2022
World
Africa
Americas
Arab States
Asia-Pacific
CIS
Europe
Low-income
Lower-middle-income
Upper-middle-income
High-income
LDCs
LLDCs
SIDS
Male 69%
Female 63%
45%
34%
83%
83%
75%
65%
67%
61%
84%
83%
90%
89%
32%
21%
61%
51%
80%
79%
93%
92%
43%
30%
40%
33%
66%
66%
Source: ITU
On a global scale, 69 per cent of men are using the Internet, compared with 63 per cent of
women. This means there are 259 million more men than women using the Internet in 2022.
Gender parity is deemed achieved when the gender parity score, defined as the female
percentage divided by the male percentage, stands between 0.98 and 1.02. Over the last
three years, the world has been taking small steps towards gender parity, moving from 0.90
in 2019 to 0.92 in 2022. The gender parity score, however, only provides a partial picture,
because it represents the ratio of two percentages. Measured by the absolute difference
between the numbers of men and women online, the gender gap actually increased by 20
million. Furthermore, while women account for roughly half of the population, they account
for a disproportionate – and increasing – share of the global offline population: women now
outnumber male non-users by 18 per cent, up from 11 per cent in 2019.
Generally, the regions with the highest Internet use also have the highest gender parity scores.
In the Americas, the CIS and Europe, gender parity has been achieved. Both the Asia-Pacific
and the Arab States have improved their gender parity score, whereas Africa has stalled in the
last three years.
4
Measuring digital development
Facts and Figures 2022
LDCs and LLDCs show the same trends as Africa: low Internet use and a low gender parity score,
with hardly any progress towards gender parity over the last three years.
The small island developing States (SIDS) are an exception to the correlation between low
Internet use and a low gender parity score: while universal connectivity remains elusive, these
islands reached full gender parity.
The Internet use gender parity score, 2019 and 2022
World
Africa
Americas
Arab
States
Asia-Pacific
CIS
Europe
Low-income
Lower-middle-income
Upper-middle-income
High-income
LDCs
LLDCs
SIDS
2022
0.92
2019
0.90
0.75
0.75
1.00
0.99
0.87
0.81
0.90
0.88
0.99
0.97
0.98
0.95
0.65
0.66
0.84
0.79
0.99
0.97
0.99
0.97
0.69
0.69
0.82
0.82
1.00
1.02
Gender parity (0.98-1.02)
Note: The gender parity score is calculated as the proportion of women who use the Internet divided by the proportion
of men. A value less than one indicates that men are more likely to use the Internet than women, while a value greater
than one indicates the opposite. Gender parity is considered to be achieved if the value lies between 0.98 and 1.02.
Source: ITU
5
Measuring digital development
Facts and Figures 2022
Youth Internet use
Three-quarters of 15- to 24-year-olds use the Internet
Percentage of individuals using the Internet, by age group, 2022
World
Africa
Americas
Arab
States
Asia-Pacific
CIS
Europe
Low-income
Lower-middle-income
Upper-middle-income
High-income
LDCs
LLDCs
SIDS
65%
36%
81%
68%
63%
83%
88%
23%
54%
77%
92%
33% 33%
63%
75%
55%
94%
80%
73%
91%
98%
39%
67%
96%
99%
47% 49%
81%
Rest of the
population
Youth
Source: ITU
Worldwide, 75 per cent of people aged between 15 and 24 use the Internet in 2022, 10
percentage points more than among the rest of the population (65 per cent). There are signs that
the generational gap is shrinking. In 2020, the difference between the penetration rate among
young people (71 per cent) and the rest of the population (57 per cent) was 14 percentage
points.
In all regions of the world, people aged between 15 and 24 are more connected than people
who are older or younger than that. Universality, defined as more than 95 per cent Internet
use, has already been reached in this age group in high-income and upper-middle-income
economies. The biggest gap in relative terms is observed in low-income economies, where 39
per cent of young people use the Internet, compared with only 23 per cent for the rest of the
population.
6
Measuring digital development
Facts and Figures 2022
Internet use in urban and rural areas
Internet use in rural areas is slowly catching up with urban areas
Percentage of individuals using the Internet in urban and rural areas, 2019-2022
2019 2020 2021 2022
0
25
50
75
100
Urban
Rural
Source: ITU
Worldwide, 82 per cent of urban dwellers are using the Internet in 2022. That percentage is 1.8
times as high as the percentage of Internet users in rural areas. Over the last three years, the
ratio has decreased from 2.3 to 1.8, as rural areas gradually catch up.
The urban-rural gap has been essentially bridged in Europe (ratio of 1.1). Elsewhere, it is wide
but narrowing. For instance, in Africa, 64 per cent of urban dwellers use the Internet in 2022
compared with 23 per cent of people in rural areas, a ratio of 2.8; but that is down from nearly
4 in 2019. In the Asia-Pacific region, the ratio is 1.8, down from 2.4 three years ago.
7
Measuring digital development
Facts and Figures 2022
Percentage of individuals using the Internet in urban and rural areas, 2022
Internet use
World
Africa
Americas
Arab States
Asia-Pacific
CIS
Europe
Low-income
Lower-middle-income
Upper-middle-income
High-income
LDCs
LLDCs
SIDS
Urban - 82%
Rural - 46%
64%
23%
87%
68%
80%
56%
82%
47%
89%
74%
91%
83%
43%
18%
75%
41%
86%
64%
94%
87%
52%
28%
60%
26%
82%
43%
Source: ITU
8
Measuring digital development
Facts and Figures 2022
Subscriptions
Mobile-broadband subscriptions continue to grow strongly
Global subscriptions per 100 inhabitants
2005 2006 2007 2008 2009 2010 2011 2012 2013 2014 2015 2016 2017 2018 2019 2020 2021 2022
0
25
50
75
100
Active-mobile broadband subscriptions
Fixed-broadband subscriptions
Fixed-telephone subscriptions
Mobile-cellular telephone subscriptions
Note: The levels for fixed subscriptions are usually lower than for mobile subscriptions, because the former are usually
shared within a household, while the latter are normally tied to an individual.
Source: ITU
Internet use is becoming as ubiquitous as mobile phones. Accordingly, the number of mobile-
broadband subscriptions is rapidly approaching the level of mobile-cellular subscriptions,
which is plateauing.
Over the last 10 years, the penetration rate of mobile-broadband subscriptions grew by a
massive 14.8 per cent per year on average, against 2 per cent for mobile-cellular subscriptions.
However, that growth rate has begun to taper off in the last few years.
Fixed-broadband subscriptions also continue to grow steadily, at an average annual growth
rate averaging 6.7 per cent over the last 10 years.
Simultaneously, fixed-telephone subscriptions continue their slow but steady decline, losing
an average of 4.2 per cent each year over the last 10 years.
9
Measuring digital development
Facts and Figures 2022
Annual growth rates in subscriptions, %
2005 2006 2007 2008 2009 2010 2011 2012 2013 2014 2015 2016 2017 2018 2019 2020 2021 2022
-10
0
10
20
30
40
50
60
Mobile-cellular telephone subscriptions
Fixed-telephone subscriptions
Fixed-broadband subscriptions
Active-mobile broadband subscriptions
Source: ITU
In 2022, the number of mobile-cellular subscriptions exceeds the total world population. In the
CIS region, there are nearly three subscriptions for every two citizens.
In contrast, low-income countries are lagging behind, with mobile-cellular penetration less than
half that in the upper-middle-income and high-income countries.
For active mobile-broadband subscriptions, regional disparities are glaring, with nearly three
times as many subscriptions per 100 inhabitants in America as in Africa.
10
Measuring digital development
Facts and Figures 2022
Mobile-cellular telephone
subscriptions per 100 inhabitants,
by region, 2022
World
Africa
Americas
Arab States
Asia-Pacific
CIS
Europe
Low-income
Lower-middle-income
Upper-middle-income
High-income
LDCs
LLDCs
SIDS
108
109
111
147
121
101
124
125
86
96
61
79
81
87
Source: ITU
Active mobile-broadband
subscriptions per 100 inhabitants,
by region, 2022
World
Africa
Americas
Arab States
Asia-Pacific
CIS
Europe
Low-income
Lower-middle-income
Upper-middle-income
High-income
LDCs
LLDCs
SIDS
113
103
110
104
145
87
42
74
89
28
66
42
47
58
Source: ITU
Penetration rates for fixed subscriptions are much lower than for mobile subscriptions,
because fixed connections are usually shared by several people in a household. Nonetheless,
the inequalities in access to fixed connections across countries are far higher than for mobile
connectivity. While fixed connections are common among households in upper-middle-income
and high-income countries, they are nearly non-existent in low-income countries, due to high
prices and a lack of infrastructure.
Fixed-cellular telephone
subscriptions per 100 inhabitants,
by region, 2022
World
Africa
Americas
Arab States
Asia-Pacific
CIS
Europe
Low-income
Lower-middle-income
Upper-middle-income
High-income
LDCs
LLDCs
SIDS
11
19
16
31
13
34
11
1
9
8
1
3
1
3
Source: ITU
Fixed-broadband subscriptions per
100 inhabitants, by region, 2022
World
Africa
Americas
Arab States
Asia-Pacific
CIS
Europe
Low-income
Lower-middle-income
Upper-middle-income
High-income
LDCs
LLDCs
SIDS
18
25
10
18
21
35
31
38
1
0
4
2
3
9
Source: ITU
11
Measuring digital development
Facts and Figures 2022
Affordability of ICT services
ICT services become more affordable worldwide in 2022
Data-only mobile broadband basket prices as % of gross national income per capita, 2021-2022
World
Africa
Americas
Arab States
Asia-Pacific
CIS
Europe
Low-income
Lower-middle-income
Upper-middle-income
High-income
LDCs
LLDCs
SIDS
1.9%
1.5%
6.5%
5.0%
2.6%
2.4%
1.2%
1.0%
1.5%
1.4%
1.1%
0.9%
0.5%
0.4%
11.4%
9.3%
3.2%
2.8%
2.1%
1.5%
0.5%
0.4%
7.4%
5.7%
4.6%
2.4%
3.3%
3.0%
Broadband Commission affordability target (2%)
2021
2022
Source: ITU
12
Measuring digital development
Facts and Figures 2022
Fixed broadband basket prices as % of gross national income per capita, 2021-2022
World
Africa
Americas
Arab States
Asia-Pacific
CIS
Europe
Low-income
Lower-middle-income
Upper-middle-income
High-income
LDCs
LLDCs
SIDS
3.5%
3.2%
18.3%
15.6%
5.0%
3.8%
3.5%
3.7%
3.5%
3.2%
2.1%
1.7%
1.3%
1.1%
35.8%
32.6%
11.8%
10.8%
3.6%
3.5%
1.3%
1.1%
19.8%
18.5%
7.0%
6.7%
4.9%
4.7%
Broadband Commission affordability target (2%)
2021
2022
Source: ITU
After a brief uptick in 2021, income-adjusted cost of fixed and mobile Internet services resumed
its downward trend in 2022. The two connectivity price benchmarks, namely the data-only
mobile broadband basket and the fixed broadband basket, have become more affordable
in all regions of the world and for all income groups. The global median price of the mobile
broadband basket dropped from 1.9 to 1.5 per cent of average gross national income (GNI)
per capita, while that of the fixed broadband basket dropped from 3.5 to 3.2 per cent of GNI
per capita.
Nonetheless, lack of affordability continues to be a key barrier to Internet access particularly in
low-income economies, even though this country group witnessed a nearly two-percentage-
point drop in the income-adjusted price of mobile broadband services. A wide gap remains
between high-income economies and the rest of the world. Compared to median prices that
are paid in high-income economies, the basket costs nearly 10 times as much in lower-middle-
income economies and nearly 30 times as much as in low-income economies, after adjusting
for differences in GNI per capita.
13
Measuring digital development
Facts and Figures 2022
The United Nations Broadband Commission for Sustainable Development aims to make
broadband prices in developing countries affordable by 2025, affordability being defined as
the availability of broadband access at a price that is less than two per cent of the monthly GNI
per capita.
Where data are available for both 2021 and 2022, more economies met the two per cent
affordability target for all five baskets of ICT services in 2022 than did so in 2021. Thus, 103
economies met the target with respect to the data-only mobile broadband basket in 2022 and
71 economies met the target with the fixed broadband basket (in each case 7 more than in
2021).
Detailed global, regional, and country-level analysis for all five price baskets along with the full
country-level dataset of ICT prices in 2022 will be released in early 2023.1
1
More information on ICT prices available at https://​
www​
.itu​
.int/​
en/​
ITU​
-D/​
Statistics/​
Pages/​
ICTprices/​
default​
.aspx
14
Measuring digital development
Facts and Figures 2022
ICT skills
Low levels of ICT skills hamper progress to universal and meaningful connectivity
A low level of ICT skills is one of the main barriers to achieving universal and meaningful
connectivity.
Because self-reporting of individuals’ ICT skills may be subjective, ICT skills are measured based
on whether an individual has recently performed certain activities that require different types
of skill. The assumption is that performing these activities implies that one has a certain level of
the required skills. Activities are grouped into five categories of digital skills: communication/
collaboration; problem solving; safety; content creation; and information/data literacy.
Digital skills are crucially important in leveraging ICTs to boost development. Yet data for such
skills remain very scant. Only 78 countries submit data, and rarely for all five categories. Based on
this limited dataset, communication/collaboration skills appear to be the most prevalent, with a
median of 50 per cent and an average that lies between 31 and 65 per cent for most countries.
The category with the second highest median is problem solving, followed by safety and
content creation. In the category with the lowest median, information/data literacy, there was
considerable variation between countries.
Another way to explore these data is through the breadth of skills reported in the different
countries. The 74 countries that provided data in at least three skill areas varied widely in this
respect. Forty-seven countries reported averages of at least 25 per cent in multiple areas, 22
reported averages of over 50 per cent in multiple areas and only five reported averages of over
75 per cent in multiple areas.
The relatively low level of skills in countries providing data contrasts against their high share of
overall Internet use – 86 per cent. This gap between individuals using the Internet and those
with digital skills demonstrates that many may be using the Internet without being able to fully
benefit from it or avoid its dangers.
15
Measuring digital development
Facts and Figures 2022
Percentage of individuals with ICT skills, by type of skill, based on most recent data in the 2019-2021
period
Communication/
collaboration
Problem solving Safety Content creation Information/data literacy
0
25
50
75
100
Note: Bars indicate the 25th percentile, median, and 75th percentile of all country values. Bottom and top lines
indicate minimum and maximum values. Communication/collaboration is the average of sending messages (e.g.
e-mail, messaging service, SMS) with attached files; making calls over the Internet; participating in social networks;
and taking part in consultation or voting via Internet. Problem solving is the average of finding, downloading, installing
and configuring software; connecting and installing new devices; transferring files or applications between devices;
electronic financial transactions; doing an online course; and buying or ordering goods or services. Safety is the average
of changing privacy settings; and setting up effective security measures. Digital content creation is the average of using
copy and paste tools; creating electronic presentations; using basic arithmetic formula in a spreadsheet; editing online
text, spreadsheets, presentations; and uploading self/user-created content. Information/data literacy is the average of
verifying the reliability of information; getting information about goods or services; reading or downloading newspapers,
etc.; and seeking health-related information. Data availability: 58 countries for communication/collaboration, 78
countries for problem solving, 27 countries for safety, 76 countries for content creation, and 51 countries for information/
data literacy. In-scope ages may vary between countries.
Source: ITU
16
Measuring digital development
Facts and Figures 2022
Mobile phone ownership
Three-quarters of the world’s population own a mobile phone
Percentage of individuals using the Internet vs percentage of individuals owning a mobile phone,
2013-2021
0 25 50 75 100
Percentage of individuals owning a mobile phone
0
25
50
75
100
Percentage
of
individuals
using
the
Internet
Income group
Low-income
Lower-middle-income
Upper-middle-income
High-income
Note: Official data available from 91 countries (327 observations). In-scope ages may vary between countries. Each
point refers to one country in one year between 2013 and2021. Some countries have multiple years and multiple
points. The blue dotted line refers to the trend of all countries. The grey diagonal line is a reference line for mobile
phone ownership = Internet use.
Source: ITU
Since mobile phones are the most common gateway to the Internet, the percentage of
individuals owning a mobile phone is a good indication of Internet penetration. This is not a
one-to-one relation, however: on the one hand, people other than the owner could use the
phone to access the Internet (e.g. children occasionally using the phone of a parent), and on
the other hand, some mobile owners have a calls-only mobile-cellular subscription (i.e. without
Internet access), as can be seen from the subscription section above.
17
Measuring digital development
Facts and Figures 2022
Percentage of individuals owning a mobile phone, 2022
World
Africa
Americas
Arab
States
Asia-Pacific
CIS
Europe
Low-income
Lower-middle-income
Upper-middle-income
High-income
LDCs
LLDCs
SIDS
73
61
88
81
67
91
93
49
65
76
95
58
61
75
Note: Mobile phone ownership refers to individuals aged 10 or older.
Source: ITU
Data show that, on average, in every region and every income group except the upper-
middle-income group, the percentage of individuals owning a mobile phone is higher than
the percentage of Internet users. Globally, 73 per cent of the population aged 10 and over own
a mobile phone in 2022, seven percentage points higher than the percentage of individuals
who use the Internet. This gap is closing in all regions, as growth in Internet use has significantly
outpaced the growth of mobile phone ownership over the last three years.
In the Americas, CIS and Europe, where Internet penetration exceeds 80 per cent on average,
the rate of mobile phone ownership is only marginally higher than Internet use. Elsewhere, the
gap is much wider. Thus, in low-income economies mobile phone ownership is almost twice
as prevalent as Internet use.
The gender parity gap in mobile phone ownership is comparable with that in Internet use.
At the global level, the gender parity score for mobile phone ownership is marginally lower
(i.e. skewed against women) than it is for Internet use. As with Internet use, progress has been
uneven in the past three years. Women are about 12 per cent less likely to own mobile phones
than men – virtually unchanged from 2019. Among those not owning mobile phones, women
outnumbered men by 39 per cent in 2022.
18
Measuring digital development
Facts and Figures 2022
The gender parity score for mobile phone ownership, 2019 and 2022
World
Africa
Americas
Arab
States
Asia-Pacific
CIS
Europe
Low-income
Lower-middle-income
Upper-middle-income
High-income
LDCs
LLDCs
SIDS
2022
0.88
2019
0.87
0.76
0.76
1.00
1.01
0.86
0.87
0.84
0.80
0.99
0.98 0.98
0.96
0.71
0.71
0.80
0.76
0.94
0.93
1.00
0.99
0.71
0.70
0.82
0.81
0.97
0.99
Gender parity (0.98-1.02)
Note: The gender parity score is calculated as the proportion of women who own a mobile phone divided by the
proportion of men. A value less than one indicates that men are more likely to own a mobile phone than women, while
a value greater than one indicates the opposite. Gender parity is considered to be achieved if the value lies between
0.98 and 1.02. Mobile phone ownership refers to individuals aged 10 or older.
Source: ITU
19
Measuring digital development
Facts and Figures 2022
Mobile network coverage
The coverage gap persists at five per cent
Population coverage by type of mobile network, 2015-2022
2015 2016 2017 2018 2019 2020 2021 2022
0%
20%
40%
60%
80%
100%
2G
3G
4G
Note: The values for 2G and 3G networks show the incremental percentage of the population that is not covered by
a more advanced technology network (e.g. in 2022, 95 per cent of the world population is covered by a 3G or above
network, that is 7 per cent + 88 per cent).
Source: ITU
In most developing countries, mobile broadband (3G or above) is the main way — and often
the only way — to connect to the Internet.
This kind of access is available to 95 per cent of the world population. Bridging the “coverage
gap”, that is, connecting the remaining five per cent still off the grid is proving difficult: since
crossing the 90 per cent threshold in 2018, global 3G coverage has increased only by four
percentage points. In Africa, the gap constitutes 18 per cent, predominantly affecting the
population of central and western Africa.
The coverage gap is almost the same in LDCs and LLDCs, falling short of target 9.c of Sustainable
Development Goal 9: to “significantly increase access to information and communications
technology and strive to provide universal and affordable access to the Internet in least
developed countries by 2020.”
Between 2015 and 2022, 4G network coverage doubled to reach 88 per cent of the world’s
population; but, as for previous technologies, growth is slowing down.
20
Measuring digital development
Facts and Figures 2022
4G technology is now available to more than 90 per cent of the population in the Americas, the
Asia-Pacific, the CIS and Europe. In the Arab States, one-quarter of the population still cannot
access a 4G network, while in Africa that is true for half the population.
In many countries older-generation networks are being switched off in favour of networks that
are more efficient and allow the development of a digital ecosystem compatible with 5G. This
is particularly the case for 3G, which is often shut down so that the freed-up spectrum can be
re-used for 5G, while keeping 2G for older legacy devices. This is the case for most European
operators, who are planning to have their 3G networks switched off by December 2025, and
for the Asia-Pacific region. However, in other regions of the world the path is less clear, mainly
because 2G and 3G networks retain a significant presence. This is the case notably in lower-
income countries, where both technologies are an important means of communication. In
those countries, the main obstacles to 5G deployment include high infrastructure costs, device
affordability, and regulatory and adoption barriers.
Preliminary data show that 19 per cent of the global population was covered by a 5G network
in 2021. The highest roll-out was in Europe at 52 per cent, followed by the Americas (38 per
cent) and the Asia-Pacific region (16 per cent).
Population coverage by type of mobile network, 2022
0% 20% 40% 60% 80% 100%
World
Africa
Americas
Arab States
Asia-Pacific
CIS
Europe
Low-income
Lower-middle-income
Upper-middle-income
High-income
LDCs
LLDCs
SIDS
2G (14%)
2G (13%)
3G (33%)
3G (20%)
3G (42%)
3G (34%)
3G (35%)
3G (14%)
4G (88%)
4G (50%)
4G (92%)
4G (76%)
4G (96%)
4G (92%)
4G (99%)
4G (34%)
4G (89%)
4G (97%)
4G (99%)
4G (49%)
4G (46%)
4G (71%)
2G (9%)
2G (9%)
2G (7%)
Note: The values for 2G and 3G networks show the incremental percentage of the population that is not covered by
a more advanced technology network (e.g. 95 per cent of the world population is covered by a 3G or above network,
that is 7 per cent + 88 per cent).
Source: ITU
21
Measuring digital development
Facts and Figures 2022
While virtually all urban areas in the world are covered by a mobile broadband network, many
gaps persist in rural areas.
In the Americas, 22 per cent of the rural population is not covered by any mobile signal at all,
while an additional 5 per cent only have access to a 2G network, meaning that 27 per cent are
unable to access the Internet. In Africa, those figures are 15 per cent (no coverage whatsoever),
and 14 per cent (2G only).
Population coverage by type of mobile network and area, 2022
World Rural
Urban
Africa Rural
Urban
Americas Rural
Urban
Arab States Rural
Urban
Asia-Pacific Rural
Urban
CIS Rural
Urban
Europe Rural
Urban
Low-income Rural
Urban
Lower-middle-income Rural
Urban
Upper-middle-income Rural
Urban
High-income Rural
Urban
LDCs Rural
Urban
LLDCs Rural
Urban
SIDS Rural
Urban
3G (13%)
4G (76%)
4G (97%)
2G (14%)
3G (47%)
3G (14%)
4G (25%)
4G (84%)
4G (65%)
4G (98%)
3G (37%)
4G (55%)
4G (91%)
4G (92%)
4G (99%)
4G (100%)
3G (14%)
4G (76%)
4G (100%)
4G (95%)
2G (17%)
3G (53%)
3G (20%)
4G (13%)
4G (72%)
4G (82%)
4G (97%)
3G (9%)
4G (100%)
4G (91%)
4G (100%)
4G (97%)
2G (13%)
3G (42%)
3G (20%)
4G (32%)
4G (79%)
2G (19%)
3G (46%)
3G (12%)
4G (27%)
4G (88%)
2G (19%)
3G (17%)
3G (12%)
4G (42%)
4G (88%)
Note: The values for 2G and 3G networks show the incremental percentage of the population that is not covered by
a more advanced technology network (e.g. 89 per cent of the world’s rural population is covered by a 3G and above
network, that is 76 per cent + 13 per cent).
Source: ITU
22
Measuring digital development
Facts and Figures 2022
International bandwidth usage
Unrelenting global consumption of Internet data continues to drive demand for
international bandwidth usage
International bandwidth usage by region, Tbit/s*
2017 2018 2019 2020 2021 2022
0
200
400
600
800
1000
1200
Asia-Pacific
Europe
Americas
Other
economies
Arab States
CIS
Africa
* 1 terabit = 1’000’000 megabits
Source: ITU
Unrelenting appetite for Internet data continues to drive demand for international data and
therefore bandwidth usage. That said, the 25 per cent growth in bandwidth usage in 2022 is
more modest than in recent years, which were marked by the effects of COVID-19.
At 17 per cent, the increase in bandwidth usage per Internet user was also lower in 2022 than
in the previous year. The compound average growth rate over the past five years is 33 per cent
for overall international bandwidth usage and 22 per cent for usage per Internet user.
In Africa, international bandwidth usage shows the fastest growth (37 per cent), while the fastest
growing region in terms of bandwidth usage per Internet user is the Americas (26 per cent).
23
Measuring digital development
Facts and Figures 2022
International bandwidth per Internet user, kbit/s, 2022
World
Africa
Americas
Arab
States
Asia-Pacific
CIS
Europe
Low-income
Lower-middle-income
Upper-middle-income
High
Income
LDCs
LLDCs
233
261
168
192
116
397
115 108
680
85
40 38
87
Source: ITU
24
Measuring digital development
Facts and Figures 2022
Methodology
For this publication, regional and global aggregates up to 2021 were calculated using data
supplied by Member States to ITU, supplemented by ITU estimates. Aggregates can differ
from those produced for previous editions of Facts and Figures, because of new or revised
data submitted by Member States. Except for the price data, all 2022 aggregates are estimates
computed by ITU, based on the methodology described below.
Mobile population coverage
The percentage of the population covered by a mobile signal (2G/3G/4G and above/5G) refers
to the percentage of inhabitants who have such coverage, regardless of whether they use the
service. The indicator thus measures the availability of mobile cellular services, not the actual
level of use or subscriptions. It is differentiated by urban and rural areas.
The data for this indicator are generally provided in aggregate form (urban and rural). As with
many indicators, ITU collects the data from telecommunication operators, telecommunication/
ICT regulators and national ministries. This information is widely available for both developed
and developing countries.
Since most countries provide data without differentiating between urban and rural coverage,
it is necessary to perform disaggregation. It is known that mobile cellular coverage is virtually
ubiquitous in urban areas. Furthermore, country data on the proportion of the population that
lives in rural areas is published by the World Bank. Subtracting the urban population from the
total population with mobile cellular coverage therefore gives the number of rural inhabitants
who have such coverage in rural areas.
The percentage of the rural population covered by a mobile cellular signal (2G/3G/4G and
above) is then obtained by dividing the number of such rural inhabitants by the total rural
population and multiplying by 100.
Aggregate values for regions, income groups and other groupings are calculated based on a
weighted average of the values for individual countries.
Internet access and use estimates
Statistics on Internet use and mobile phone ownership can be derived from household
surveys. However, relatively few countries administer such surveys, mainly owing to their cost;
accordingly, there are large data gaps.
In addition, the delay between the collection of household survey data and their publication
can be as much as two years or more, limiting their usefulness for ICT statistics given the rapid
pace of technological change.
These shortcomings make it necessary to rely on data modelling tools and/or imputation to
estimate missing values, and then use forecasting techniques to estimate the figures for 2022.
The models used to estimate these missing values are based on a diverse range of widely
available national indicators on mobile-broadband subscriptions, ICT affordability, GNI per
capita and so on, and accounting for their changes over time. The data used in the models were
also weighted to give proportional influence to each region based on its number of countries.
25
Measuring digital development
Facts and Figures 2022
In addition to official data collected by ITU from the membership, other sources were used
to obtain data and/or cross-check estimates, in particular the GSM Association (GSMA) and
Multiple Indicator Cluster Surveys. Additional data on socio-demographic characteristics were
obtained from the World Bank, UNICEF, the International Labour Organization and the United
Nations Population Division.
The official data and estimates were used to calculate aggregate values for regions, income
groups and other groupings based on a weighted average of the values for individual countries.
Internet use aggregates were weighted by the total population of each economy, while mobile
phone ownership aggregates were weighted by the size of the population aged 10 years or
older.
Disaggregation of overall values was performed separately. For instance, where official country
data on the number of Internet users were only available in aggregate form, comparable
economies for which disaggregated data for urban and rural populations are available were
used to estimate the missing urban/rural ratio for that country. Existing data on the country’s
population size and urbanization were then used to produce separate estimates of the
proportion of the population using the Internet in urban and rural areas. Global and regional
figures were calculated by weighting the figures for individual countries by the rural and urban
population in each country.
A similar procedure was used to estimate Internet use by young people and Internet use and
mobile phone ownership by gender.
For 2022, forecasting was used to estimate the proportion of individuals using the Internet
and owning mobile phones. Forecasts were made at the country level for overall Internet use
based on previous growth and historic growth of countries with similar levels of use. For all
other indicators, forecasts were produced for regional and global aggregates only, based on
previous growth.
Mobile cellular, mobile broadband and fixed broadband subscription estimates
The data on subscriptions in 2022 were compiled from publicly available data from regulators
and ministries, as well as subscription information published by each country’s main operators.
When the data from the main operator of the country was used, the operator-reported number
of subscriptions was divided by its market share to obtain the total number of subscriptions in
the country for a particular service. In the absence of annual reports, subscription data were
estimated from industry analyses, authoritative news articles and operator press releases.
Data from these sources include the absolute number of subscriptions, market shares,
penetration and growth rates, which were used to derive the country estimates using the same
method as with operator data. In the case of countries for which data were not available either
from the national administration or from annual and industry reports, subscriptions data were
estimated using univariate time series analyses applied to the data from the last 10 years.
The univariate time series analyses were done by decomposing the time series of penetration
data of a particular service to its trend and residual component so as to obtain the autoregressive
integrated moving average (ARIMA) models. The resulting ARIMA models were used to make
the 2022 point prediction for each country and service.
26
Measuring digital development
Facts and Figures 2022
Aggregate values for regions, income groups and other groupings were calculated based on
a weighted average of the values for individual countries.
International bandwidth usage estimates
The basic assumption is that international bandwidth usage is a function of demand for total
bandwidth capacity in a country, which can be obtained by multiplying the number of Internet
users by their average bandwidth use. Since very few countries publish monthly or quarterly
statistics on international bandwidth usage and given the fast pace at which data traffic is
increasing, estimates were performed using proxy indicators.
ITU statistics on fixed-broadband subscriptions were combined with crowd-sourced statistics
on average download speeds obtained from Ookla Speedtest data2
for over 180 economies.
Smoothed speed change ratios from the third quarter of 2021 to the second quarter of 2022
served as the basis for extrapolating growth rates for 2022. Estimates were validated against
reports by submarine cable operators.
For economies with missing or unreliable fixed broadband download speed data, 2022 values
were estimated with exponential smoothing relying on historical figures since 2016. It should be
noted that, due to variations in the quality of speed statistics, the explanatory power of the model
is stronger in countries where fixed broadband Internet is dominant, and in middle income
economies in general. Results are potentially sensitive to significant changes in broadband
subscriptions during the year.
ICT price statistics
ITU price statistics refer to ICT baskets, which are internationally comparable units of ICT services.
The Affordability of ICT services section above presents medians based on the 188 and 177
economies for which price data were available for both 2021 and 2022 for the data-only mobile
broadband and fixed broadband baskets, respectively. The data-only mobile broadband basket
is defined as the cheapest data-only mobile broadband subscription available domestically,
with a 3G technology or above and a minimum monthly data allowance of 2 GB. The fixed
broadband basket is defined as the cheapest fixed Internet subscription available domestically,
with a minimum of 5 GB monthly data allowance and an advertised download speed of at least
256 kbit/s.
The 2022 ICT prices refer to retail prices in effect in May 2022. GNI per capita values were
obtained from the World Bank World Development Indicators and refer to the latest available
year (2021 or 2020), retrieved in October 2022. Further details on ICT service price data
collection rules are available here.
2
Ookla Speedtest data. Speedtest by Ookla Global Fixed and Mobile Network Performance Maps was
accessed in July 2022 from https://​
registry​
.opendata​
.aws/​
speedtest​
-global​
-performance.
Office of the Director
International Telecommunication Union (ITU)
Telecommunication Development Bureau (BDT)
Place des Nations
CH-1211 Geneva 20
Switzerland
Office of Deputy Director and Regional Presence
Field Operations Coordination Department (DDR)
Place des Nations
CH-1211 Geneva 20
Switzerland
Email: bdtdirector@itu.int Email: bdtdeputydir@itu.int
Tel.: +41 22 730 5035/5435 Tel.: +41 22 730 5131
Fax: +41 22 730 5484 Fax: +41 22 730 5484
Digital Networks and Society (DNS) Digital Knowledge Hub Department
(DKH)
Partnerships for Digital Development
Department (PDD)
Email: bdt-dns@itu.int Email: bdt-dkh@itu.int Email: bdt-pdd@itu.int
Tel.: +41 22 730 5421 Tel.: +41 22 730 5900 Tel.: +41 22 730 5447
Fax: +41 22 730 5484 Fax: +41 22 730 5484 Fax: +41 22 730 5484
Africa
Ethiopia Cameroon Senegal Zimbabwe
International Telecommunication
Union (ITU) Regional Office
Gambia Road
Leghar Ethio Telecom Bldg. 3rd floor
P.O. Box 60 005
Addis Ababa
Ethiopia
Union internationale des
télécommunications (UIT)
Bureau de zone
Immeuble CAMPOST, 3e étage
Boulevard du 20 mai
Boîte postale 11017
Yaoundé
Cameroon
Union internationale des
télécommunications (UIT)
Bureau de zone
8, Route des Almadies
Immeuble Rokhaya, 3e étage
Boîte postale 29471
Dakar - Yoff
Senegal
International Telecommunication
Union (ITU) Area Office
TelOne Centre for Learning
Corner Samora Machel and
Hampton Road
P.O. Box BE 792
Belvedere Harare
Zimbabwe
Email: itu-ro-africa@itu.int Email: itu-yaounde@itu.int Email: itu-dakar@itu.int Email: itu-harare@itu.int
Tel.: +251 11 551 4977 Tel.: + 237 22 22 9292 Tel.: +221 33 859 7010 Tel.: +263 4 77 5939
Tel.: +251 11 551 4855 Tel.: + 237 22 22 9291 Tel.: +221 33 859 7021 Tel.: +263 4 77 5941
Tel.: +251 11 551 8328 Fax: + 237 22 22 9297 Fax: +221 33 868 6386 Fax: +263 4 77 1257
Fax: +251 11 551 7299
Americas
Brazil Barbados Chile Honduras
União Internacional de
Telecomunicações (UIT)
Escritório Regional
SAUS Quadra 6 Ed. Luis Eduardo
Magalhães,
Bloco “E”, 10º andar, Ala Sul
(Anatel)
CEP 70070-940 Brasilia - DF
Brazil
International Telecommunication
Union (ITU) Area Office
United Nations House
Marine Gardens
Hastings, Christ Church
P.O. Box 1047
Bridgetown
Barbados
Unión Internacional de
Telecomunicaciones (UIT)
Oficina de Representación de Área
Merced 753, Piso 4
Santiago de Chile
Chile
Unión Internacional de
Telecomunicaciones (UIT)
Oficina de Representación de
Área
Colonia Altos de Miramontes
Calle principal, Edificio No. 1583
Frente a Santos y Cía
Apartado Postal 976
Tegucigalpa
Honduras
Email: itubrasilia@itu.int Email: itubridgetown@itu.int Email: itusantiago@itu.int Email: itutegucigalpa@itu.int
Tel.: +55 61 2312 2730-1 Tel.: +1 246 431 0343 Tel.: +56 2 632 6134/6147 Tel.: +504 2235 5470
Tel.: +55 61 2312 2733-5 Fax: +1 246 437 7403 Fax: +56 2 632 6154 Fax: +504 2235 5471
Fax: +55 61 2312 2738
Arab States Asia-Pacific CIS
Egypt Thailand Indonesia Russian Federation
International Telecommunication
Union (ITU) Regional Office
Smart Village, Building B 147,
3rd floor
Km 28 Cairo
Alexandria Desert Road
Giza Governorate
Cairo
Egypt
International Telecommunication
Union (ITU) Regional Office
4th floor NBTC Region 1 Building
101 Chaengwattana Road
Laksi,
Bangkok 10210,
Thailand
Mailing address:
P.O. Box 178, Laksi Post Office
Laksi, Bangkok 10210, Thailand
International Telecommunication
Union (ITU) Area Office
Sapta Pesona Building
13th floor
JI. Merdan Merdeka Barat No. 17
Jakarta 10110
Indonesia
International Telecommunication
Union (ITU) Regional Office
4, Building 1
Sergiy Radonezhsky Str.
Moscow 105120
Russian Federation
Email: itu-ro-arabstates@itu.int Email: itu-ro-asiapacific@itu.int Email: itu-ro-asiapacific@itu.int Email: itumoscow@itu.int
Tel.: +202 3537 1777 Tel.: +66 2 574 9326 – 8 Tel.: +62 21 381 3572 Tel.: +7 495 926 6070
Fax: +202 3537 1888 +66 2 575 0055 Tel.: +62 21 380 2322/2324
Fax: +62 21 389 5521
Europe
Switzerland
International Telecommunication
Union (ITU) Office for Europe
Place des Nations
CH-1211 Geneva 20
Switzerland
Email: eurregion@itu.int
Tel.: +41 22 730 5467
Fax: +41 22 730 5484
International Telecommunication Union
Telecommunication Development Bureau
Place des Nations
CH-1211 Geneva 20
Switzerland
Published in Switzerland
Geneva, 2022

InformationCTechnology Facts Figures 2022.pdf

  • 1.
    ITUPublications International TelecommunicationUnion Development Sector Measuring digital development Facts and Figures 2022
  • 3.
  • 4.
    Please consider theenvironment before printing this report. © ITU 2022 Some rights reserved. This work is licensed to the public through a Creative Commons Attribution-Non- Commercial-Share Alike 3.0 IGO license (CC BY-NC-SA 3.0 IGO). Under the terms of this licence, you may copy, redistribute and adapt the work for non-commercial purposes, provided the work is appropriately cited. In any use of this work, there should be no suggestion that ITU endorse any specific organization, products or services. The unauthorized use of the ITU names or logos is not permitted. If you adapt the work, then you must license your work under the same or equivalent Creative Commons licence. If you create a translation of this work, you should add the following disclaimer along with the suggested citation: “This translation was not created by the International Telecommunication Union (ITU). ITU is not responsible for the content or accuracy of this translation. The original English edition shall be the binding and authentic edition”. For more information, please visit https://creativecommons.org/ licenses/by-nc-sa/3.0/igo/ Disclaimer The designations employed and the presentation of the material in this publication do not imply the expression of any opinion whatsoever on the part of ITU concerning the legal status of any country, territory, city or area or of its authorities, or concerning the delimitation of its frontiers or boundaries. The mention of specific companies or of certain manufacturers’ products does not imply that they are endorsed or recommended by ITU in preference to others of a similar nature that are not mentioned. Errors and omissions excepted, the names of proprietary products are distinguished by initial capital letters. All reasonable precautions have been taken by ITU to verify the information contained in this publication. However, the published material is being distributed without warranty of any kind, either expressed or implied. The responsibility for the interpretation and use of the material lies with the reader. The opinions, findings and conclusions expressed in this publication do not necessarily reflect the views of ITU or its membership. ISBN 978-92-61-37011-5 (Electronic version) 978-92-61-37011-4 (EPUB version) 978-92-61-37021-3 (MOBI version)
  • 5.
    iii Foreword ITU’s annual Factsand Figures report is unique in offering an independent and rigorously researched snapshot of the state of digital connectivity worldwide. It serves as a key element in global efforts to “connect the world” and bring universal meaningful connectivity to everyone, everywhere. Accurate data are essential: to be sure our policies and projects are having a real impact on bridging the digital divide, we need to constantly track core connectivity indicators, and drill down into the data to reveal both unexpected sticking points, and surprising successes. Over the past two years of the COVID-19 pandemic, we reported a “COVID-bump” that brought greater than expected numbers online. While this year’s report indicates that that acceleration in uptake has eased, figures show a generally positive trend overall, but highlight stalled progress in hardest-to-reach communities. As the world welcomes its 8 billionth inhabitant, an estimated 5.3 billion people – roughly 66 per cent of the global population – are using the Internet. Yet some 2.7 billion people worldwide remain totally offline, with universal connectivity still a distant prospect in least developed countries and landlocked developing countries, where, on average, only 36 per cent of the population is online. Young people remain the driving force of connectivity globally, with 75 per cent of the 15- to 24-year-old age group now online, compared with 65 per cent for the rest of the world’s population. And while data show slow but steady growth in fixed-broadband subscriptions, mobile continues to dominate as the platform of choice for online access, particularly in low-income countries where wireline connections can be scarce and costly, notably for those living outside of major urban centres. In poorly connected countries, two of the biggest barriers to digital uptake remain cost and digital skills. While affordability of entry-level fixed- and mobile-broadband services improved in 2022, the global gap remains far too wide. For an average consumer in a typical low-income economy, the cheapest mobile broadband basket still costs more than 9 per cent of his or her income – over six times the global average. Fixed-broadband service costs over 30 per cent, compared with less than 2 per cent in the world’s high-income countries. At the same time, lack of digital awareness and skills, combined with other issues such as lack of content in local languages and low literacy levels, are conspiring to prevent many who could connect from doing so. As platforms and services become ever-more sophisticated, the digital divide is increasingly being defined by people’s ability to make meaningful use of connectivity – defined as the
  • 6.
    iv possibility for everyoneto enjoy a safe, satisfying, enriching, productive and affordable online experience. That is why, earlier this year, ITU and the Office of the United Nations Secretary-General's Envoy on Technology announced a set of ambitious new targets for universal and meaningful connectivity to be achieved by 2030. These 15 aspirational targets, developed in response to the United Nations Secretary-General's Roadmap for Digital Cooperation, provide concrete benchmarks and position sustainable, inclusive and meaningful connectivity as an essential driver of global development. With the 2030 deadline for delivering on the Sustainable Development Goals fast approaching, identifying new strategies to achieve full digital inclusion has become a matter of utmost urgency if we are to have any hope of meeting our Global Goals. That means working more collaboratively to solve chronic gaps in rural access, access at home and at school, digital skills training, quality and speed of connection, and equal digital opportunities for marginalized groups including women and girls, as well as striving to ensure that every country meets the affordability target set by the Broadband Commission for Sustainable Development of less than 2 per cent of monthly gross national income per capita. The ITU Partner2Connect Digital Coalition is one response to this pressing challenge, and has already mobilized an unprecedented USD 29.2 billion for connectivity projects around the world. As we strive to intensify our efforts, and their impact, the importance of connectivity data has never been greater. That is why I am extremely pleased to note that the vital role we play in gathering and sharing ICT data was recognized at both our World Telecommunication Development Conference in June, and our Plenipotentiary Conference in October/November, with ITU Member States overwhelmingly endorsing ITU’s mandate to incubate, collect and disseminate ICT statistics. ITU data are relied upon, not just by the broader UN system, but by governments, the global technology sector, development financing institutions, and the many grassroots organizations working to promote digital inclusion within their communities. With its hard evidence and global reach, ITU’s Facts and Figures remains one of our most powerful advocacy tools to accelerate digital uptake worldwide and ensure that digital development is a key priority on every country’s agenda. Doreen Bogdan-Martin Director, ITU Telecommunication Development Bureau
  • 7.
    v Foreword�����������������������������������������������������������������������������������������������������������������������������������������iii Internet use�������������������������������������������������������������������������������������������������������������������������������������� 1 Thegender digital divide�������������������������������������������������������������������������������������������������������������� 3 Youth Internet use�������������������������������������������������������������������������������������������������������������������������� 5 Internet use in urban and rural areas������������������������������������������������������������������������������������������� 6 Subscriptions����������������������������������������������������������������������������������������������������������������������������������� 8 Affordability of ICT services��������������������������������������������������������������������������������������������������������11 ICT skills�����������������������������������������������������������������������������������������������������������������������������������������14 Mobile phone ownership������������������������������������������������������������������������������������������������������������16 Mobile network coverage�����������������������������������������������������������������������������������������������������������19 International bandwidth usage��������������������������������������������������������������������������������������������������22 Methodology��������������������������������������������������������������������������������������������������������������������������������24 Table of contents
  • 9.
    1 Measuring digital development Factsand Figures 2022 Internet use Two-thirds of the world’s population uses the Internet, but 2.7 billion people remain offline Individuals using the Internet 2005 2006 2007 2008 2009 2010 2011 2012 2013 2014 2015 2016 2017 2018 2019 2020 2021 2022 0.0 0.5 1.0 1.5 2.0 2.5 3.0 3.5 4.0 4.5 5.0 5.5 Number of Internet users, billions 0% 10% 20% 30% 40% 50% 60% 70% Percentage of population Source: ITU Today, an estimated 5.3 billion people, or 66 per cent of the world’s population, use the Internet. This represents a growth rate of 6.1 per cent over 2021, up from 5.1 per cent for 2020-2021, but pales in comparison with the 11 per cent for 2019-2020 seen at the beginning of the COVID-19 pandemic. That leaves 2.7 billion people offline, showing just how much remains to be done if the target of universal and meaningful connectivity that the world set itself for 2030 is to be reached. In the countries of Europe, the Commonwealth of Independent States (CIS) and the Americas, between 80 and 90 per cent of the population uses the Internet, approaching universal use (defined for practical purposes as an Internet penetration rate of at least 95 per cent). Approximately two-thirds of the population in the Arab States and Asia-Pacific countries (70 and 64 per cent respectively) use the Internet, in line with the global average, while the average for Africa is just 40 per cent of the population. Universal connectivity also remains a distant prospect in the least developed countries (LDCs) and landlocked developing countries (LLDCs), where only 36 per cent of the population is currently online.
  • 10.
    2 Measuring digital development Factsand Figures 2022 Percentage of individuals using the Internet, by region, 2022 World Africa Americas Arab States Asia-Pacific CIS Europe Low-income Lower-middle-income Upper-middle-income High-income LDCs LLDCs SIDS Total 66% 40% 83% 70% 64% 84% 89% 26% 56% 79% 92% 36% 36% 66% Source: ITU
  • 11.
    3 Measuring digital development Factsand Figures 2022 The gender digital divide The world takes a small step towards digital gender parity Percentage of female and male population using the Internet, 2022 World Africa Americas Arab States Asia-Pacific CIS Europe Low-income Lower-middle-income Upper-middle-income High-income LDCs LLDCs SIDS Male 69% Female 63% 45% 34% 83% 83% 75% 65% 67% 61% 84% 83% 90% 89% 32% 21% 61% 51% 80% 79% 93% 92% 43% 30% 40% 33% 66% 66% Source: ITU On a global scale, 69 per cent of men are using the Internet, compared with 63 per cent of women. This means there are 259 million more men than women using the Internet in 2022. Gender parity is deemed achieved when the gender parity score, defined as the female percentage divided by the male percentage, stands between 0.98 and 1.02. Over the last three years, the world has been taking small steps towards gender parity, moving from 0.90 in 2019 to 0.92 in 2022. The gender parity score, however, only provides a partial picture, because it represents the ratio of two percentages. Measured by the absolute difference between the numbers of men and women online, the gender gap actually increased by 20 million. Furthermore, while women account for roughly half of the population, they account for a disproportionate – and increasing – share of the global offline population: women now outnumber male non-users by 18 per cent, up from 11 per cent in 2019. Generally, the regions with the highest Internet use also have the highest gender parity scores. In the Americas, the CIS and Europe, gender parity has been achieved. Both the Asia-Pacific and the Arab States have improved their gender parity score, whereas Africa has stalled in the last three years.
  • 12.
    4 Measuring digital development Factsand Figures 2022 LDCs and LLDCs show the same trends as Africa: low Internet use and a low gender parity score, with hardly any progress towards gender parity over the last three years. The small island developing States (SIDS) are an exception to the correlation between low Internet use and a low gender parity score: while universal connectivity remains elusive, these islands reached full gender parity. The Internet use gender parity score, 2019 and 2022 World Africa Americas Arab States Asia-Pacific CIS Europe Low-income Lower-middle-income Upper-middle-income High-income LDCs LLDCs SIDS 2022 0.92 2019 0.90 0.75 0.75 1.00 0.99 0.87 0.81 0.90 0.88 0.99 0.97 0.98 0.95 0.65 0.66 0.84 0.79 0.99 0.97 0.99 0.97 0.69 0.69 0.82 0.82 1.00 1.02 Gender parity (0.98-1.02) Gender parity (0.98-1.02) Gender parity (0.98-1.02) Gender parity (0.98-1.02) Gender parity (0.98-1.02) Gender parity (0.98-1.02) Gender parity (0.98-1.02) Gender parity (0.98-1.02) Gender parity (0.98-1.02) Gender parity (0.98-1.02) Gender parity (0.98-1.02) Gender parity (0.98-1.02) Gender parity (0.98-1.02) Gender parity (0.98-1.02) Gender parity (0.98-1.02) Note: The gender parity score is calculated as the proportion of women who use the Internet divided by the proportion of men. A value less than one indicates that men are more likely to use the Internet than women, while a value greater than one indicates the opposite. Gender parity is considered to be achieved if the value lies between 0.98 and 1.02. Source: ITU
  • 13.
    5 Measuring digital development Factsand Figures 2022 Youth Internet use Three-quarters of 15- to 24-year-olds use the Internet Percentage of individuals using the Internet, by age group, 2022 World Africa Americas Arab States Asia-Pacific CIS Europe Low-income Lower-middle-income Upper-middle-income High-income LDCs LLDCs SIDS 65% 36% 81% 68% 63% 83% 88% 23% 54% 77% 92% 33% 33% 63% 75% 55% 94% 80% 73% 91% 98% 39% 67% 96% 99% 47% 49% 81% Rest of the population Youth Source: ITU Worldwide, 75 per cent of people aged between 15 and 24 use the Internet in 2022, 10 percentage points more than among the rest of the population (65 per cent). There are signs that the generational gap is shrinking. In 2020, the difference between the penetration rate among young people (71 per cent) and the rest of the population (57 per cent) was 14 percentage points. In all regions of the world, people aged between 15 and 24 are more connected than people who are older or younger than that. Universality, defined as more than 95 per cent Internet use, has already been reached in this age group in high-income and upper-middle-income economies. The biggest gap in relative terms is observed in low-income economies, where 39 per cent of young people use the Internet, compared with only 23 per cent for the rest of the population.
  • 14.
    6 Measuring digital development Factsand Figures 2022 Internet use in urban and rural areas Internet use in rural areas is slowly catching up with urban areas Percentage of individuals using the Internet in urban and rural areas, 2019-2022 2019 2020 2021 2022 0 25 50 75 100 Urban Rural Source: ITU Worldwide, 82 per cent of urban dwellers are using the Internet in 2022. That percentage is 1.8 times as high as the percentage of Internet users in rural areas. Over the last three years, the ratio has decreased from 2.3 to 1.8, as rural areas gradually catch up. The urban-rural gap has been essentially bridged in Europe (ratio of 1.1). Elsewhere, it is wide but narrowing. For instance, in Africa, 64 per cent of urban dwellers use the Internet in 2022 compared with 23 per cent of people in rural areas, a ratio of 2.8; but that is down from nearly 4 in 2019. In the Asia-Pacific region, the ratio is 1.8, down from 2.4 three years ago.
  • 15.
    7 Measuring digital development Factsand Figures 2022 Percentage of individuals using the Internet in urban and rural areas, 2022 Internet use World Africa Americas Arab States Asia-Pacific CIS Europe Low-income Lower-middle-income Upper-middle-income High-income LDCs LLDCs SIDS Urban - 82% Rural - 46% 64% 23% 87% 68% 80% 56% 82% 47% 89% 74% 91% 83% 43% 18% 75% 41% 86% 64% 94% 87% 52% 28% 60% 26% 82% 43% Source: ITU
  • 16.
    8 Measuring digital development Factsand Figures 2022 Subscriptions Mobile-broadband subscriptions continue to grow strongly Global subscriptions per 100 inhabitants 2005 2006 2007 2008 2009 2010 2011 2012 2013 2014 2015 2016 2017 2018 2019 2020 2021 2022 0 25 50 75 100 Active-mobile broadband subscriptions Fixed-broadband subscriptions Fixed-telephone subscriptions Mobile-cellular telephone subscriptions Note: The levels for fixed subscriptions are usually lower than for mobile subscriptions, because the former are usually shared within a household, while the latter are normally tied to an individual. Source: ITU Internet use is becoming as ubiquitous as mobile phones. Accordingly, the number of mobile- broadband subscriptions is rapidly approaching the level of mobile-cellular subscriptions, which is plateauing. Over the last 10 years, the penetration rate of mobile-broadband subscriptions grew by a massive 14.8 per cent per year on average, against 2 per cent for mobile-cellular subscriptions. However, that growth rate has begun to taper off in the last few years. Fixed-broadband subscriptions also continue to grow steadily, at an average annual growth rate averaging 6.7 per cent over the last 10 years. Simultaneously, fixed-telephone subscriptions continue their slow but steady decline, losing an average of 4.2 per cent each year over the last 10 years.
  • 17.
    9 Measuring digital development Factsand Figures 2022 Annual growth rates in subscriptions, % 2005 2006 2007 2008 2009 2010 2011 2012 2013 2014 2015 2016 2017 2018 2019 2020 2021 2022 -10 0 10 20 30 40 50 60 Mobile-cellular telephone subscriptions Fixed-telephone subscriptions Fixed-broadband subscriptions Active-mobile broadband subscriptions Source: ITU In 2022, the number of mobile-cellular subscriptions exceeds the total world population. In the CIS region, there are nearly three subscriptions for every two citizens. In contrast, low-income countries are lagging behind, with mobile-cellular penetration less than half that in the upper-middle-income and high-income countries. For active mobile-broadband subscriptions, regional disparities are glaring, with nearly three times as many subscriptions per 100 inhabitants in America as in Africa.
  • 18.
    10 Measuring digital development Factsand Figures 2022 Mobile-cellular telephone subscriptions per 100 inhabitants, by region, 2022 World Africa Americas Arab States Asia-Pacific CIS Europe Low-income Lower-middle-income Upper-middle-income High-income LDCs LLDCs SIDS 108 109 111 147 121 101 124 125 86 96 61 79 81 87 Source: ITU Active mobile-broadband subscriptions per 100 inhabitants, by region, 2022 World Africa Americas Arab States Asia-Pacific CIS Europe Low-income Lower-middle-income Upper-middle-income High-income LDCs LLDCs SIDS 113 103 110 104 145 87 42 74 89 28 66 42 47 58 Source: ITU Penetration rates for fixed subscriptions are much lower than for mobile subscriptions, because fixed connections are usually shared by several people in a household. Nonetheless, the inequalities in access to fixed connections across countries are far higher than for mobile connectivity. While fixed connections are common among households in upper-middle-income and high-income countries, they are nearly non-existent in low-income countries, due to high prices and a lack of infrastructure. Fixed-cellular telephone subscriptions per 100 inhabitants, by region, 2022 World Africa Americas Arab States Asia-Pacific CIS Europe Low-income Lower-middle-income Upper-middle-income High-income LDCs LLDCs SIDS 11 19 16 31 13 34 11 1 9 8 1 3 1 3 Source: ITU Fixed-broadband subscriptions per 100 inhabitants, by region, 2022 World Africa Americas Arab States Asia-Pacific CIS Europe Low-income Lower-middle-income Upper-middle-income High-income LDCs LLDCs SIDS 18 25 10 18 21 35 31 38 1 0 4 2 3 9 Source: ITU
  • 19.
    11 Measuring digital development Factsand Figures 2022 Affordability of ICT services ICT services become more affordable worldwide in 2022 Data-only mobile broadband basket prices as % of gross national income per capita, 2021-2022 World Africa Americas Arab States Asia-Pacific CIS Europe Low-income Lower-middle-income Upper-middle-income High-income LDCs LLDCs SIDS 1.9% 1.5% 6.5% 5.0% 2.6% 2.4% 1.2% 1.0% 1.5% 1.4% 1.1% 0.9% 0.5% 0.4% 11.4% 9.3% 3.2% 2.8% 2.1% 1.5% 0.5% 0.4% 7.4% 5.7% 4.6% 2.4% 3.3% 3.0% Broadband Commission affordability target (2%) 2021 2022 Source: ITU
  • 20.
    12 Measuring digital development Factsand Figures 2022 Fixed broadband basket prices as % of gross national income per capita, 2021-2022 World Africa Americas Arab States Asia-Pacific CIS Europe Low-income Lower-middle-income Upper-middle-income High-income LDCs LLDCs SIDS 3.5% 3.2% 18.3% 15.6% 5.0% 3.8% 3.5% 3.7% 3.5% 3.2% 2.1% 1.7% 1.3% 1.1% 35.8% 32.6% 11.8% 10.8% 3.6% 3.5% 1.3% 1.1% 19.8% 18.5% 7.0% 6.7% 4.9% 4.7% Broadband Commission affordability target (2%) 2021 2022 Source: ITU After a brief uptick in 2021, income-adjusted cost of fixed and mobile Internet services resumed its downward trend in 2022. The two connectivity price benchmarks, namely the data-only mobile broadband basket and the fixed broadband basket, have become more affordable in all regions of the world and for all income groups. The global median price of the mobile broadband basket dropped from 1.9 to 1.5 per cent of average gross national income (GNI) per capita, while that of the fixed broadband basket dropped from 3.5 to 3.2 per cent of GNI per capita. Nonetheless, lack of affordability continues to be a key barrier to Internet access particularly in low-income economies, even though this country group witnessed a nearly two-percentage- point drop in the income-adjusted price of mobile broadband services. A wide gap remains between high-income economies and the rest of the world. Compared to median prices that are paid in high-income economies, the basket costs nearly 10 times as much in lower-middle- income economies and nearly 30 times as much as in low-income economies, after adjusting for differences in GNI per capita.
  • 21.
    13 Measuring digital development Factsand Figures 2022 The United Nations Broadband Commission for Sustainable Development aims to make broadband prices in developing countries affordable by 2025, affordability being defined as the availability of broadband access at a price that is less than two per cent of the monthly GNI per capita. Where data are available for both 2021 and 2022, more economies met the two per cent affordability target for all five baskets of ICT services in 2022 than did so in 2021. Thus, 103 economies met the target with respect to the data-only mobile broadband basket in 2022 and 71 economies met the target with the fixed broadband basket (in each case 7 more than in 2021). Detailed global, regional, and country-level analysis for all five price baskets along with the full country-level dataset of ICT prices in 2022 will be released in early 2023.1 1 More information on ICT prices available at https://​ www​ .itu​ .int/​ en/​ ITU​ -D/​ Statistics/​ Pages/​ ICTprices/​ default​ .aspx
  • 22.
    14 Measuring digital development Factsand Figures 2022 ICT skills Low levels of ICT skills hamper progress to universal and meaningful connectivity A low level of ICT skills is one of the main barriers to achieving universal and meaningful connectivity. Because self-reporting of individuals’ ICT skills may be subjective, ICT skills are measured based on whether an individual has recently performed certain activities that require different types of skill. The assumption is that performing these activities implies that one has a certain level of the required skills. Activities are grouped into five categories of digital skills: communication/ collaboration; problem solving; safety; content creation; and information/data literacy. Digital skills are crucially important in leveraging ICTs to boost development. Yet data for such skills remain very scant. Only 78 countries submit data, and rarely for all five categories. Based on this limited dataset, communication/collaboration skills appear to be the most prevalent, with a median of 50 per cent and an average that lies between 31 and 65 per cent for most countries. The category with the second highest median is problem solving, followed by safety and content creation. In the category with the lowest median, information/data literacy, there was considerable variation between countries. Another way to explore these data is through the breadth of skills reported in the different countries. The 74 countries that provided data in at least three skill areas varied widely in this respect. Forty-seven countries reported averages of at least 25 per cent in multiple areas, 22 reported averages of over 50 per cent in multiple areas and only five reported averages of over 75 per cent in multiple areas. The relatively low level of skills in countries providing data contrasts against their high share of overall Internet use – 86 per cent. This gap between individuals using the Internet and those with digital skills demonstrates that many may be using the Internet without being able to fully benefit from it or avoid its dangers.
  • 23.
    15 Measuring digital development Factsand Figures 2022 Percentage of individuals with ICT skills, by type of skill, based on most recent data in the 2019-2021 period Communication/ collaboration Problem solving Safety Content creation Information/data literacy 0 25 50 75 100 Note: Bars indicate the 25th percentile, median, and 75th percentile of all country values. Bottom and top lines indicate minimum and maximum values. Communication/collaboration is the average of sending messages (e.g. e-mail, messaging service, SMS) with attached files; making calls over the Internet; participating in social networks; and taking part in consultation or voting via Internet. Problem solving is the average of finding, downloading, installing and configuring software; connecting and installing new devices; transferring files or applications between devices; electronic financial transactions; doing an online course; and buying or ordering goods or services. Safety is the average of changing privacy settings; and setting up effective security measures. Digital content creation is the average of using copy and paste tools; creating electronic presentations; using basic arithmetic formula in a spreadsheet; editing online text, spreadsheets, presentations; and uploading self/user-created content. Information/data literacy is the average of verifying the reliability of information; getting information about goods or services; reading or downloading newspapers, etc.; and seeking health-related information. Data availability: 58 countries for communication/collaboration, 78 countries for problem solving, 27 countries for safety, 76 countries for content creation, and 51 countries for information/ data literacy. In-scope ages may vary between countries. Source: ITU
  • 24.
    16 Measuring digital development Factsand Figures 2022 Mobile phone ownership Three-quarters of the world’s population own a mobile phone Percentage of individuals using the Internet vs percentage of individuals owning a mobile phone, 2013-2021 0 25 50 75 100 Percentage of individuals owning a mobile phone 0 25 50 75 100 Percentage of individuals using the Internet Income group Low-income Lower-middle-income Upper-middle-income High-income Note: Official data available from 91 countries (327 observations). In-scope ages may vary between countries. Each point refers to one country in one year between 2013 and2021. Some countries have multiple years and multiple points. The blue dotted line refers to the trend of all countries. The grey diagonal line is a reference line for mobile phone ownership = Internet use. Source: ITU Since mobile phones are the most common gateway to the Internet, the percentage of individuals owning a mobile phone is a good indication of Internet penetration. This is not a one-to-one relation, however: on the one hand, people other than the owner could use the phone to access the Internet (e.g. children occasionally using the phone of a parent), and on the other hand, some mobile owners have a calls-only mobile-cellular subscription (i.e. without Internet access), as can be seen from the subscription section above.
  • 25.
    17 Measuring digital development Factsand Figures 2022 Percentage of individuals owning a mobile phone, 2022 World Africa Americas Arab States Asia-Pacific CIS Europe Low-income Lower-middle-income Upper-middle-income High-income LDCs LLDCs SIDS 73 61 88 81 67 91 93 49 65 76 95 58 61 75 Note: Mobile phone ownership refers to individuals aged 10 or older. Source: ITU Data show that, on average, in every region and every income group except the upper- middle-income group, the percentage of individuals owning a mobile phone is higher than the percentage of Internet users. Globally, 73 per cent of the population aged 10 and over own a mobile phone in 2022, seven percentage points higher than the percentage of individuals who use the Internet. This gap is closing in all regions, as growth in Internet use has significantly outpaced the growth of mobile phone ownership over the last three years. In the Americas, CIS and Europe, where Internet penetration exceeds 80 per cent on average, the rate of mobile phone ownership is only marginally higher than Internet use. Elsewhere, the gap is much wider. Thus, in low-income economies mobile phone ownership is almost twice as prevalent as Internet use. The gender parity gap in mobile phone ownership is comparable with that in Internet use. At the global level, the gender parity score for mobile phone ownership is marginally lower (i.e. skewed against women) than it is for Internet use. As with Internet use, progress has been uneven in the past three years. Women are about 12 per cent less likely to own mobile phones than men – virtually unchanged from 2019. Among those not owning mobile phones, women outnumbered men by 39 per cent in 2022.
  • 26.
    18 Measuring digital development Factsand Figures 2022 The gender parity score for mobile phone ownership, 2019 and 2022 World Africa Americas Arab States Asia-Pacific CIS Europe Low-income Lower-middle-income Upper-middle-income High-income LDCs LLDCs SIDS 2022 0.88 2019 0.87 0.76 0.76 1.00 1.01 0.86 0.87 0.84 0.80 0.99 0.98 0.98 0.96 0.71 0.71 0.80 0.76 0.94 0.93 1.00 0.99 0.71 0.70 0.82 0.81 0.97 0.99 Gender parity (0.98-1.02) Gender parity (0.98-1.02) Gender parity (0.98-1.02) Gender parity (0.98-1.02) Gender parity (0.98-1.02) Gender parity (0.98-1.02) Gender parity (0.98-1.02) Gender parity (0.98-1.02) Gender parity (0.98-1.02) Gender parity (0.98-1.02) Gender parity (0.98-1.02) Gender parity (0.98-1.02) Gender parity (0.98-1.02) Gender parity (0.98-1.02) Note: The gender parity score is calculated as the proportion of women who own a mobile phone divided by the proportion of men. A value less than one indicates that men are more likely to own a mobile phone than women, while a value greater than one indicates the opposite. Gender parity is considered to be achieved if the value lies between 0.98 and 1.02. Mobile phone ownership refers to individuals aged 10 or older. Source: ITU
  • 27.
    19 Measuring digital development Factsand Figures 2022 Mobile network coverage The coverage gap persists at five per cent Population coverage by type of mobile network, 2015-2022 2015 2016 2017 2018 2019 2020 2021 2022 0% 20% 40% 60% 80% 100% 2G 3G 4G Note: The values for 2G and 3G networks show the incremental percentage of the population that is not covered by a more advanced technology network (e.g. in 2022, 95 per cent of the world population is covered by a 3G or above network, that is 7 per cent + 88 per cent). Source: ITU In most developing countries, mobile broadband (3G or above) is the main way — and often the only way — to connect to the Internet. This kind of access is available to 95 per cent of the world population. Bridging the “coverage gap”, that is, connecting the remaining five per cent still off the grid is proving difficult: since crossing the 90 per cent threshold in 2018, global 3G coverage has increased only by four percentage points. In Africa, the gap constitutes 18 per cent, predominantly affecting the population of central and western Africa. The coverage gap is almost the same in LDCs and LLDCs, falling short of target 9.c of Sustainable Development Goal 9: to “significantly increase access to information and communications technology and strive to provide universal and affordable access to the Internet in least developed countries by 2020.” Between 2015 and 2022, 4G network coverage doubled to reach 88 per cent of the world’s population; but, as for previous technologies, growth is slowing down.
  • 28.
    20 Measuring digital development Factsand Figures 2022 4G technology is now available to more than 90 per cent of the population in the Americas, the Asia-Pacific, the CIS and Europe. In the Arab States, one-quarter of the population still cannot access a 4G network, while in Africa that is true for half the population. In many countries older-generation networks are being switched off in favour of networks that are more efficient and allow the development of a digital ecosystem compatible with 5G. This is particularly the case for 3G, which is often shut down so that the freed-up spectrum can be re-used for 5G, while keeping 2G for older legacy devices. This is the case for most European operators, who are planning to have their 3G networks switched off by December 2025, and for the Asia-Pacific region. However, in other regions of the world the path is less clear, mainly because 2G and 3G networks retain a significant presence. This is the case notably in lower- income countries, where both technologies are an important means of communication. In those countries, the main obstacles to 5G deployment include high infrastructure costs, device affordability, and regulatory and adoption barriers. Preliminary data show that 19 per cent of the global population was covered by a 5G network in 2021. The highest roll-out was in Europe at 52 per cent, followed by the Americas (38 per cent) and the Asia-Pacific region (16 per cent). Population coverage by type of mobile network, 2022 0% 20% 40% 60% 80% 100% World Africa Americas Arab States Asia-Pacific CIS Europe Low-income Lower-middle-income Upper-middle-income High-income LDCs LLDCs SIDS 2G (14%) 2G (13%) 3G (33%) 3G (20%) 3G (42%) 3G (34%) 3G (35%) 3G (14%) 4G (88%) 4G (50%) 4G (92%) 4G (76%) 4G (96%) 4G (92%) 4G (99%) 4G (34%) 4G (89%) 4G (97%) 4G (99%) 4G (49%) 4G (46%) 4G (71%) 2G (9%) 2G (9%) 2G (7%) Note: The values for 2G and 3G networks show the incremental percentage of the population that is not covered by a more advanced technology network (e.g. 95 per cent of the world population is covered by a 3G or above network, that is 7 per cent + 88 per cent). Source: ITU
  • 29.
    21 Measuring digital development Factsand Figures 2022 While virtually all urban areas in the world are covered by a mobile broadband network, many gaps persist in rural areas. In the Americas, 22 per cent of the rural population is not covered by any mobile signal at all, while an additional 5 per cent only have access to a 2G network, meaning that 27 per cent are unable to access the Internet. In Africa, those figures are 15 per cent (no coverage whatsoever), and 14 per cent (2G only). Population coverage by type of mobile network and area, 2022 World Rural Urban Africa Rural Urban Americas Rural Urban Arab States Rural Urban Asia-Pacific Rural Urban CIS Rural Urban Europe Rural Urban Low-income Rural Urban Lower-middle-income Rural Urban Upper-middle-income Rural Urban High-income Rural Urban LDCs Rural Urban LLDCs Rural Urban SIDS Rural Urban 3G (13%) 4G (76%) 4G (97%) 2G (14%) 3G (47%) 3G (14%) 4G (25%) 4G (84%) 4G (65%) 4G (98%) 3G (37%) 4G (55%) 4G (91%) 4G (92%) 4G (99%) 4G (100%) 3G (14%) 4G (76%) 4G (100%) 4G (95%) 2G (17%) 3G (53%) 3G (20%) 4G (13%) 4G (72%) 4G (82%) 4G (97%) 3G (9%) 4G (100%) 4G (91%) 4G (100%) 4G (97%) 2G (13%) 3G (42%) 3G (20%) 4G (32%) 4G (79%) 2G (19%) 3G (46%) 3G (12%) 4G (27%) 4G (88%) 2G (19%) 3G (17%) 3G (12%) 4G (42%) 4G (88%) Note: The values for 2G and 3G networks show the incremental percentage of the population that is not covered by a more advanced technology network (e.g. 89 per cent of the world’s rural population is covered by a 3G and above network, that is 76 per cent + 13 per cent). Source: ITU
  • 30.
    22 Measuring digital development Factsand Figures 2022 International bandwidth usage Unrelenting global consumption of Internet data continues to drive demand for international bandwidth usage International bandwidth usage by region, Tbit/s* 2017 2018 2019 2020 2021 2022 0 200 400 600 800 1000 1200 Asia-Pacific Europe Americas Other economies Arab States CIS Africa * 1 terabit = 1’000’000 megabits Source: ITU Unrelenting appetite for Internet data continues to drive demand for international data and therefore bandwidth usage. That said, the 25 per cent growth in bandwidth usage in 2022 is more modest than in recent years, which were marked by the effects of COVID-19. At 17 per cent, the increase in bandwidth usage per Internet user was also lower in 2022 than in the previous year. The compound average growth rate over the past five years is 33 per cent for overall international bandwidth usage and 22 per cent for usage per Internet user. In Africa, international bandwidth usage shows the fastest growth (37 per cent), while the fastest growing region in terms of bandwidth usage per Internet user is the Americas (26 per cent).
  • 31.
    23 Measuring digital development Factsand Figures 2022 International bandwidth per Internet user, kbit/s, 2022 World Africa Americas Arab States Asia-Pacific CIS Europe Low-income Lower-middle-income Upper-middle-income High Income LDCs LLDCs 233 261 168 192 116 397 115 108 680 85 40 38 87 Source: ITU
  • 32.
    24 Measuring digital development Factsand Figures 2022 Methodology For this publication, regional and global aggregates up to 2021 were calculated using data supplied by Member States to ITU, supplemented by ITU estimates. Aggregates can differ from those produced for previous editions of Facts and Figures, because of new or revised data submitted by Member States. Except for the price data, all 2022 aggregates are estimates computed by ITU, based on the methodology described below. Mobile population coverage The percentage of the population covered by a mobile signal (2G/3G/4G and above/5G) refers to the percentage of inhabitants who have such coverage, regardless of whether they use the service. The indicator thus measures the availability of mobile cellular services, not the actual level of use or subscriptions. It is differentiated by urban and rural areas. The data for this indicator are generally provided in aggregate form (urban and rural). As with many indicators, ITU collects the data from telecommunication operators, telecommunication/ ICT regulators and national ministries. This information is widely available for both developed and developing countries. Since most countries provide data without differentiating between urban and rural coverage, it is necessary to perform disaggregation. It is known that mobile cellular coverage is virtually ubiquitous in urban areas. Furthermore, country data on the proportion of the population that lives in rural areas is published by the World Bank. Subtracting the urban population from the total population with mobile cellular coverage therefore gives the number of rural inhabitants who have such coverage in rural areas. The percentage of the rural population covered by a mobile cellular signal (2G/3G/4G and above) is then obtained by dividing the number of such rural inhabitants by the total rural population and multiplying by 100. Aggregate values for regions, income groups and other groupings are calculated based on a weighted average of the values for individual countries. Internet access and use estimates Statistics on Internet use and mobile phone ownership can be derived from household surveys. However, relatively few countries administer such surveys, mainly owing to their cost; accordingly, there are large data gaps. In addition, the delay between the collection of household survey data and their publication can be as much as two years or more, limiting their usefulness for ICT statistics given the rapid pace of technological change. These shortcomings make it necessary to rely on data modelling tools and/or imputation to estimate missing values, and then use forecasting techniques to estimate the figures for 2022. The models used to estimate these missing values are based on a diverse range of widely available national indicators on mobile-broadband subscriptions, ICT affordability, GNI per capita and so on, and accounting for their changes over time. The data used in the models were also weighted to give proportional influence to each region based on its number of countries.
  • 33.
    25 Measuring digital development Factsand Figures 2022 In addition to official data collected by ITU from the membership, other sources were used to obtain data and/or cross-check estimates, in particular the GSM Association (GSMA) and Multiple Indicator Cluster Surveys. Additional data on socio-demographic characteristics were obtained from the World Bank, UNICEF, the International Labour Organization and the United Nations Population Division. The official data and estimates were used to calculate aggregate values for regions, income groups and other groupings based on a weighted average of the values for individual countries. Internet use aggregates were weighted by the total population of each economy, while mobile phone ownership aggregates were weighted by the size of the population aged 10 years or older. Disaggregation of overall values was performed separately. For instance, where official country data on the number of Internet users were only available in aggregate form, comparable economies for which disaggregated data for urban and rural populations are available were used to estimate the missing urban/rural ratio for that country. Existing data on the country’s population size and urbanization were then used to produce separate estimates of the proportion of the population using the Internet in urban and rural areas. Global and regional figures were calculated by weighting the figures for individual countries by the rural and urban population in each country. A similar procedure was used to estimate Internet use by young people and Internet use and mobile phone ownership by gender. For 2022, forecasting was used to estimate the proportion of individuals using the Internet and owning mobile phones. Forecasts were made at the country level for overall Internet use based on previous growth and historic growth of countries with similar levels of use. For all other indicators, forecasts were produced for regional and global aggregates only, based on previous growth. Mobile cellular, mobile broadband and fixed broadband subscription estimates The data on subscriptions in 2022 were compiled from publicly available data from regulators and ministries, as well as subscription information published by each country’s main operators. When the data from the main operator of the country was used, the operator-reported number of subscriptions was divided by its market share to obtain the total number of subscriptions in the country for a particular service. In the absence of annual reports, subscription data were estimated from industry analyses, authoritative news articles and operator press releases. Data from these sources include the absolute number of subscriptions, market shares, penetration and growth rates, which were used to derive the country estimates using the same method as with operator data. In the case of countries for which data were not available either from the national administration or from annual and industry reports, subscriptions data were estimated using univariate time series analyses applied to the data from the last 10 years. The univariate time series analyses were done by decomposing the time series of penetration data of a particular service to its trend and residual component so as to obtain the autoregressive integrated moving average (ARIMA) models. The resulting ARIMA models were used to make the 2022 point prediction for each country and service.
  • 34.
    26 Measuring digital development Factsand Figures 2022 Aggregate values for regions, income groups and other groupings were calculated based on a weighted average of the values for individual countries. International bandwidth usage estimates The basic assumption is that international bandwidth usage is a function of demand for total bandwidth capacity in a country, which can be obtained by multiplying the number of Internet users by their average bandwidth use. Since very few countries publish monthly or quarterly statistics on international bandwidth usage and given the fast pace at which data traffic is increasing, estimates were performed using proxy indicators. ITU statistics on fixed-broadband subscriptions were combined with crowd-sourced statistics on average download speeds obtained from Ookla Speedtest data2 for over 180 economies. Smoothed speed change ratios from the third quarter of 2021 to the second quarter of 2022 served as the basis for extrapolating growth rates for 2022. Estimates were validated against reports by submarine cable operators. For economies with missing or unreliable fixed broadband download speed data, 2022 values were estimated with exponential smoothing relying on historical figures since 2016. It should be noted that, due to variations in the quality of speed statistics, the explanatory power of the model is stronger in countries where fixed broadband Internet is dominant, and in middle income economies in general. Results are potentially sensitive to significant changes in broadband subscriptions during the year. ICT price statistics ITU price statistics refer to ICT baskets, which are internationally comparable units of ICT services. The Affordability of ICT services section above presents medians based on the 188 and 177 economies for which price data were available for both 2021 and 2022 for the data-only mobile broadband and fixed broadband baskets, respectively. The data-only mobile broadband basket is defined as the cheapest data-only mobile broadband subscription available domestically, with a 3G technology or above and a minimum monthly data allowance of 2 GB. The fixed broadband basket is defined as the cheapest fixed Internet subscription available domestically, with a minimum of 5 GB monthly data allowance and an advertised download speed of at least 256 kbit/s. The 2022 ICT prices refer to retail prices in effect in May 2022. GNI per capita values were obtained from the World Bank World Development Indicators and refer to the latest available year (2021 or 2020), retrieved in October 2022. Further details on ICT service price data collection rules are available here. 2 Ookla Speedtest data. Speedtest by Ookla Global Fixed and Mobile Network Performance Maps was accessed in July 2022 from https://​ registry​ .opendata​ .aws/​ speedtest​ -global​ -performance.
  • 35.
    Office of theDirector International Telecommunication Union (ITU) Telecommunication Development Bureau (BDT) Place des Nations CH-1211 Geneva 20 Switzerland Office of Deputy Director and Regional Presence Field Operations Coordination Department (DDR) Place des Nations CH-1211 Geneva 20 Switzerland Email: bdtdirector@itu.int Email: bdtdeputydir@itu.int Tel.: +41 22 730 5035/5435 Tel.: +41 22 730 5131 Fax: +41 22 730 5484 Fax: +41 22 730 5484 Digital Networks and Society (DNS) Digital Knowledge Hub Department (DKH) Partnerships for Digital Development Department (PDD) Email: bdt-dns@itu.int Email: bdt-dkh@itu.int Email: bdt-pdd@itu.int Tel.: +41 22 730 5421 Tel.: +41 22 730 5900 Tel.: +41 22 730 5447 Fax: +41 22 730 5484 Fax: +41 22 730 5484 Fax: +41 22 730 5484 Africa Ethiopia Cameroon Senegal Zimbabwe International Telecommunication Union (ITU) Regional Office Gambia Road Leghar Ethio Telecom Bldg. 3rd floor P.O. Box 60 005 Addis Ababa Ethiopia Union internationale des télécommunications (UIT) Bureau de zone Immeuble CAMPOST, 3e étage Boulevard du 20 mai Boîte postale 11017 Yaoundé Cameroon Union internationale des télécommunications (UIT) Bureau de zone 8, Route des Almadies Immeuble Rokhaya, 3e étage Boîte postale 29471 Dakar - Yoff Senegal International Telecommunication Union (ITU) Area Office TelOne Centre for Learning Corner Samora Machel and Hampton Road P.O. Box BE 792 Belvedere Harare Zimbabwe Email: itu-ro-africa@itu.int Email: itu-yaounde@itu.int Email: itu-dakar@itu.int Email: itu-harare@itu.int Tel.: +251 11 551 4977 Tel.: + 237 22 22 9292 Tel.: +221 33 859 7010 Tel.: +263 4 77 5939 Tel.: +251 11 551 4855 Tel.: + 237 22 22 9291 Tel.: +221 33 859 7021 Tel.: +263 4 77 5941 Tel.: +251 11 551 8328 Fax: + 237 22 22 9297 Fax: +221 33 868 6386 Fax: +263 4 77 1257 Fax: +251 11 551 7299 Americas Brazil Barbados Chile Honduras União Internacional de Telecomunicações (UIT) Escritório Regional SAUS Quadra 6 Ed. Luis Eduardo Magalhães, Bloco “E”, 10º andar, Ala Sul (Anatel) CEP 70070-940 Brasilia - DF Brazil International Telecommunication Union (ITU) Area Office United Nations House Marine Gardens Hastings, Christ Church P.O. Box 1047 Bridgetown Barbados Unión Internacional de Telecomunicaciones (UIT) Oficina de Representación de Área Merced 753, Piso 4 Santiago de Chile Chile Unión Internacional de Telecomunicaciones (UIT) Oficina de Representación de Área Colonia Altos de Miramontes Calle principal, Edificio No. 1583 Frente a Santos y Cía Apartado Postal 976 Tegucigalpa Honduras Email: itubrasilia@itu.int Email: itubridgetown@itu.int Email: itusantiago@itu.int Email: itutegucigalpa@itu.int Tel.: +55 61 2312 2730-1 Tel.: +1 246 431 0343 Tel.: +56 2 632 6134/6147 Tel.: +504 2235 5470 Tel.: +55 61 2312 2733-5 Fax: +1 246 437 7403 Fax: +56 2 632 6154 Fax: +504 2235 5471 Fax: +55 61 2312 2738 Arab States Asia-Pacific CIS Egypt Thailand Indonesia Russian Federation International Telecommunication Union (ITU) Regional Office Smart Village, Building B 147, 3rd floor Km 28 Cairo Alexandria Desert Road Giza Governorate Cairo Egypt International Telecommunication Union (ITU) Regional Office 4th floor NBTC Region 1 Building 101 Chaengwattana Road Laksi, Bangkok 10210, Thailand Mailing address: P.O. Box 178, Laksi Post Office Laksi, Bangkok 10210, Thailand International Telecommunication Union (ITU) Area Office Sapta Pesona Building 13th floor JI. Merdan Merdeka Barat No. 17 Jakarta 10110 Indonesia International Telecommunication Union (ITU) Regional Office 4, Building 1 Sergiy Radonezhsky Str. Moscow 105120 Russian Federation Email: itu-ro-arabstates@itu.int Email: itu-ro-asiapacific@itu.int Email: itu-ro-asiapacific@itu.int Email: itumoscow@itu.int Tel.: +202 3537 1777 Tel.: +66 2 574 9326 – 8 Tel.: +62 21 381 3572 Tel.: +7 495 926 6070 Fax: +202 3537 1888 +66 2 575 0055 Tel.: +62 21 380 2322/2324 Fax: +62 21 389 5521 Europe Switzerland International Telecommunication Union (ITU) Office for Europe Place des Nations CH-1211 Geneva 20 Switzerland Email: eurregion@itu.int Tel.: +41 22 730 5467 Fax: +41 22 730 5484
  • 36.
    International Telecommunication Union TelecommunicationDevelopment Bureau Place des Nations CH-1211 Geneva 20 Switzerland Published in Switzerland Geneva, 2022