SlideShare a Scribd company logo
Iteration of Quadratic Equations - Draft
Thomas Jeffs
March 17, 2016
1 Introduction
Iteration lies at the heart of many concepts and methods in mathematics. For example, it can be used to solve
equations in image processing, fractal generation, Fibonnaci sequences, and many algorithms of all sorts.
Previously we explored iterating through a linear function of the form fpxq “ ax ` b, where a represented
the slope and b represented the y-intercept. In that case, we found that a had little effect on the convergence
or divergence of the series of iterations. However, x0 (the chosen initial value) was the deciding factor in
determining the long term behavior of the iteration sequence. In this article, we will explore iteration again,
but this time we will examine a quadratic function. Recall that quadratic functions are functions that follow
the form
fpxq “ ax2
` bx ` c (1)
We will be exploring a specific quadratic formula known as the logistics map, which is used to model
populations with a carrying capacity with a rational population rate:
fpxq “ axp1 ´ xq (2)
This form will help us demonstrate how why quadratic functions are more complicated and how even a
seemingly simple quadratic function can become chaotic very quickly.
Quadratic iteration is more complicated because it has the possibility of having multiple fixed points.
Recall, that ξ can be called a fixed point of fpxq if and only if fpξq “ ξ. The maximum number of fixed
points in a function fpxq is determined by the highest exponent of x. For instance, fpxq “ ax2
`bx`c has a
maximum of two fixed points. While it’s technically correct to say that it will have exactly two fixed points,
it’s possible in some cases, that the two fixed points are the same, thus leaving only one fixed point.
2 Results
2.1 Initial Findings
We begin the exploration by finding some of the more common, yet critical, values for the logistics map. To
find the points where the function fpxq “ axp1 ´ xq crosses the x-axis, we set the function equal to zero and
solve for x.
fpxq “ axp1 ´ xq
0 “ axp1 ´ xq
This leaves us with two factors, ax and p1 ´ xq, next we set each of these equal to zero and solve.
ax “ 0 1 ´ x “ 0
x “ 0 x “ 1
1
Therefore for the quadratic equation fpxq “ axp1 ´ xq, intercepts the x-axis at x “ t0, 1u. Because we want
to observe the behavior of the logistics map as iterates, we will focus on the domain x “ r0, 1s
Next, we will find the critical points of the logistics map. Recall that critical points are points on a curve
with a gradient of zero, that is Bf
By “ 0, however, because the logistics map is defined only in terms of x, this
results in f1
pxq “ 0. In the case of the logistics map, there is only one curve, so we will only see one critical
point.
fpxq “ ax ´ ax2
f1
pxq “ a ´ 2ax
0 “ a ´ 2ax
0 “ ap1 ´ 2xq
0 “ 1 ´ 2x
x “
1
2
Therefore, x “ 1
2 is the only critical point for the logistics map. Next, we’ll find the fixed points ξ of the
logistics map.
To find the fixed points of the logistics map, we set the functions fpξq “ ξ and solve for ξ.
fpξq “ aξp1 ´ ξq
ξ “ aξp1 ´ ξq
ξ “ aξ ´ aξ2
0 “ pa ´ 1qξ ´ aξ2
0 “ rpa ´ 1q ´ aξsξ
Setting each term equal to zero allows us to see the fixed points of the general equation.
ξ “ 0 pa ´ 1q ´ aξ “ 0
aξ “ pa ´ 1q
ξ “
pa ´ 1q
a
For this quadratic function fpxq, the fixed points will always be:
ξ “ t0,
a ´ 1
a
u (3)
Lastly, we will attempt to define a general equation for the iteration of the logistics map. Using the
abbreviated form for iteration, xn “ apxn´1 ´ x2
n´1q,
x0 “ x0
x1 “ apx0 ´ x2
0q x1 “ apx0 ´ x2
0q
x2 “ apx1 ´ x2
1q x2 “ arapx0 ´ x2
0q ´ a2
px0 ´ x2
0q2
s
x3 “ apx2 ´ x2
2q x3 “ ararapx0 ´ x2
0q ´ a2
px0 ´ x2
0q2
s ´ a2
rapx0 ´ x2
0q ´ a2
px0 ´ x2
0q2
s2
s
expand x3 x3 “ ara2
r´ax4
0 ` 2ax3
0 ` p´a ´ 1qx2
0 ` x0s ´ r´ax4
0 ` 2ax3
0 ` p´a ´ 1qx2
0 ` x0s2
s
After just 3 iterations, it’s clear that the general solution for xn would be far too complex to evaluate
easily. In order to observe the behavior of the iterations over time, we’ll use a different method. We will use
a cobweb plot. A cobweb plot is a special tool which displays the values of an iteration sequence as they
appear on the graph of the function itself. The graph is developed by graphing the function fpxq, along
with the line y “ x. Lastly, for each iteration value we plot a line joining segments px0, 0q to px0, x1q, then
px1, x1q to px1, x2q and so on until observations can be made.
2
a x0 Limit ξ “ 0 ξ “ a´1
a
0 .5 x “ 0 Attractor Repeller
0.5 .5 x “ 0 Attractor Repeller
1.0 .5 x « 0 Attractor Repeller
1.5 .5 x « 0.35 Attractor Repeller
2.0 .5 x “ .5 Repeller Repeller
2.5 .5 x « .66 Repeller Attractor
3.0 .5 x « .66 Repeller Attractor
3.5 .5 Divergent Repeller Attractor
4.0 .5 x “ 1 Repeller Repeller
Table 1: Observations of the Cobweb plots in the ranges a “ r0, 4s and holding x0 “ 0.5.
2.2 Cobwebs
Now that we have some important values for the logistics map, we’ll start to evaluate how the function
behaves as we iterate the function using chosen initial values for x0 and a. We will use cobweb graphs to
help illustrate how the iteration behaves over time. In order to understand the results, it’s important to
understand the following definitions:
Definition Attractor - A set of numerical values toward which a system tends to move towards, for a range
of system conditions. See Figure 1 for an example of an attractor.
Definition Repeller - A set of numerical values which a system tends to move away from over time, for a
range of system conditions.
In our case, we will be examining the attraction or repulsion from the fixed points, ξ “ 0, a´1
a , using
different initial values for a and x0.
As we explored the cobweb graphs of several different values, we found that the value for x0, inside the
domain of x0 “ r0, 1s, didn’t have an effect on whether or not the iteration would converge, or diverge.
Instead, the value of x0, only affected how quickly the iteration sequence would converge or diverge to its
attraction/repellent points. When x0 was close to the attracting fixed point, it would use fewer iterations to
converge. However, when x0 is outside of the specified domain, the iteration will diverge.
The results lead to an exploration of when a fixed point becomes an attractor or repeller. Upon exami-
nation, the attraction property is based on the slope at the fixed point. To find the slope, we evaluate the
derivative of fpxq at the fixed points ξ “ 0, a´1
a .
fpxq “ ax ´ ax2
f1
pxq “ a ´ 2ax
f1
p0q “ a ´ 2ap0q f1
p
a ´ 1
a
q “ a ´ 2ap
a ´ 1
a
q
f1
p
a ´ 1
a
q “ a ´ 2pa ´ 1q
f1
p0q “ a f1
p
a ´ 1
a
q “ 2 ´ a
As we can see, the slope at the fixed point x “ 0 is reflected as the value of a, while the slope at the fixed
point x “ a´1
a follows the linear equation m “ 2 ´ a. Focusing on the slope at the non-zero fixed point,
we can see that when 1 ă a ă 3, the fixed point will be an attractor. This contradicts the observations
that we made in Table 1, where the non-zero fixed point didn’t show attraction until a “ 2.5. This is one
of the limitations of the cobweb graph, the math shows conclusively when the non-zero fixed point will be
3
Figure 1: Cobweb graph were a “ 2.9 and x0 “ 0.45.
an attractor, but the cobweb graph can’t show the attraction property unless the value of x0 is sufficiently
far enough away from the fixed point to demonstrate attraction or repulsion. We can further prove that the
a “ r1, 3s will attract to the non-zero fixed point by proving that any attracting fixed point has a specified
interval:
Claim: If |f1
pξq| ă M ă 1, Then ξ is an attractor. Where M is a constant.
Proof:
lim
xÑξ
|
fpxq ´ fpξq
x ´ ξ
| ă M ă 1
lim
xÑξ
|
fpxq ´ ξ
x ´ ξ
| ă M ă 1
This implies, by the definition of limit, that there is an interval[I] of values containing ξ, such that the
equation is true. Thus,
|
fpxq ´ ξ
x ´ ξ
| ă M
|fpxq ´ ξ| ă M|x ´ ξ|, for all x in I
˝ QED
As defined, M ă 1, meaning that the two sides will get closer and closer as time moves on. Thus showing
that the fixed point ξ will be an attractor.
2.3 K-cycles
Table 1 showed an interesting anomaly around a “ 3.5, the cobweb graph appeared to be divergent, because
the ”legs” of the graph didn’t seem to be moving towards a single value. This behavior is defined as k-cycles,
where k represents the number of values that the iteration sequence seems to be ”settling” on. An example
of a 3-cycle can be seen in Figure 3, it’s clear that the graph isn’t moving towards one single value. Instead,
the sequence has ”settled” on 3 values that continue to recur in the iteration sequence. In the case of Figure
3, the value of a “ 3.835 produces a sequence with resulting values of
fp3.835q “ r¨ ¨ ¨ , 0.4945144, 0.9586346, 0.1520743, 0.4945144, 0.9586346, 0.1520743, ¨ ¨ ¨ s
As we’ll see later, this 3-cycle is a bit of a unicorn.
4
Figure 2: Cobweb graph were a “ 0.75 and x0 “ 0.5.
Figure 3: Cobweb graph were a “ 3.835 and x0 “ 0.5, this is an example of a 3-cycle.
5
Figure 4: Feigenbaum diagram for a “ r0, 4s.
Figure 5: Feigenbaum diagram for a “ r2.8, 4s.
2.4 Feigenbaum
To explore the number of k-cycles each possible a value can produce, and to see a clearer picture of what
happens to the quadratic iterations after a “ 3 we turn to what’s known as a Feigenbaum diagram. This
diagram displays the values of x versus the value of a.
Figure 4 shows the Feigenbaum diagram for our logistics map. The diagram helps us to see that in certain
intervals, the behavior is very predictable. As you can see, the behavior meets our expectations right up
until a “ 3, then it bifurcates into two branches. A short time later, at around a “ 3.4 it bifurcates again.
This continues until there are so many branches that it’s impossible to determine what’s going on, this is
called Chaos. It’s clear that there are 3 distinct areas of the diagram based on the range of a.
In the range a “ r0, 1s, we see that the value of x is constant, in fact, it’s constant x “ 0. If we look back
at the original logistics map iteration sequence, we can see that for values of a ă 1, the sequence coefficient
a gets smaller and smaller. As we get further into the iterations, the resultant number gets smaller and
smaller. Also, we can observe the slope at the fixed point f1
p0q “ a, meaning that when ´1 ą a ą 1, then
the fixed point x “ 0 is an attractor.
The next interval a “ r1, 3s behaves exactly as expected. As we defined earlier, the non-zero fixed point
is an attractor when a falls inside this interval. Thus, each point of convergence is mapped following the line
that represents x “ a´1
a , hence the curved shape.
The last interval is the most interesting, a “ r3, 4s is the beginning of the k-cycle period, shown in Figure
6
Figure 6: Feigenbaum diagram for a “ r3.825, 3.85s.
5. Each distinct point represents a value for x for each given a value. Traveling up the graph, it’s possible
to see how many cycles a chosen value of a will produce. For example, if we select a “ 3.1, we should see
that it is a 2-cycle and that it will settle on two values over time.
fp3.1q “ r¨ ¨ ¨ , 0.7645665, 0.5580141, 0.7645665, 0.5580141, 0.7645665, 0.5580141, ¨ ¨ ¨ s
As expected, the values for x bounce between 0.7645665 and 0.5580141.
Looking further along the axis, we see a point where the bifurcation seems to fold back in on itself, this
section has been highlighted in Figure 6. This is where our magic unicorn of the 3-cycle can be found. As we
know, bifurcation is basically a function line splitting into two directions. So, you might think that given a
number of bifurcations, you shouldn’t see any odd sets. But this figure demonstrates a set of 3 and 5-cycles.
3 Summary
As we’ve seen, even seemingly simple quadratic equations can produce very unexpected results. In this case
we evaluated the logistic map and saw that it was easy to predict the behavior of the functions iterations
within a very small range. Anything after a “ 4 diverged almost immediately, except in the cases where
x0 “ a´1
a , ni which case, the sequence converged immediately. I presume that the limit of a “ 4 is related
to the position of the function. For instance, if the function were shifted higher in the y-axis, I believe this
would increase the highest possible value of a. It seems that a rational relationship exists between the line
y “ x and fpxq. And that this ratio represents the maximum value of a. This is an excellent introduction to
chaos and how easily it can rear it’s ugly head. We were able to observe that fixed points are very important
in quadratic iteration. If we were to expand beyond powers of 2 quadratics, we would see that the number
of possible fixed points is delegated by the highest order exponent. For example, x3
will have a maximum of
3 fixed points. All fixed points act similar to magnetic poles, you can’t have two attractors or two repellers
nearest to each other. I assume that the value of a and it’s position relative to an attractor and repeller will
determine how quickly it will break down into chaos. But alas, we will have to explore that another time.
7

More Related Content

What's hot

TheAscoliArzelaTheoremWithApplications
TheAscoliArzelaTheoremWithApplicationsTheAscoliArzelaTheoremWithApplications
TheAscoliArzelaTheoremWithApplications
Andrea Collivadino
 
Book chapter-5
Book chapter-5Book chapter-5
Book chapter-5
Hung Le
 
Convex Hull Algorithm Analysis
Convex Hull Algorithm AnalysisConvex Hull Algorithm Analysis
Convex Hull Algorithm Analysis
Rex Yuan
 
Zero. Probabilystic Foundation of Theoretyical Physics
Zero. Probabilystic Foundation of Theoretyical PhysicsZero. Probabilystic Foundation of Theoretyical Physics
Zero. Probabilystic Foundation of Theoretyical Physics
Gunn Quznetsov
 
Ordinal Regression and Machine Learning: Applications, Methods, Metrics
Ordinal Regression and Machine Learning: Applications, Methods, MetricsOrdinal Regression and Machine Learning: Applications, Methods, Metrics
Ordinal Regression and Machine Learning: Applications, Methods, Metrics
Francesco Casalegno
 
Klt
KltKlt
A bit about мcmc
A bit about мcmcA bit about мcmc
A bit about мcmc
Alexander Favorov
 
Mechanical Engineering Assignment Help
Mechanical Engineering Assignment HelpMechanical Engineering Assignment Help
Mechanical Engineering Assignment Help
Matlab Assignment Experts
 
Monte Caro Simualtions, Sampling and Markov Chain Monte Carlo
Monte Caro Simualtions, Sampling and Markov Chain Monte CarloMonte Caro Simualtions, Sampling and Markov Chain Monte Carlo
Monte Caro Simualtions, Sampling and Markov Chain Monte Carlo
Xin-She Yang
 
Convex Hull - Chan's Algorithm O(n log h) - Presentation by Yitian Huang and ...
Convex Hull - Chan's Algorithm O(n log h) - Presentation by Yitian Huang and ...Convex Hull - Chan's Algorithm O(n log h) - Presentation by Yitian Huang and ...
Convex Hull - Chan's Algorithm O(n log h) - Presentation by Yitian Huang and ...
Amrinder Arora
 
ガウス過程入門
ガウス過程入門ガウス過程入門
ガウス過程入門
ShoShimoyama
 
Chris Sherlock's slides
Chris Sherlock's slidesChris Sherlock's slides
Chris Sherlock's slides
Christian Robert
 
Chapter0
Chapter0Chapter0
Chapter0
guest497e7c
 
Further discriminatory signature of inflation
Further discriminatory signature of inflationFurther discriminatory signature of inflation
Further discriminatory signature of inflation
Laila A
 
mcmc
mcmcmcmc
convex hull
convex hullconvex hull
convex hull
Aabid Shah
 
Hidden Markov Models with applications to speech recognition
Hidden Markov Models with applications to speech recognitionHidden Markov Models with applications to speech recognition
Hidden Markov Models with applications to speech recognition
butest
 
Richard Everitt's slides
Richard Everitt's slidesRichard Everitt's slides
Richard Everitt's slides
Christian Robert
 
Função de mão única
Função de mão únicaFunção de mão única
Função de mão única
XequeMateShannon
 
Introduction to MCMC methods
Introduction to MCMC methodsIntroduction to MCMC methods
Introduction to MCMC methods
Christian Robert
 

What's hot (20)

TheAscoliArzelaTheoremWithApplications
TheAscoliArzelaTheoremWithApplicationsTheAscoliArzelaTheoremWithApplications
TheAscoliArzelaTheoremWithApplications
 
Book chapter-5
Book chapter-5Book chapter-5
Book chapter-5
 
Convex Hull Algorithm Analysis
Convex Hull Algorithm AnalysisConvex Hull Algorithm Analysis
Convex Hull Algorithm Analysis
 
Zero. Probabilystic Foundation of Theoretyical Physics
Zero. Probabilystic Foundation of Theoretyical PhysicsZero. Probabilystic Foundation of Theoretyical Physics
Zero. Probabilystic Foundation of Theoretyical Physics
 
Ordinal Regression and Machine Learning: Applications, Methods, Metrics
Ordinal Regression and Machine Learning: Applications, Methods, MetricsOrdinal Regression and Machine Learning: Applications, Methods, Metrics
Ordinal Regression and Machine Learning: Applications, Methods, Metrics
 
Klt
KltKlt
Klt
 
A bit about мcmc
A bit about мcmcA bit about мcmc
A bit about мcmc
 
Mechanical Engineering Assignment Help
Mechanical Engineering Assignment HelpMechanical Engineering Assignment Help
Mechanical Engineering Assignment Help
 
Monte Caro Simualtions, Sampling and Markov Chain Monte Carlo
Monte Caro Simualtions, Sampling and Markov Chain Monte CarloMonte Caro Simualtions, Sampling and Markov Chain Monte Carlo
Monte Caro Simualtions, Sampling and Markov Chain Monte Carlo
 
Convex Hull - Chan's Algorithm O(n log h) - Presentation by Yitian Huang and ...
Convex Hull - Chan's Algorithm O(n log h) - Presentation by Yitian Huang and ...Convex Hull - Chan's Algorithm O(n log h) - Presentation by Yitian Huang and ...
Convex Hull - Chan's Algorithm O(n log h) - Presentation by Yitian Huang and ...
 
ガウス過程入門
ガウス過程入門ガウス過程入門
ガウス過程入門
 
Chris Sherlock's slides
Chris Sherlock's slidesChris Sherlock's slides
Chris Sherlock's slides
 
Chapter0
Chapter0Chapter0
Chapter0
 
Further discriminatory signature of inflation
Further discriminatory signature of inflationFurther discriminatory signature of inflation
Further discriminatory signature of inflation
 
mcmc
mcmcmcmc
mcmc
 
convex hull
convex hullconvex hull
convex hull
 
Hidden Markov Models with applications to speech recognition
Hidden Markov Models with applications to speech recognitionHidden Markov Models with applications to speech recognition
Hidden Markov Models with applications to speech recognition
 
Richard Everitt's slides
Richard Everitt's slidesRichard Everitt's slides
Richard Everitt's slides
 
Função de mão única
Função de mão únicaFunção de mão única
Função de mão única
 
Introduction to MCMC methods
Introduction to MCMC methodsIntroduction to MCMC methods
Introduction to MCMC methods
 

Similar to iteration-quadratic-equations (1)

Concepts and Problems in Quantum Mechanics, Lecture-II By Manmohan Dash
Concepts and Problems in Quantum Mechanics, Lecture-II By Manmohan DashConcepts and Problems in Quantum Mechanics, Lecture-II By Manmohan Dash
Concepts and Problems in Quantum Mechanics, Lecture-II By Manmohan Dash
Manmohan Dash
 
2 vectors notes
2 vectors notes2 vectors notes
2 vectors notes
Vinh Nguyen Xuan
 
Calc 5.8b
Calc 5.8bCalc 5.8b
Calc 5.8b
hartcher
 
MC0082 –Theory of Computer Science
MC0082 –Theory of Computer ScienceMC0082 –Theory of Computer Science
MC0082 –Theory of Computer Science
Aravind NC
 
Markov chain
Markov chainMarkov chain
Markov chain
Luckshay Batra
 
Stochastic Approximation and Simulated Annealing
Stochastic Approximation and Simulated AnnealingStochastic Approximation and Simulated Annealing
Stochastic Approximation and Simulated Annealing
SSA KPI
 
Generalized Functions, Gelfand Triples and the Imaginary Resolvent Theorem
Generalized Functions, Gelfand Triples and the Imaginary Resolvent TheoremGeneralized Functions, Gelfand Triples and the Imaginary Resolvent Theorem
Generalized Functions, Gelfand Triples and the Imaginary Resolvent Theorem
Michael Maroun
 
PDE Constrained Optimization and the Lambert W-Function
PDE Constrained Optimization and the Lambert W-FunctionPDE Constrained Optimization and the Lambert W-Function
PDE Constrained Optimization and the Lambert W-Function
Michael Maroun
 
Interpolation
InterpolationInterpolation
Interpolation
CAALAAA
 
Statistical Physics Assignment Help
Statistical Physics Assignment HelpStatistical Physics Assignment Help
Statistical Physics Assignment Help
Statistics Assignment Help
 
ResearchPaper
ResearchPaperResearchPaper
ResearchPaper
Daniel Healy
 
Networking Assignment Help
Networking Assignment HelpNetworking Assignment Help
Networking Assignment Help
Computer Network Assignment Help
 
04_AJMS_330_21.pdf
04_AJMS_330_21.pdf04_AJMS_330_21.pdf
04_AJMS_330_21.pdf
BRNSS Publication Hub
 
Project in Calcu
Project in CalcuProject in Calcu
Project in Calcu
patrickpaz
 
Synchronizing Chaotic Systems - Karl Dutson
Synchronizing Chaotic Systems - Karl DutsonSynchronizing Chaotic Systems - Karl Dutson
Synchronizing Chaotic Systems - Karl Dutson
Karl Dutson
 
Q.M.pptx
Q.M.pptxQ.M.pptx
Q.M.pptx
mustafaalasady8
 
Linear algebra havard university
Linear algebra havard universityLinear algebra havard university
Linear algebra havard university
Valentine Orovwegodo
 
project report(1)
project report(1)project report(1)
project report(1)
Conor Bradley
 
2 random variables notes 2p3
2 random variables notes 2p32 random variables notes 2p3
2 random variables notes 2p3
MuhannadSaleh
 
Conference Poster: Discrete Symmetries of Symmetric Hypergraph States
Conference Poster: Discrete Symmetries of Symmetric Hypergraph StatesConference Poster: Discrete Symmetries of Symmetric Hypergraph States
Conference Poster: Discrete Symmetries of Symmetric Hypergraph States
Chase Yetter
 

Similar to iteration-quadratic-equations (1) (20)

Concepts and Problems in Quantum Mechanics, Lecture-II By Manmohan Dash
Concepts and Problems in Quantum Mechanics, Lecture-II By Manmohan DashConcepts and Problems in Quantum Mechanics, Lecture-II By Manmohan Dash
Concepts and Problems in Quantum Mechanics, Lecture-II By Manmohan Dash
 
2 vectors notes
2 vectors notes2 vectors notes
2 vectors notes
 
Calc 5.8b
Calc 5.8bCalc 5.8b
Calc 5.8b
 
MC0082 –Theory of Computer Science
MC0082 –Theory of Computer ScienceMC0082 –Theory of Computer Science
MC0082 –Theory of Computer Science
 
Markov chain
Markov chainMarkov chain
Markov chain
 
Stochastic Approximation and Simulated Annealing
Stochastic Approximation and Simulated AnnealingStochastic Approximation and Simulated Annealing
Stochastic Approximation and Simulated Annealing
 
Generalized Functions, Gelfand Triples and the Imaginary Resolvent Theorem
Generalized Functions, Gelfand Triples and the Imaginary Resolvent TheoremGeneralized Functions, Gelfand Triples and the Imaginary Resolvent Theorem
Generalized Functions, Gelfand Triples and the Imaginary Resolvent Theorem
 
PDE Constrained Optimization and the Lambert W-Function
PDE Constrained Optimization and the Lambert W-FunctionPDE Constrained Optimization and the Lambert W-Function
PDE Constrained Optimization and the Lambert W-Function
 
Interpolation
InterpolationInterpolation
Interpolation
 
Statistical Physics Assignment Help
Statistical Physics Assignment HelpStatistical Physics Assignment Help
Statistical Physics Assignment Help
 
ResearchPaper
ResearchPaperResearchPaper
ResearchPaper
 
Networking Assignment Help
Networking Assignment HelpNetworking Assignment Help
Networking Assignment Help
 
04_AJMS_330_21.pdf
04_AJMS_330_21.pdf04_AJMS_330_21.pdf
04_AJMS_330_21.pdf
 
Project in Calcu
Project in CalcuProject in Calcu
Project in Calcu
 
Synchronizing Chaotic Systems - Karl Dutson
Synchronizing Chaotic Systems - Karl DutsonSynchronizing Chaotic Systems - Karl Dutson
Synchronizing Chaotic Systems - Karl Dutson
 
Q.M.pptx
Q.M.pptxQ.M.pptx
Q.M.pptx
 
Linear algebra havard university
Linear algebra havard universityLinear algebra havard university
Linear algebra havard university
 
project report(1)
project report(1)project report(1)
project report(1)
 
2 random variables notes 2p3
2 random variables notes 2p32 random variables notes 2p3
2 random variables notes 2p3
 
Conference Poster: Discrete Symmetries of Symmetric Hypergraph States
Conference Poster: Discrete Symmetries of Symmetric Hypergraph StatesConference Poster: Discrete Symmetries of Symmetric Hypergraph States
Conference Poster: Discrete Symmetries of Symmetric Hypergraph States
 

iteration-quadratic-equations (1)

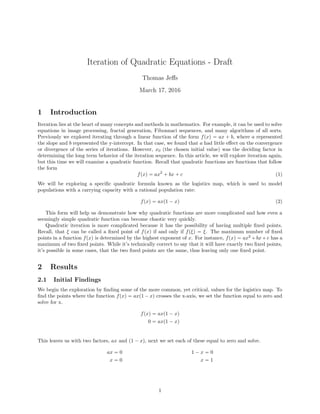
  • 1. Iteration of Quadratic Equations - Draft Thomas Jeffs March 17, 2016 1 Introduction Iteration lies at the heart of many concepts and methods in mathematics. For example, it can be used to solve equations in image processing, fractal generation, Fibonnaci sequences, and many algorithms of all sorts. Previously we explored iterating through a linear function of the form fpxq “ ax ` b, where a represented the slope and b represented the y-intercept. In that case, we found that a had little effect on the convergence or divergence of the series of iterations. However, x0 (the chosen initial value) was the deciding factor in determining the long term behavior of the iteration sequence. In this article, we will explore iteration again, but this time we will examine a quadratic function. Recall that quadratic functions are functions that follow the form fpxq “ ax2 ` bx ` c (1) We will be exploring a specific quadratic formula known as the logistics map, which is used to model populations with a carrying capacity with a rational population rate: fpxq “ axp1 ´ xq (2) This form will help us demonstrate how why quadratic functions are more complicated and how even a seemingly simple quadratic function can become chaotic very quickly. Quadratic iteration is more complicated because it has the possibility of having multiple fixed points. Recall, that ξ can be called a fixed point of fpxq if and only if fpξq “ ξ. The maximum number of fixed points in a function fpxq is determined by the highest exponent of x. For instance, fpxq “ ax2 `bx`c has a maximum of two fixed points. While it’s technically correct to say that it will have exactly two fixed points, it’s possible in some cases, that the two fixed points are the same, thus leaving only one fixed point. 2 Results 2.1 Initial Findings We begin the exploration by finding some of the more common, yet critical, values for the logistics map. To find the points where the function fpxq “ axp1 ´ xq crosses the x-axis, we set the function equal to zero and solve for x. fpxq “ axp1 ´ xq 0 “ axp1 ´ xq This leaves us with two factors, ax and p1 ´ xq, next we set each of these equal to zero and solve. ax “ 0 1 ´ x “ 0 x “ 0 x “ 1 1
  • 2. Therefore for the quadratic equation fpxq “ axp1 ´ xq, intercepts the x-axis at x “ t0, 1u. Because we want to observe the behavior of the logistics map as iterates, we will focus on the domain x “ r0, 1s Next, we will find the critical points of the logistics map. Recall that critical points are points on a curve with a gradient of zero, that is Bf By “ 0, however, because the logistics map is defined only in terms of x, this results in f1 pxq “ 0. In the case of the logistics map, there is only one curve, so we will only see one critical point. fpxq “ ax ´ ax2 f1 pxq “ a ´ 2ax 0 “ a ´ 2ax 0 “ ap1 ´ 2xq 0 “ 1 ´ 2x x “ 1 2 Therefore, x “ 1 2 is the only critical point for the logistics map. Next, we’ll find the fixed points ξ of the logistics map. To find the fixed points of the logistics map, we set the functions fpξq “ ξ and solve for ξ. fpξq “ aξp1 ´ ξq ξ “ aξp1 ´ ξq ξ “ aξ ´ aξ2 0 “ pa ´ 1qξ ´ aξ2 0 “ rpa ´ 1q ´ aξsξ Setting each term equal to zero allows us to see the fixed points of the general equation. ξ “ 0 pa ´ 1q ´ aξ “ 0 aξ “ pa ´ 1q ξ “ pa ´ 1q a For this quadratic function fpxq, the fixed points will always be: ξ “ t0, a ´ 1 a u (3) Lastly, we will attempt to define a general equation for the iteration of the logistics map. Using the abbreviated form for iteration, xn “ apxn´1 ´ x2 n´1q, x0 “ x0 x1 “ apx0 ´ x2 0q x1 “ apx0 ´ x2 0q x2 “ apx1 ´ x2 1q x2 “ arapx0 ´ x2 0q ´ a2 px0 ´ x2 0q2 s x3 “ apx2 ´ x2 2q x3 “ ararapx0 ´ x2 0q ´ a2 px0 ´ x2 0q2 s ´ a2 rapx0 ´ x2 0q ´ a2 px0 ´ x2 0q2 s2 s expand x3 x3 “ ara2 r´ax4 0 ` 2ax3 0 ` p´a ´ 1qx2 0 ` x0s ´ r´ax4 0 ` 2ax3 0 ` p´a ´ 1qx2 0 ` x0s2 s After just 3 iterations, it’s clear that the general solution for xn would be far too complex to evaluate easily. In order to observe the behavior of the iterations over time, we’ll use a different method. We will use a cobweb plot. A cobweb plot is a special tool which displays the values of an iteration sequence as they appear on the graph of the function itself. The graph is developed by graphing the function fpxq, along with the line y “ x. Lastly, for each iteration value we plot a line joining segments px0, 0q to px0, x1q, then px1, x1q to px1, x2q and so on until observations can be made. 2
  • 3. a x0 Limit ξ “ 0 ξ “ a´1 a 0 .5 x “ 0 Attractor Repeller 0.5 .5 x “ 0 Attractor Repeller 1.0 .5 x « 0 Attractor Repeller 1.5 .5 x « 0.35 Attractor Repeller 2.0 .5 x “ .5 Repeller Repeller 2.5 .5 x « .66 Repeller Attractor 3.0 .5 x « .66 Repeller Attractor 3.5 .5 Divergent Repeller Attractor 4.0 .5 x “ 1 Repeller Repeller Table 1: Observations of the Cobweb plots in the ranges a “ r0, 4s and holding x0 “ 0.5. 2.2 Cobwebs Now that we have some important values for the logistics map, we’ll start to evaluate how the function behaves as we iterate the function using chosen initial values for x0 and a. We will use cobweb graphs to help illustrate how the iteration behaves over time. In order to understand the results, it’s important to understand the following definitions: Definition Attractor - A set of numerical values toward which a system tends to move towards, for a range of system conditions. See Figure 1 for an example of an attractor. Definition Repeller - A set of numerical values which a system tends to move away from over time, for a range of system conditions. In our case, we will be examining the attraction or repulsion from the fixed points, ξ “ 0, a´1 a , using different initial values for a and x0. As we explored the cobweb graphs of several different values, we found that the value for x0, inside the domain of x0 “ r0, 1s, didn’t have an effect on whether or not the iteration would converge, or diverge. Instead, the value of x0, only affected how quickly the iteration sequence would converge or diverge to its attraction/repellent points. When x0 was close to the attracting fixed point, it would use fewer iterations to converge. However, when x0 is outside of the specified domain, the iteration will diverge. The results lead to an exploration of when a fixed point becomes an attractor or repeller. Upon exami- nation, the attraction property is based on the slope at the fixed point. To find the slope, we evaluate the derivative of fpxq at the fixed points ξ “ 0, a´1 a . fpxq “ ax ´ ax2 f1 pxq “ a ´ 2ax f1 p0q “ a ´ 2ap0q f1 p a ´ 1 a q “ a ´ 2ap a ´ 1 a q f1 p a ´ 1 a q “ a ´ 2pa ´ 1q f1 p0q “ a f1 p a ´ 1 a q “ 2 ´ a As we can see, the slope at the fixed point x “ 0 is reflected as the value of a, while the slope at the fixed point x “ a´1 a follows the linear equation m “ 2 ´ a. Focusing on the slope at the non-zero fixed point, we can see that when 1 ă a ă 3, the fixed point will be an attractor. This contradicts the observations that we made in Table 1, where the non-zero fixed point didn’t show attraction until a “ 2.5. This is one of the limitations of the cobweb graph, the math shows conclusively when the non-zero fixed point will be 3
  • 4. Figure 1: Cobweb graph were a “ 2.9 and x0 “ 0.45. an attractor, but the cobweb graph can’t show the attraction property unless the value of x0 is sufficiently far enough away from the fixed point to demonstrate attraction or repulsion. We can further prove that the a “ r1, 3s will attract to the non-zero fixed point by proving that any attracting fixed point has a specified interval: Claim: If |f1 pξq| ă M ă 1, Then ξ is an attractor. Where M is a constant. Proof: lim xÑξ | fpxq ´ fpξq x ´ ξ | ă M ă 1 lim xÑξ | fpxq ´ ξ x ´ ξ | ă M ă 1 This implies, by the definition of limit, that there is an interval[I] of values containing ξ, such that the equation is true. Thus, | fpxq ´ ξ x ´ ξ | ă M |fpxq ´ ξ| ă M|x ´ ξ|, for all x in I ˝ QED As defined, M ă 1, meaning that the two sides will get closer and closer as time moves on. Thus showing that the fixed point ξ will be an attractor. 2.3 K-cycles Table 1 showed an interesting anomaly around a “ 3.5, the cobweb graph appeared to be divergent, because the ”legs” of the graph didn’t seem to be moving towards a single value. This behavior is defined as k-cycles, where k represents the number of values that the iteration sequence seems to be ”settling” on. An example of a 3-cycle can be seen in Figure 3, it’s clear that the graph isn’t moving towards one single value. Instead, the sequence has ”settled” on 3 values that continue to recur in the iteration sequence. In the case of Figure 3, the value of a “ 3.835 produces a sequence with resulting values of fp3.835q “ r¨ ¨ ¨ , 0.4945144, 0.9586346, 0.1520743, 0.4945144, 0.9586346, 0.1520743, ¨ ¨ ¨ s As we’ll see later, this 3-cycle is a bit of a unicorn. 4
  • 5. Figure 2: Cobweb graph were a “ 0.75 and x0 “ 0.5. Figure 3: Cobweb graph were a “ 3.835 and x0 “ 0.5, this is an example of a 3-cycle. 5
  • 6. Figure 4: Feigenbaum diagram for a “ r0, 4s. Figure 5: Feigenbaum diagram for a “ r2.8, 4s. 2.4 Feigenbaum To explore the number of k-cycles each possible a value can produce, and to see a clearer picture of what happens to the quadratic iterations after a “ 3 we turn to what’s known as a Feigenbaum diagram. This diagram displays the values of x versus the value of a. Figure 4 shows the Feigenbaum diagram for our logistics map. The diagram helps us to see that in certain intervals, the behavior is very predictable. As you can see, the behavior meets our expectations right up until a “ 3, then it bifurcates into two branches. A short time later, at around a “ 3.4 it bifurcates again. This continues until there are so many branches that it’s impossible to determine what’s going on, this is called Chaos. It’s clear that there are 3 distinct areas of the diagram based on the range of a. In the range a “ r0, 1s, we see that the value of x is constant, in fact, it’s constant x “ 0. If we look back at the original logistics map iteration sequence, we can see that for values of a ă 1, the sequence coefficient a gets smaller and smaller. As we get further into the iterations, the resultant number gets smaller and smaller. Also, we can observe the slope at the fixed point f1 p0q “ a, meaning that when ´1 ą a ą 1, then the fixed point x “ 0 is an attractor. The next interval a “ r1, 3s behaves exactly as expected. As we defined earlier, the non-zero fixed point is an attractor when a falls inside this interval. Thus, each point of convergence is mapped following the line that represents x “ a´1 a , hence the curved shape. The last interval is the most interesting, a “ r3, 4s is the beginning of the k-cycle period, shown in Figure 6
  • 7. Figure 6: Feigenbaum diagram for a “ r3.825, 3.85s. 5. Each distinct point represents a value for x for each given a value. Traveling up the graph, it’s possible to see how many cycles a chosen value of a will produce. For example, if we select a “ 3.1, we should see that it is a 2-cycle and that it will settle on two values over time. fp3.1q “ r¨ ¨ ¨ , 0.7645665, 0.5580141, 0.7645665, 0.5580141, 0.7645665, 0.5580141, ¨ ¨ ¨ s As expected, the values for x bounce between 0.7645665 and 0.5580141. Looking further along the axis, we see a point where the bifurcation seems to fold back in on itself, this section has been highlighted in Figure 6. This is where our magic unicorn of the 3-cycle can be found. As we know, bifurcation is basically a function line splitting into two directions. So, you might think that given a number of bifurcations, you shouldn’t see any odd sets. But this figure demonstrates a set of 3 and 5-cycles. 3 Summary As we’ve seen, even seemingly simple quadratic equations can produce very unexpected results. In this case we evaluated the logistic map and saw that it was easy to predict the behavior of the functions iterations within a very small range. Anything after a “ 4 diverged almost immediately, except in the cases where x0 “ a´1 a , ni which case, the sequence converged immediately. I presume that the limit of a “ 4 is related to the position of the function. For instance, if the function were shifted higher in the y-axis, I believe this would increase the highest possible value of a. It seems that a rational relationship exists between the line y “ x and fpxq. And that this ratio represents the maximum value of a. This is an excellent introduction to chaos and how easily it can rear it’s ugly head. We were able to observe that fixed points are very important in quadratic iteration. If we were to expand beyond powers of 2 quadratics, we would see that the number of possible fixed points is delegated by the highest order exponent. For example, x3 will have a maximum of 3 fixed points. All fixed points act similar to magnetic poles, you can’t have two attractors or two repellers nearest to each other. I assume that the value of a and it’s position relative to an attractor and repeller will determine how quickly it will break down into chaos. But alas, we will have to explore that another time. 7