Download to read offline


![CASE Network Studies & Analyses No.453 – Innovation and the growth of service firms: The ...
15
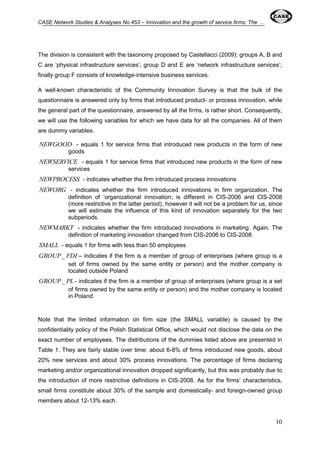
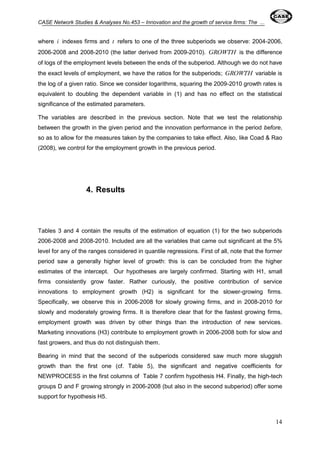
Table 6. Results of quantile regression of variable GROWTH [2006-2008]
p5 p25 p50 p75 p95
(Intercept) -0.32 *** -0.08264 *** 0.00240 0.12319 *** 0.44629 ***
GROWTH
0.03271 0.08409 *** 0.15512 *** 0.23875 *** 0.19132 ***
[2004-2006]
NEWSERVICE 0.06204 * 0.01268 0.01392 0.00682 -0.00573
NEWMARKT 0.05863 ** 0.01590 0.01194 0.04284 ** 0.07026
SMALL -0.01942 0.06103 *** 0.08886 *** 0.13237 *** 0.27835 ***
GROUP_FDI 0.04712 * 0.03112 *** 0.01610 0.00216 0.12891
IND D -0.03977 0.05407 * 0.03842 ** 0.08365 0.14353
IND F 0.09882 *** 0.05850 *** 0.04408 *** -0.00290 -0.10417
Note: Numbers of columns are estimated effects of the explanatory variables on the growth of firms for which the
explained variable is in the range from zero to the respective percentile
*,**,*** denotes significance at the 1%, 5% and 10% level respectively
Table 7. Results of quantile regression of variable GROWTH [2008-2010]
p5 p25 p50 p75 p95
(Intercept) -0.45092 *** -0.13450 *** -0.02361 *** 0.04806 *** 0.32337 ***
GROWTH
-0.14807 0.00248 0.02939 *** 0.13233 *** 0.18829 ***
[2006-2008]
NEWSERVICE 0.21322 ** 0.08291 *** 0.01587 *** 0.00014 0.05168
NEWPROCESS -0.24651 ** -0.04296 ** -0.00457 -0.02288 -0.07849
SMALL -0.02740 0.00962 0.01783 *** 0.03453 ** 0.12837 **
IND D 0.07993 -0.03549 0.00999 0.02085 * 0.04384
IND F -0.02378 -0.02334 0.00410 0.05447 *** -0.07353
Note: Numbers of columns are estimated effects of the explanatory variables on the growth of firms for which the
explained variable is in the range from zero to the respective percentile
*,**,*** denotes significance at the 1%, 5% and 10% level respectively](https://image.slidesharecdn.com/cnsa2013453-141023072038-conversion-gate02/85/CASE-Network-Studies-and-Analyses-453-Innovation-and-the-Growth-of-Service-Firms-The-Polish-Case-16-320.jpg)


The document investigates the relationship between innovation performance and employment growth in Polish service firms from 2004 to 2009. It finds that firms introducing new services or marketing techniques experienced stronger growth, while process innovations often led to employment reductions, primarily during economic downturns. The study emphasizes the importance of macroeconomic conditions on the impact of innovation on employment and contributes to the literature on innovation in the service sector.


