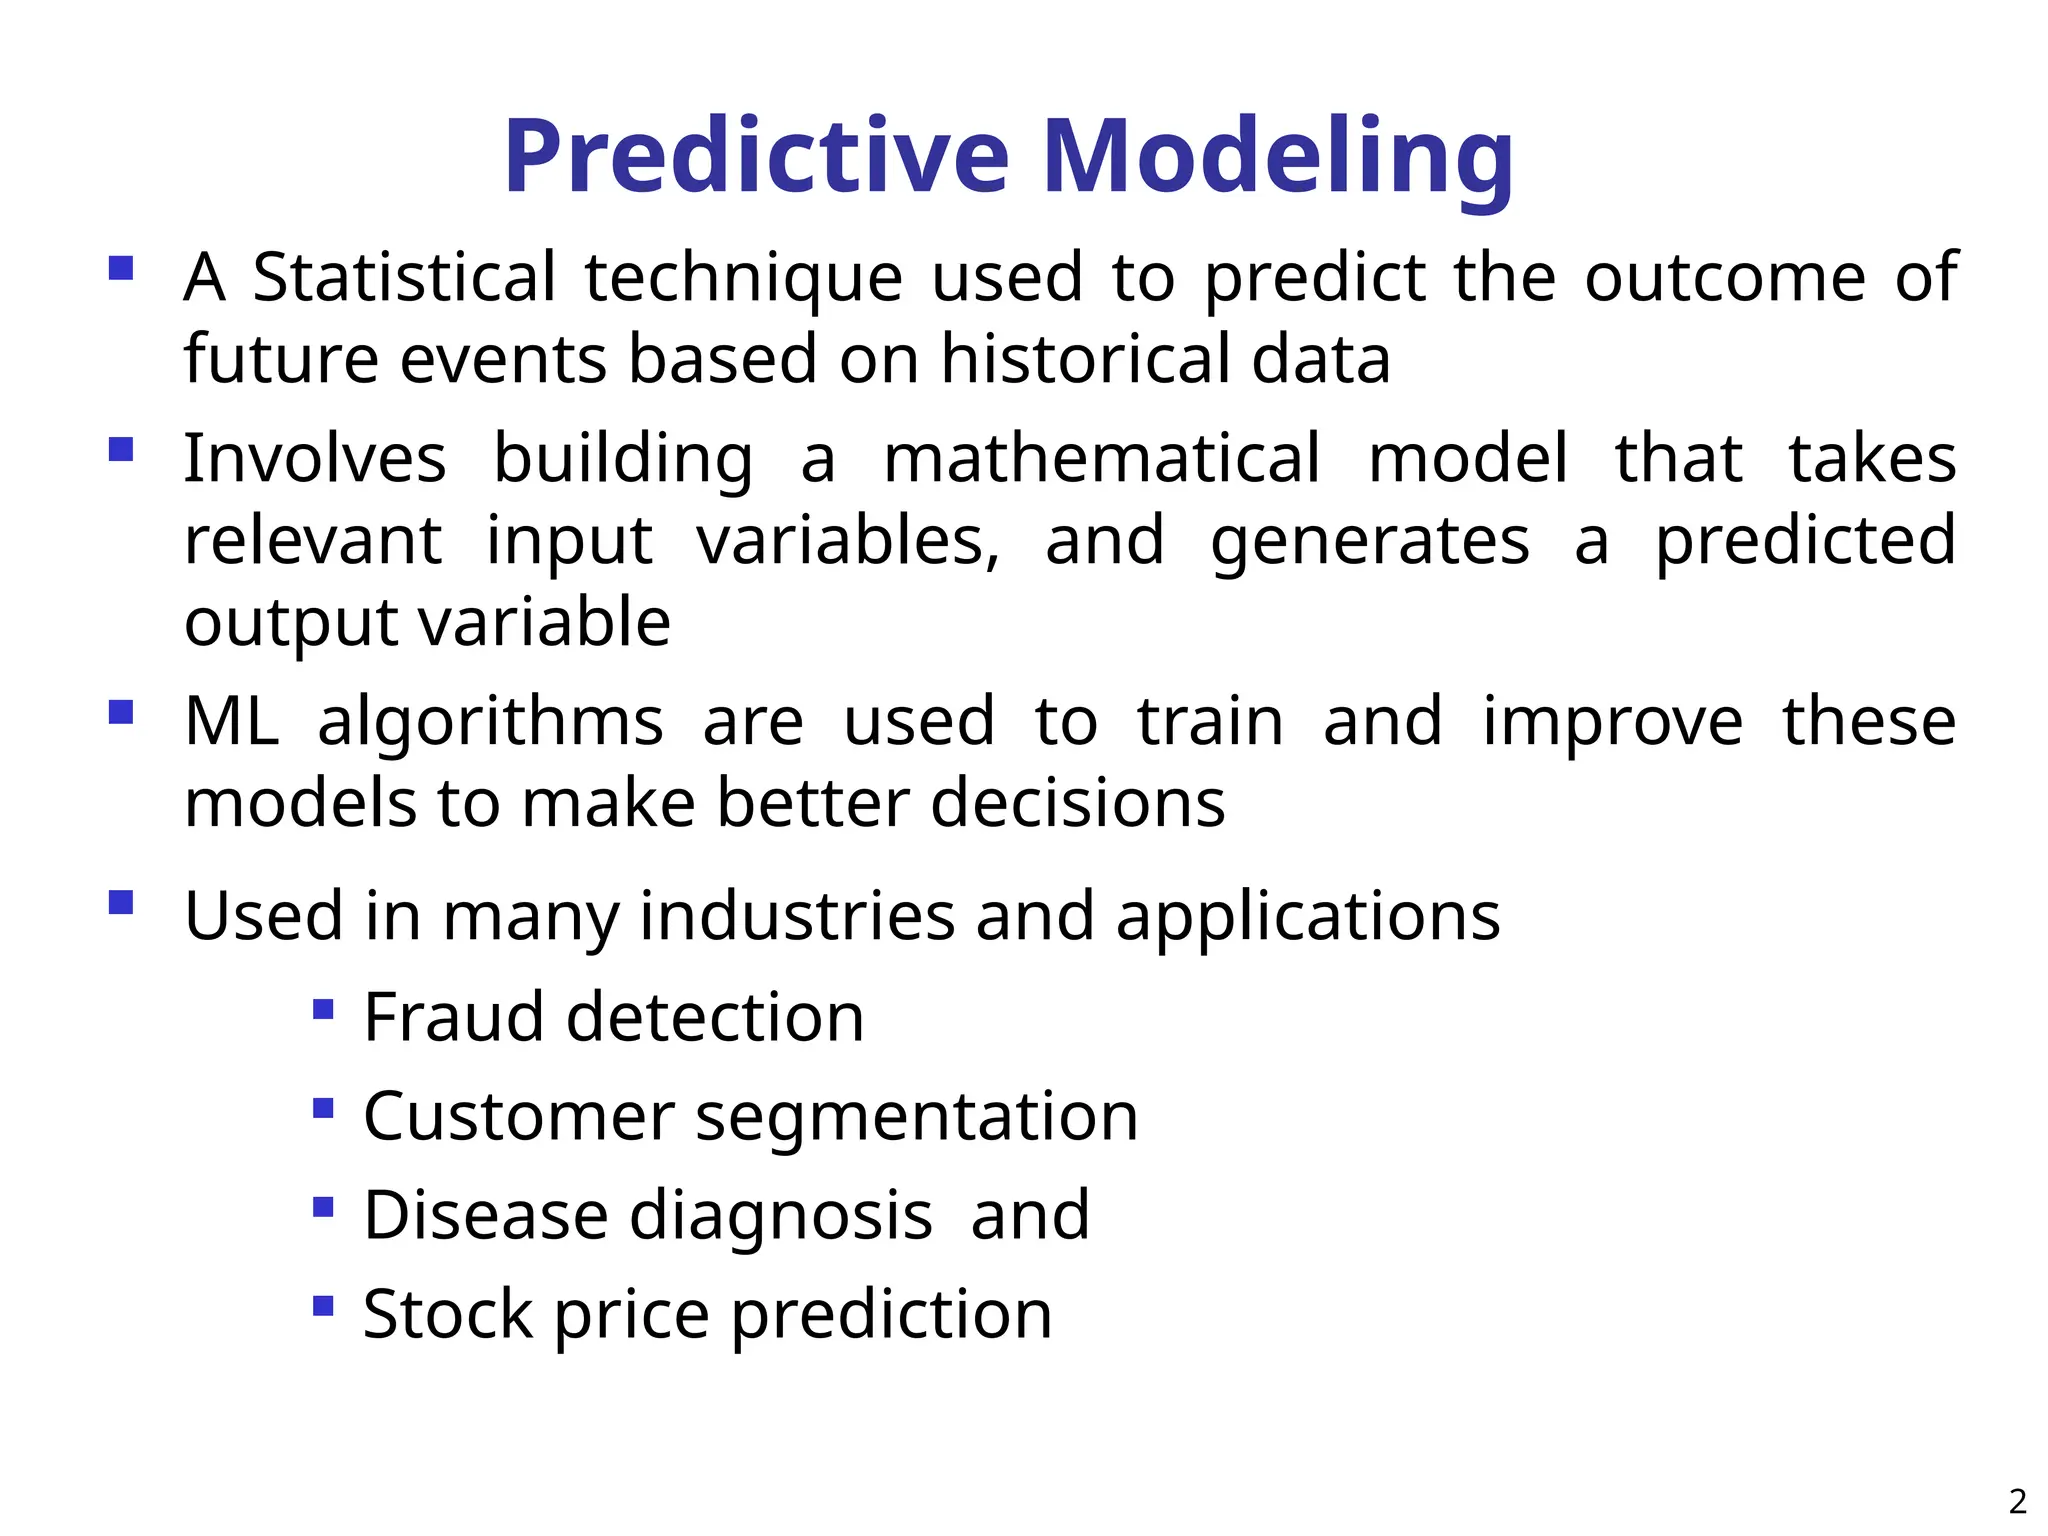
Predictive Modeling
AStatistical technique used to predict the outcome of
future events based on historical data
Involves building a mathematical model that takes
relevant input variables, and generates a predicted
output variable
ML algorithms are used to train and improve these
models to make better decisions
Used in many industries and applications
Fraud detection
Customer segmentation
Disease diagnosis and
Stock price prediction
2
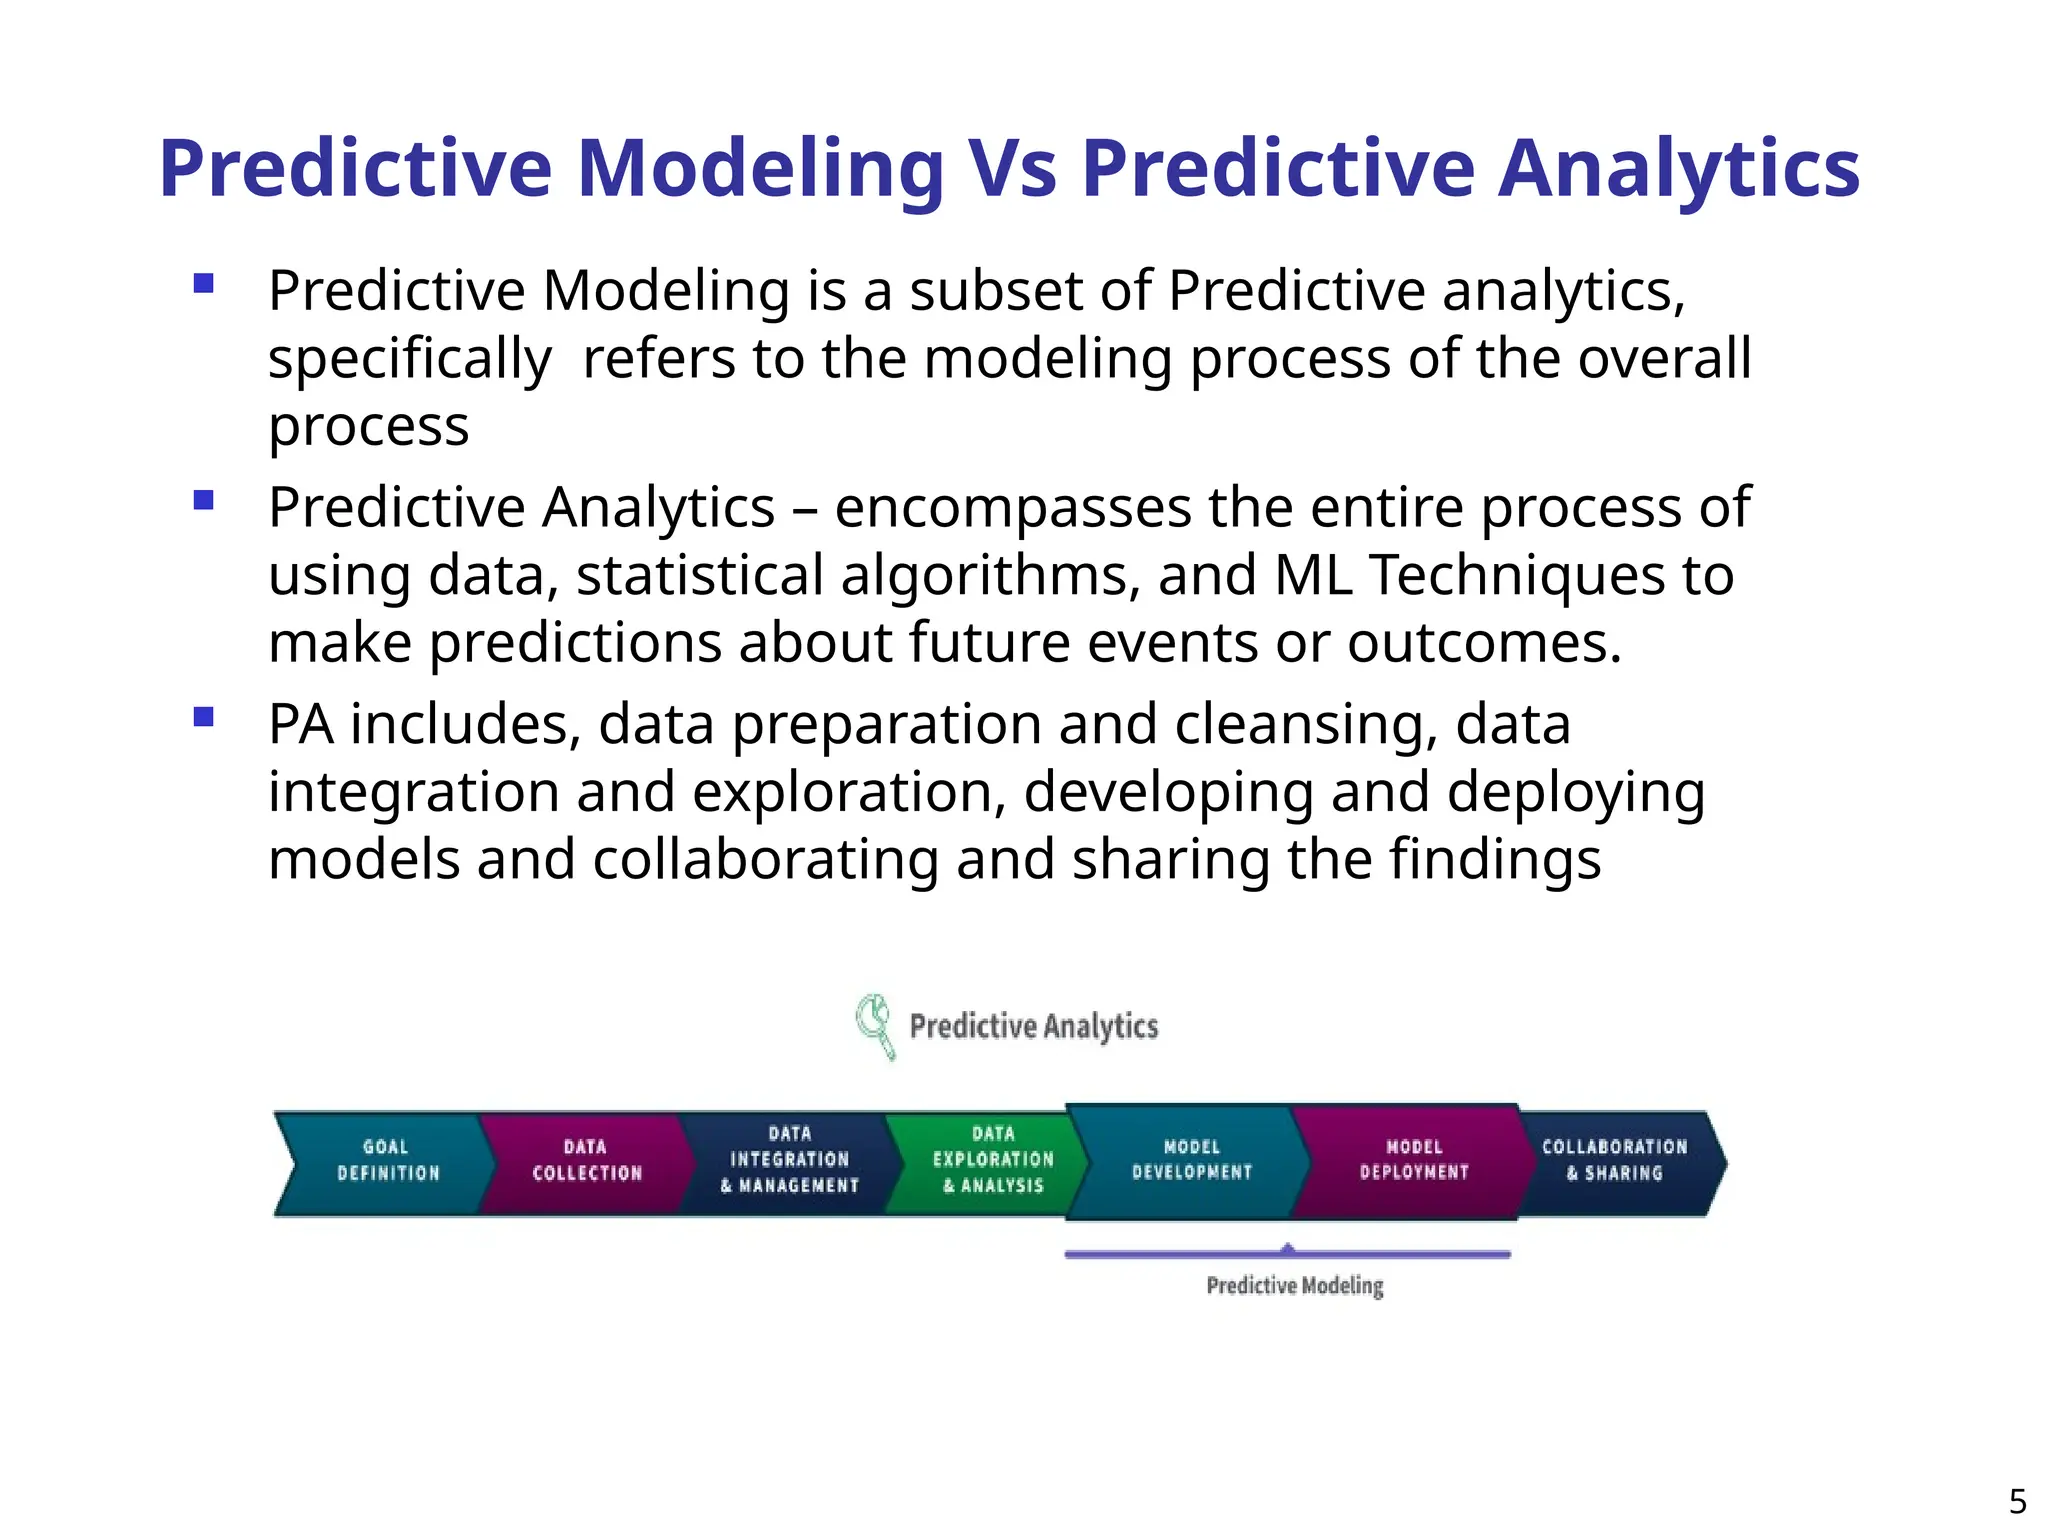
Predictive Modeling VsPredictive Analytics
Predictive Modeling is a subset of Predictive analytics,
specifically refers to the modeling process of the overall
process
Predictive Analytics – encompasses the entire process of
using data, statistical algorithms, and ML Techniques to
make predictions about future events or outcomes.
PA includes, data preparation and cleansing, data
integration and exploration, developing and deploying
models and collaborating and sharing the findings
5
6.
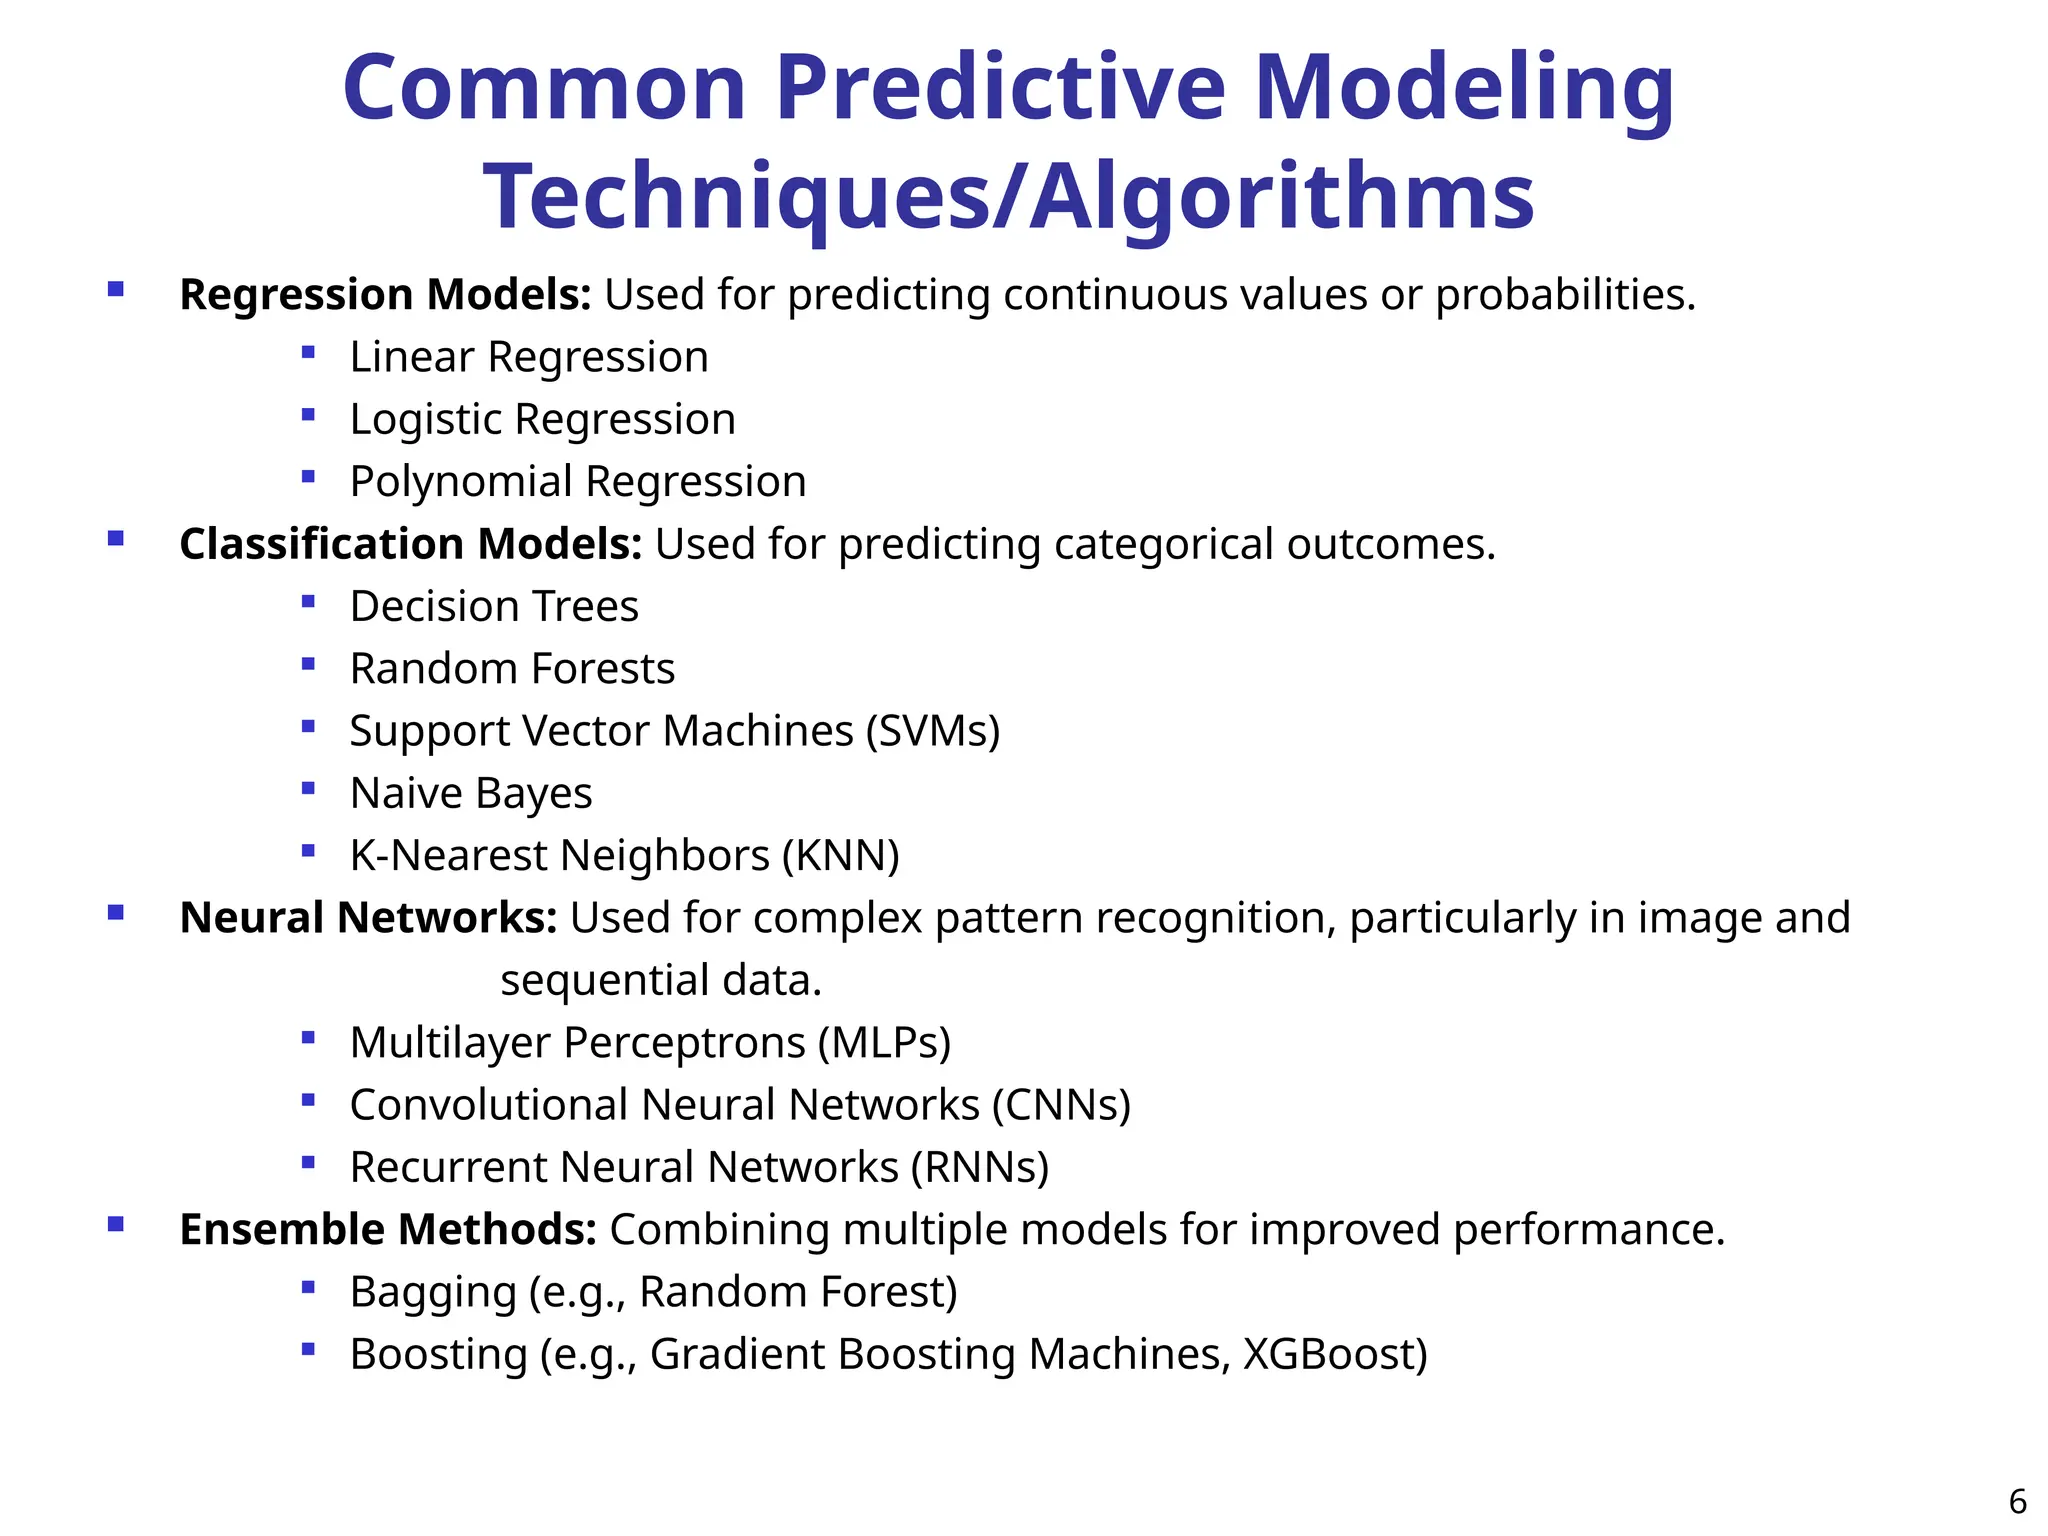
Common Predictive Modeling
Techniques/Algorithms
Regression Models: Used for predicting continuous values or probabilities.
Linear Regression
Logistic Regression
Polynomial Regression
Classification Models: Used for predicting categorical outcomes.
Decision Trees
Random Forests
Support Vector Machines (SVMs)
Naive Bayes
K-Nearest Neighbors (KNN)
Neural Networks: Used for complex pattern recognition, particularly in image and
sequential data.
Multilayer Perceptrons (MLPs)
Convolutional Neural Networks (CNNs)
Recurrent Neural Networks (RNNs)
Ensemble Methods: Combining multiple models for improved performance.
Bagging (e.g., Random Forest)
Boosting (e.g., Gradient Boosting Machines, XGBoost)
6
7.
Regression Models
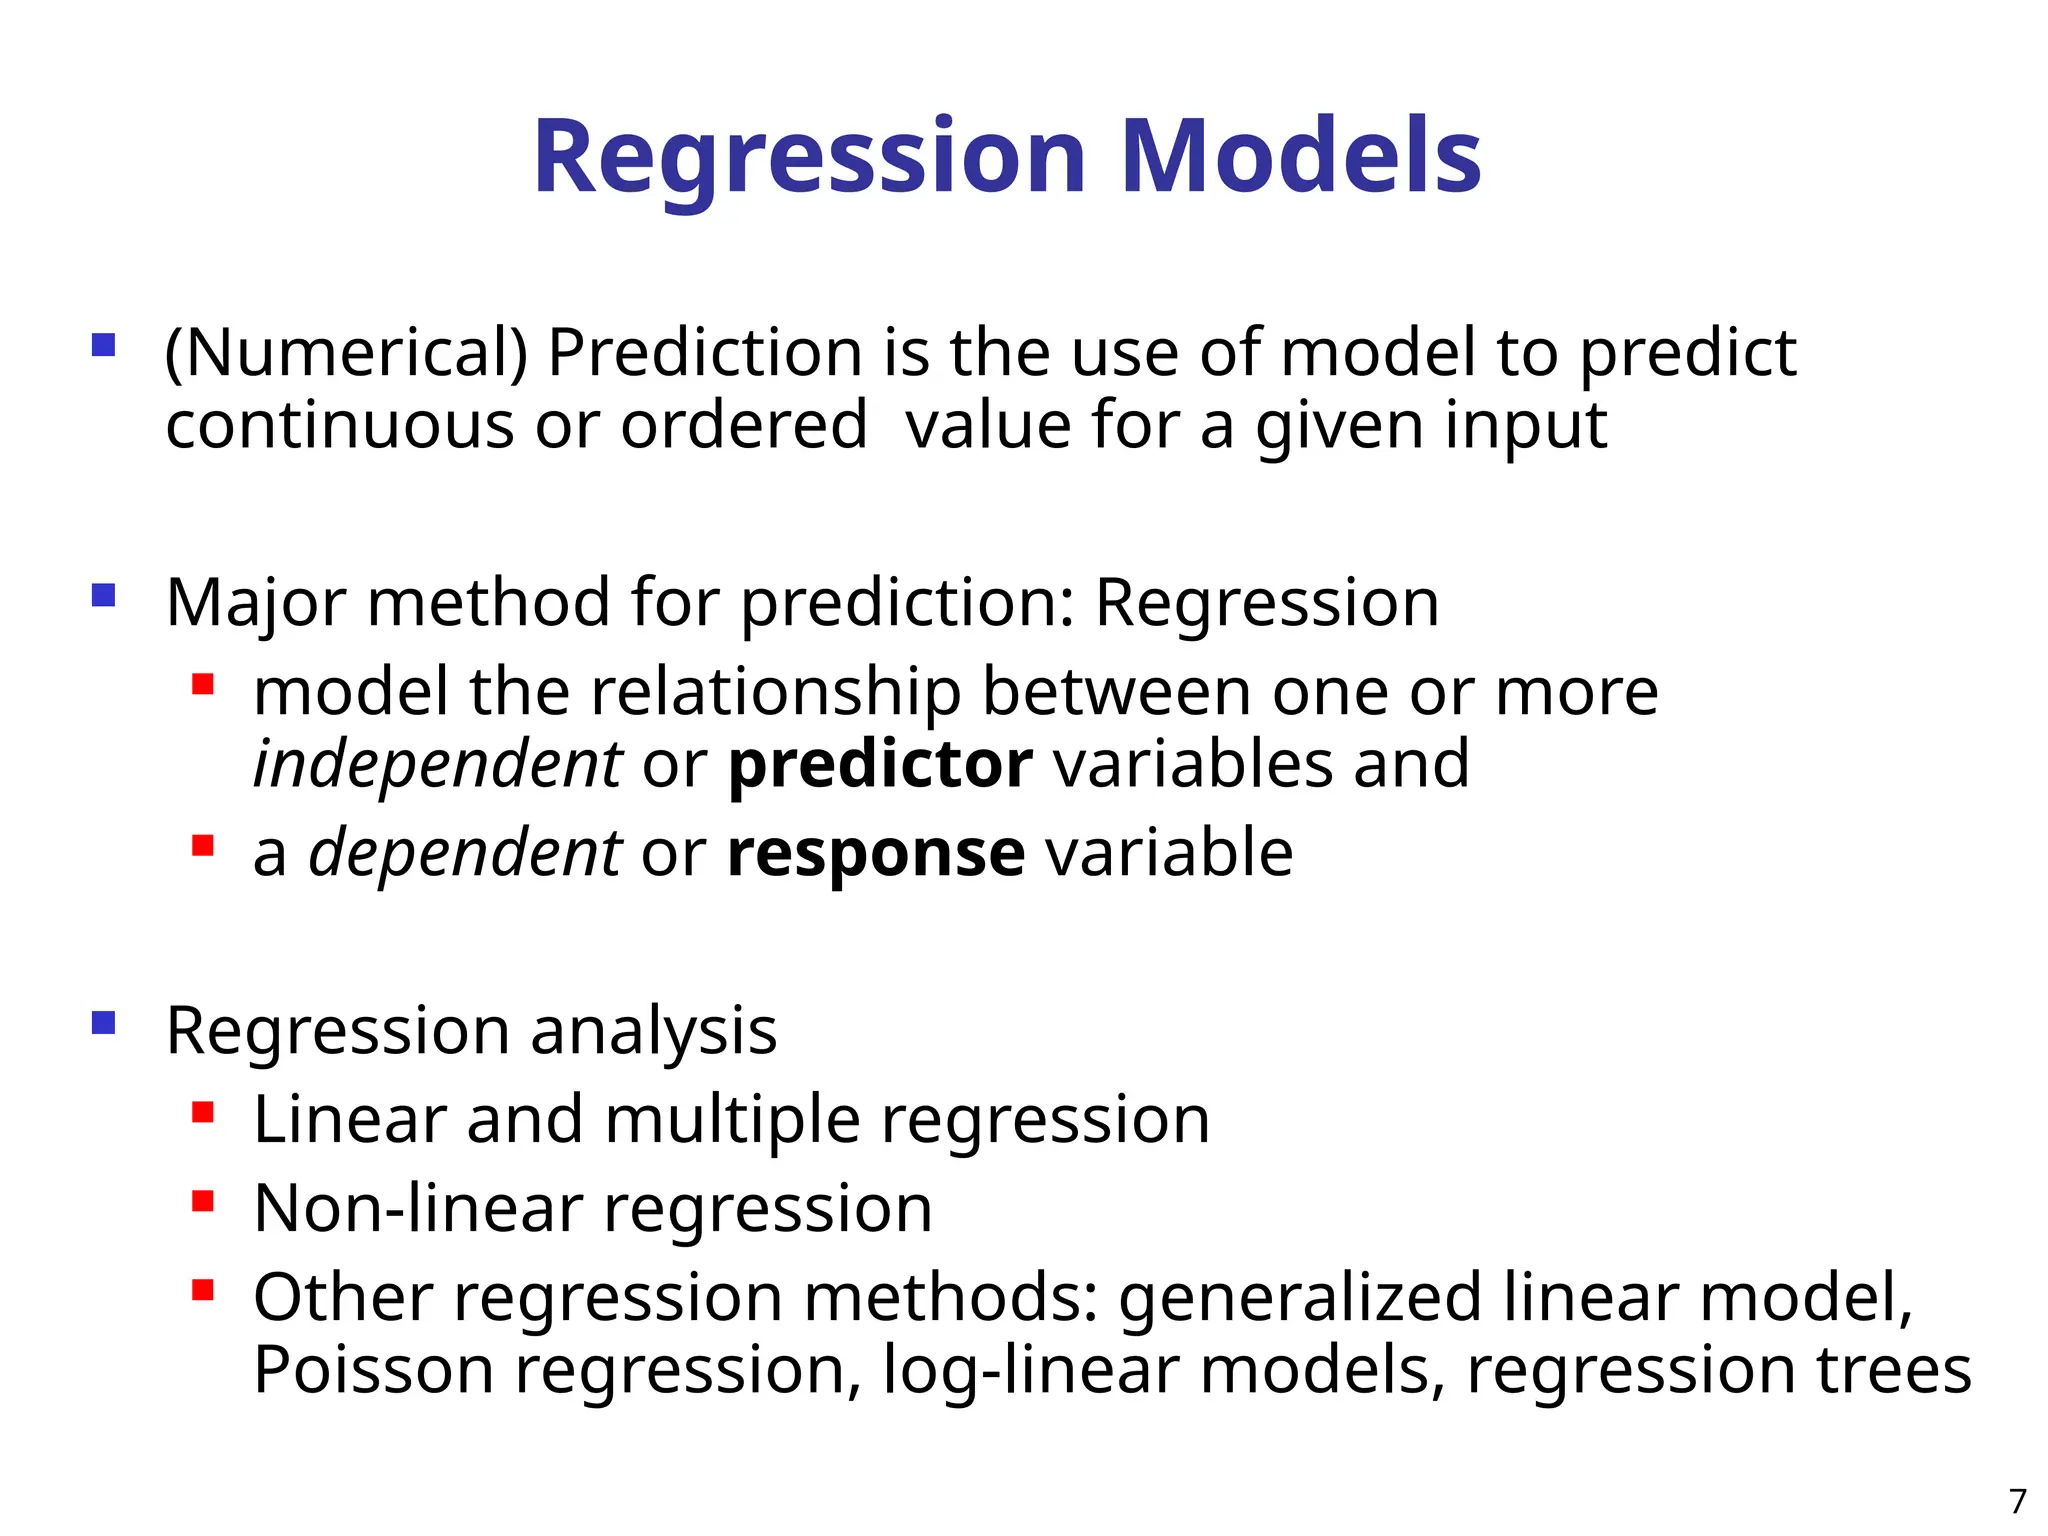
(Numerical)Prediction is the use of model to predict
continuous or ordered value for a given input
Major method for prediction: Regression
model the relationship between one or more
independent or predictor variables and
a dependent or response variable
Regression analysis
Linear and multiple regression
Non-linear regression
Other regression methods: generalized linear model,
Poisson regression, log-linear models, regression trees
7
8.
Linear Regression
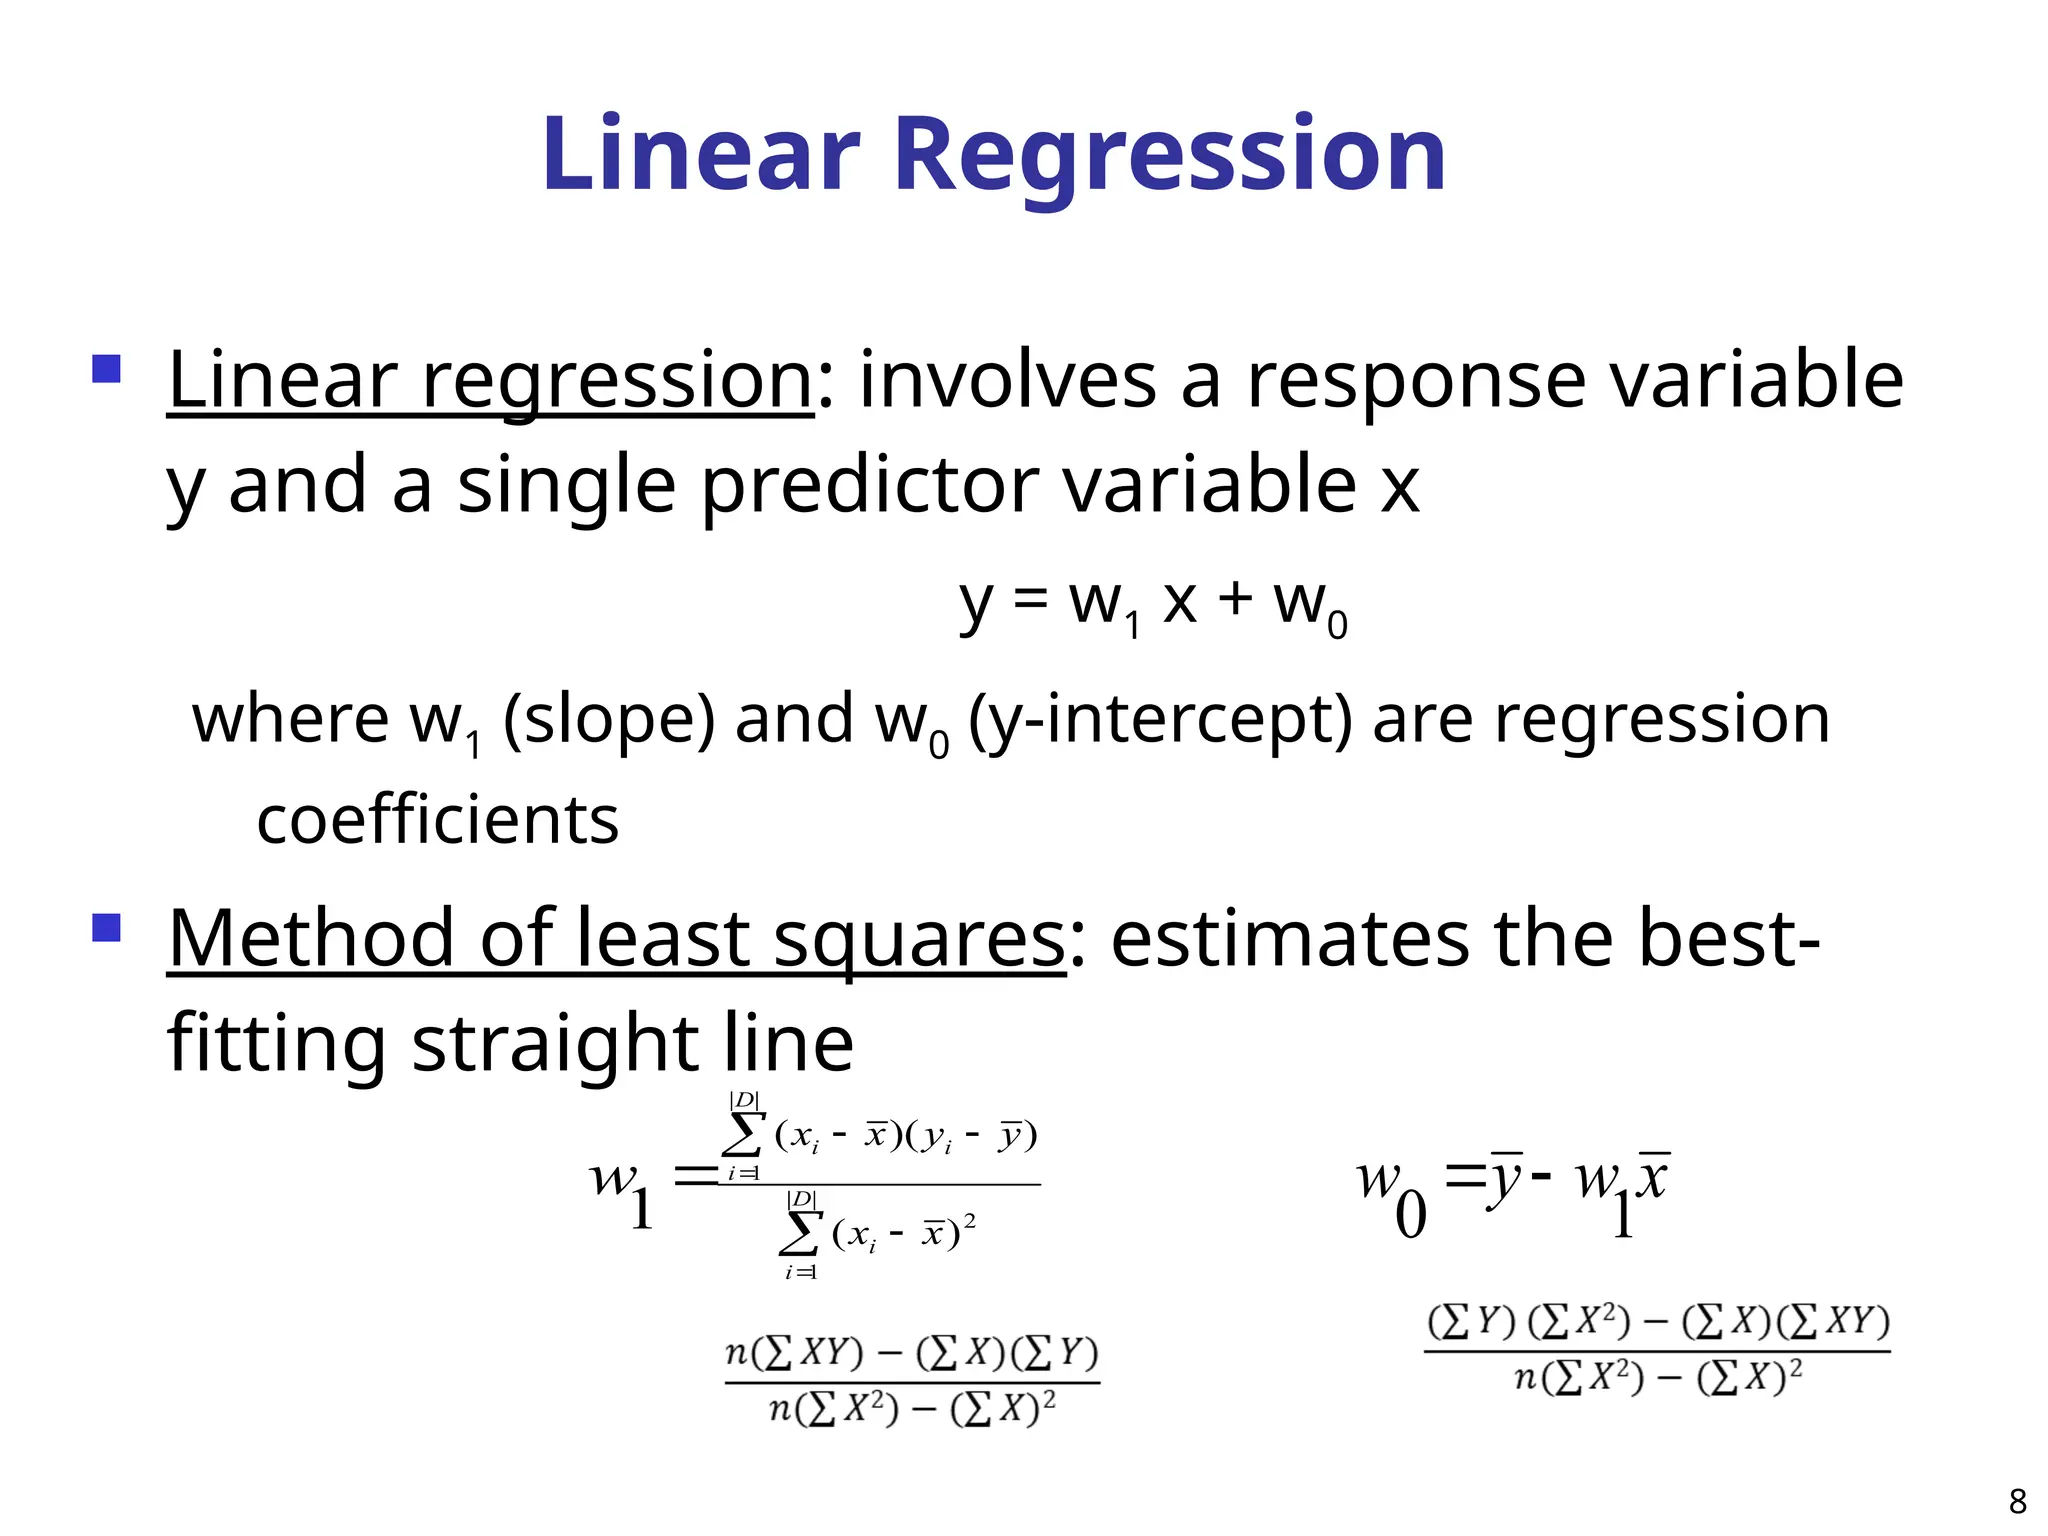
Linearregression: involves a response variable
y and a single predictor variable x
y = w1 x + w0
where w1 (slope) and w0 (y-intercept) are regression
coefficients
Method of least squares: estimates the best-
fitting straight line
|
|
1
2
|
|
1
)
(
)
)(
(
1 D
i
i
D
i
i
i
x
x
y
y
x
x
w x
w
y
w
1
0
8
9.
Example
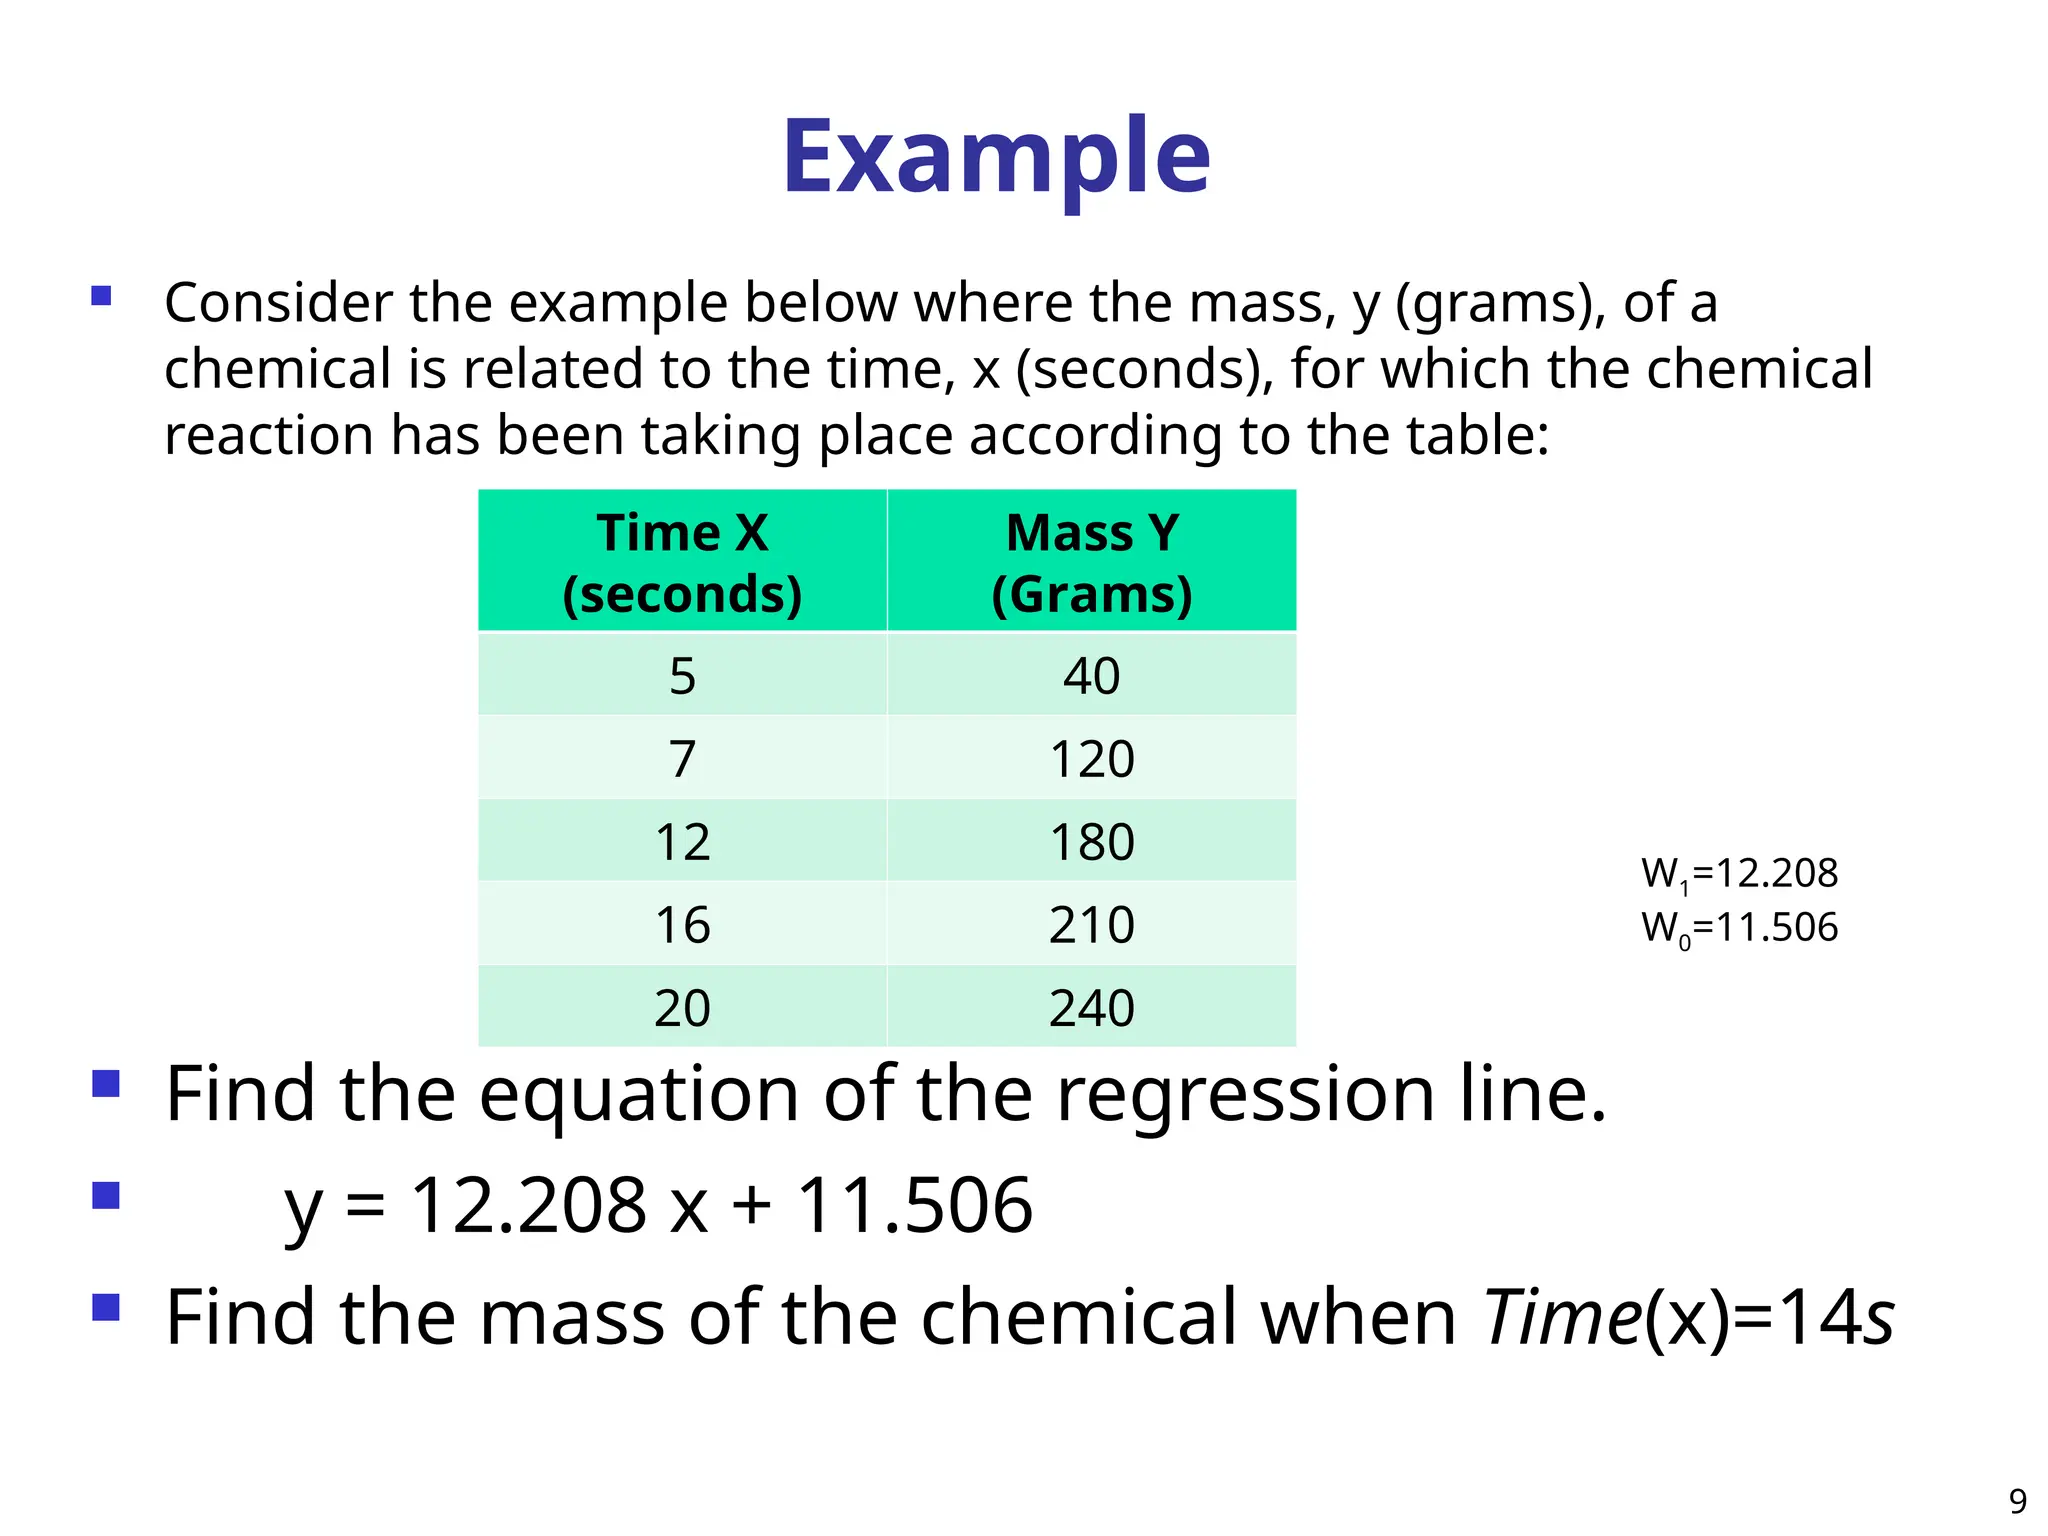
Consider theexample below where the mass, y (grams), of a
chemical is related to the time, x (seconds), for which the chemical
reaction has been taking place according to the table:
Find the equation of the regression line.
y = 12.208 x + 11.506
Find the mass of the chemical when Time(x)=14s
9
Time X
(seconds)
Mass Y
(Grams)
5 40
7 120
12 180
16 210
20 240
W1=12.208
W0=11.506
10.
Salary Data
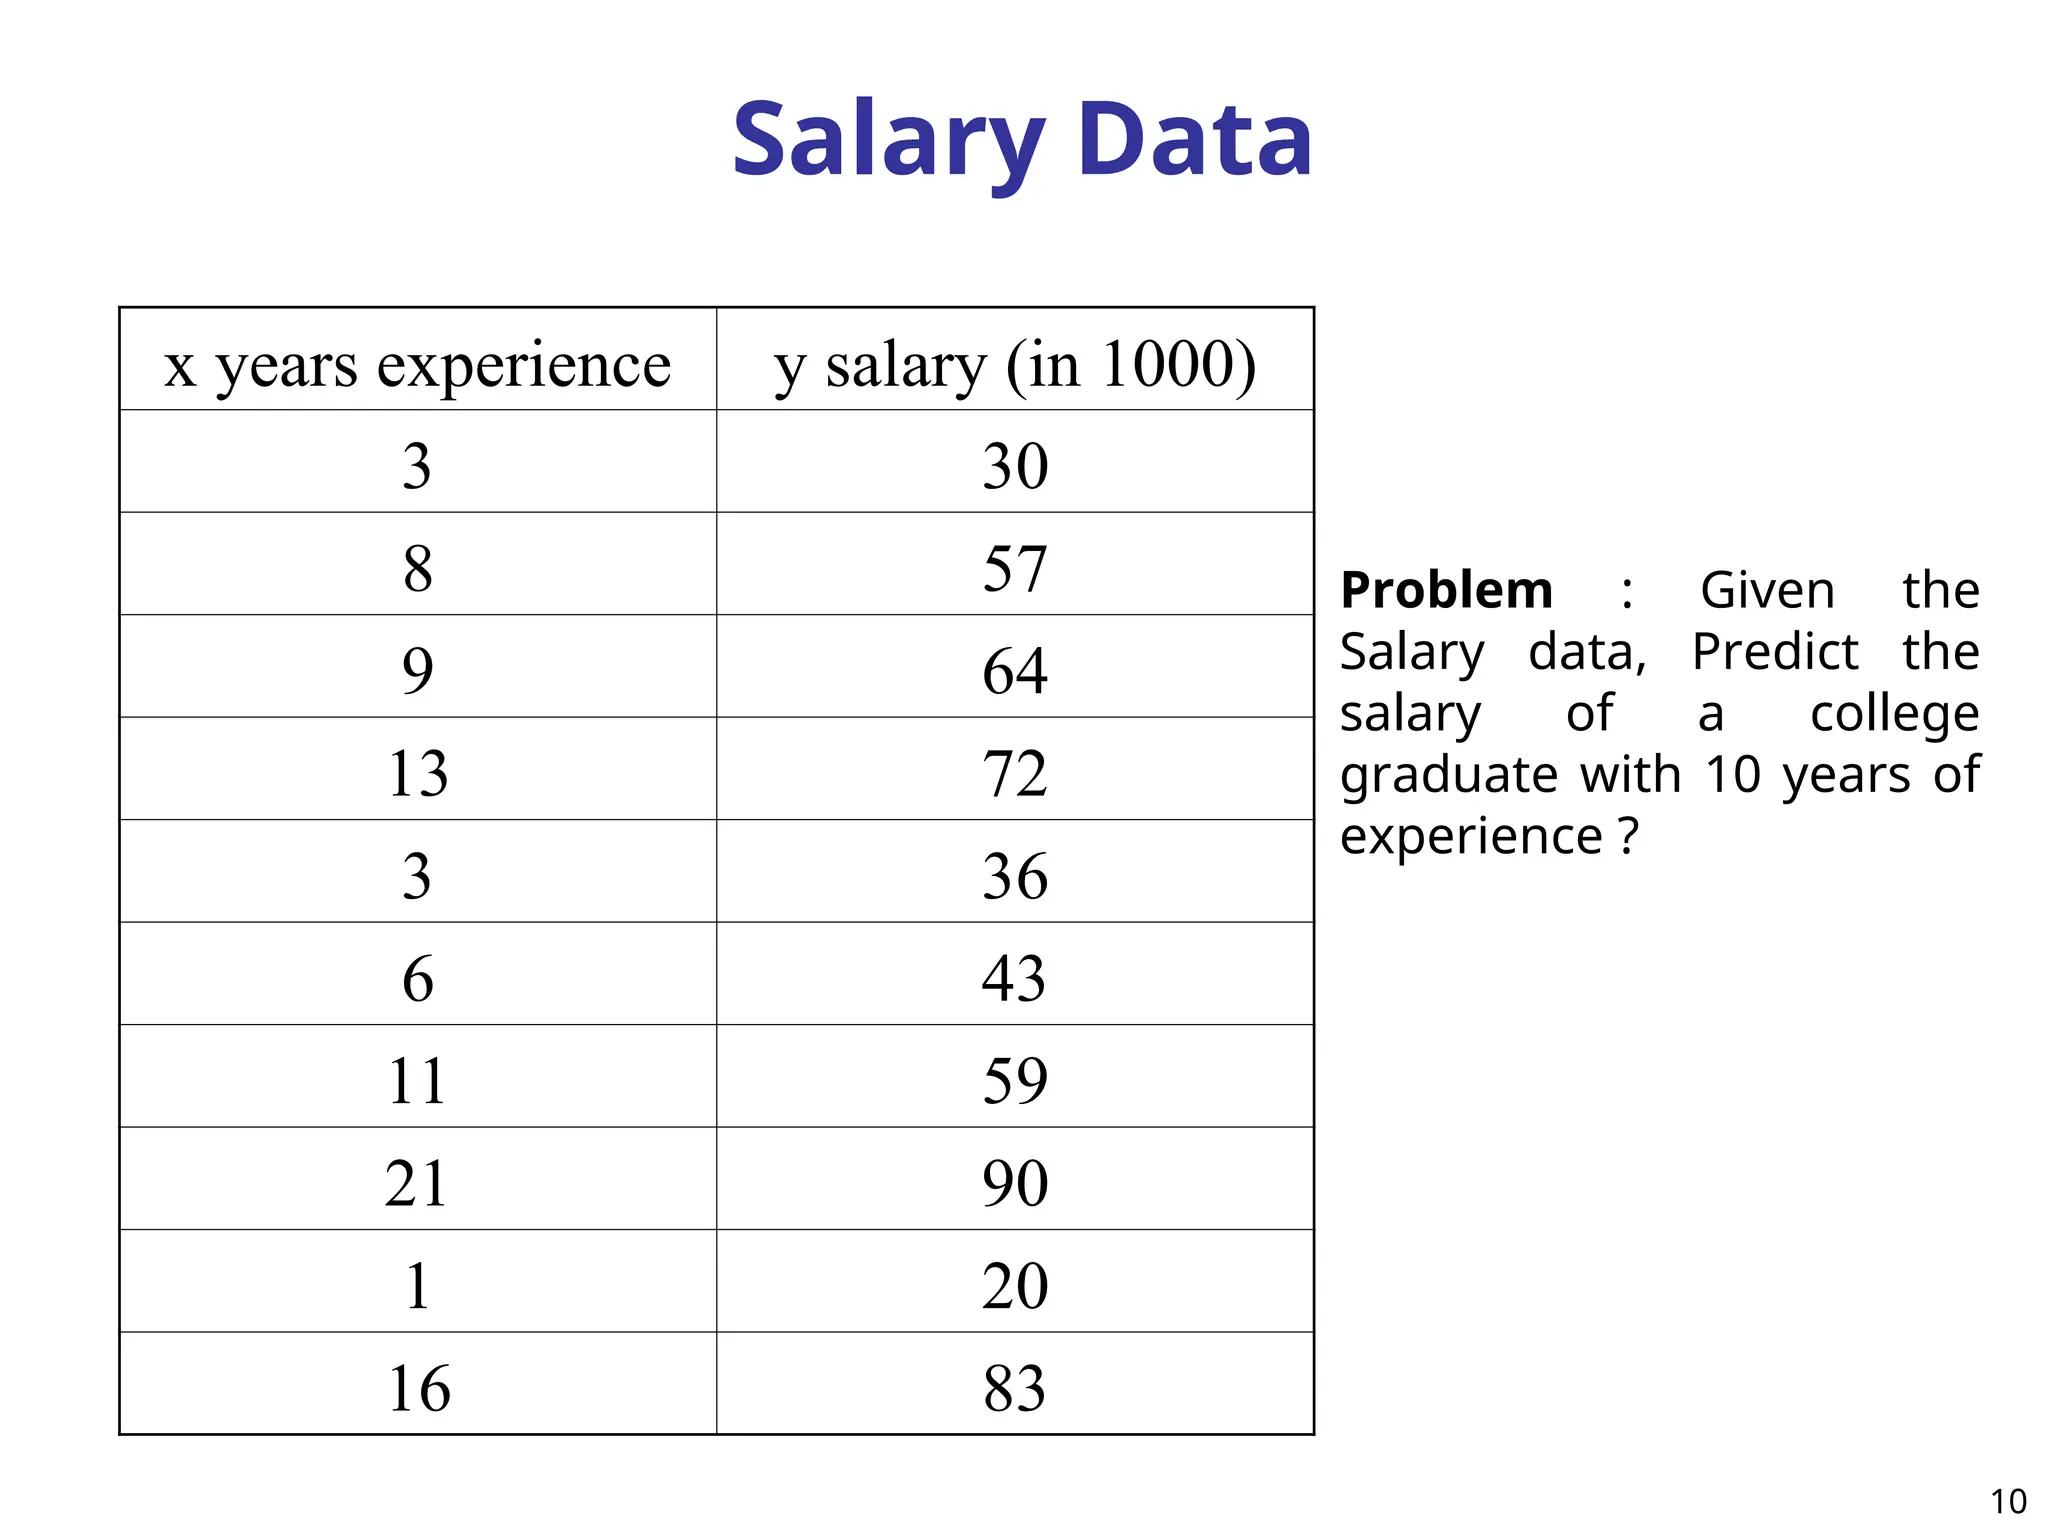
x yearsexperience y salary (in 1000)
3 30
8 57
9 64
13 72
3 36
6 43
11 59
21 90
1 20
16 83
Problem : Given the
Salary data, Predict the
salary of a college
graduate with 10 years of
experience ?
10
11.
11
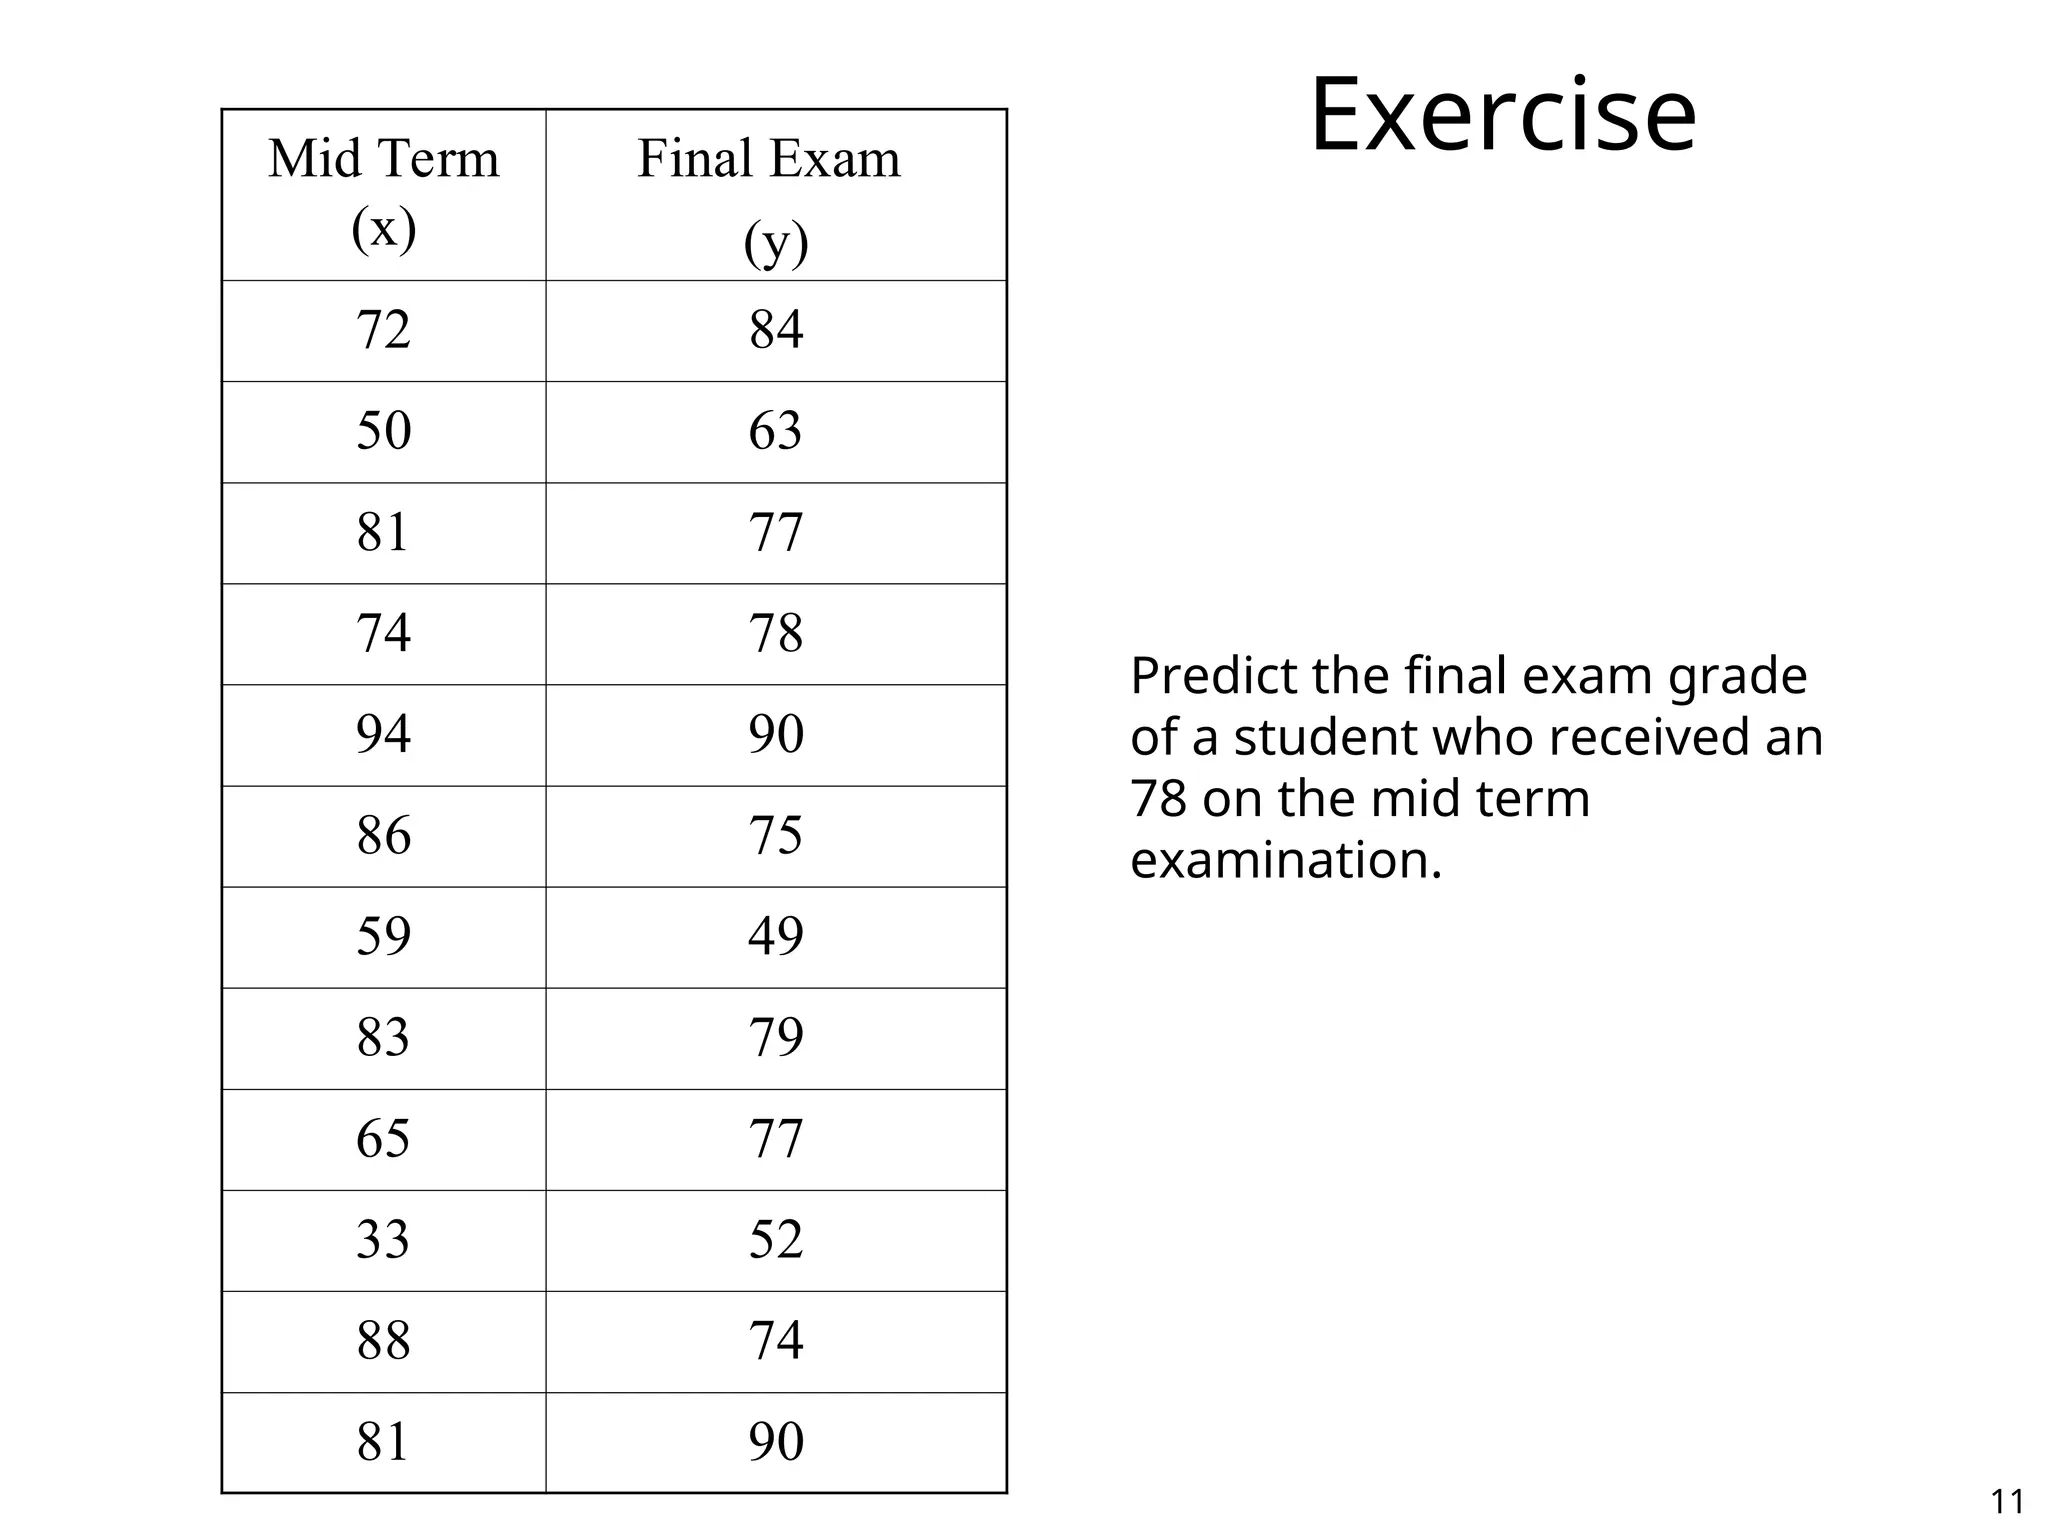
Mid Term
(x)
Final Exam
(y)
7284
50 63
81 77
74 78
94 90
86 75
59 49
83 79
65 77
33 52
88 74
81 90
Predict the final exam grade
of a student who received an
78 on the mid term
examination.
Exercise
12.
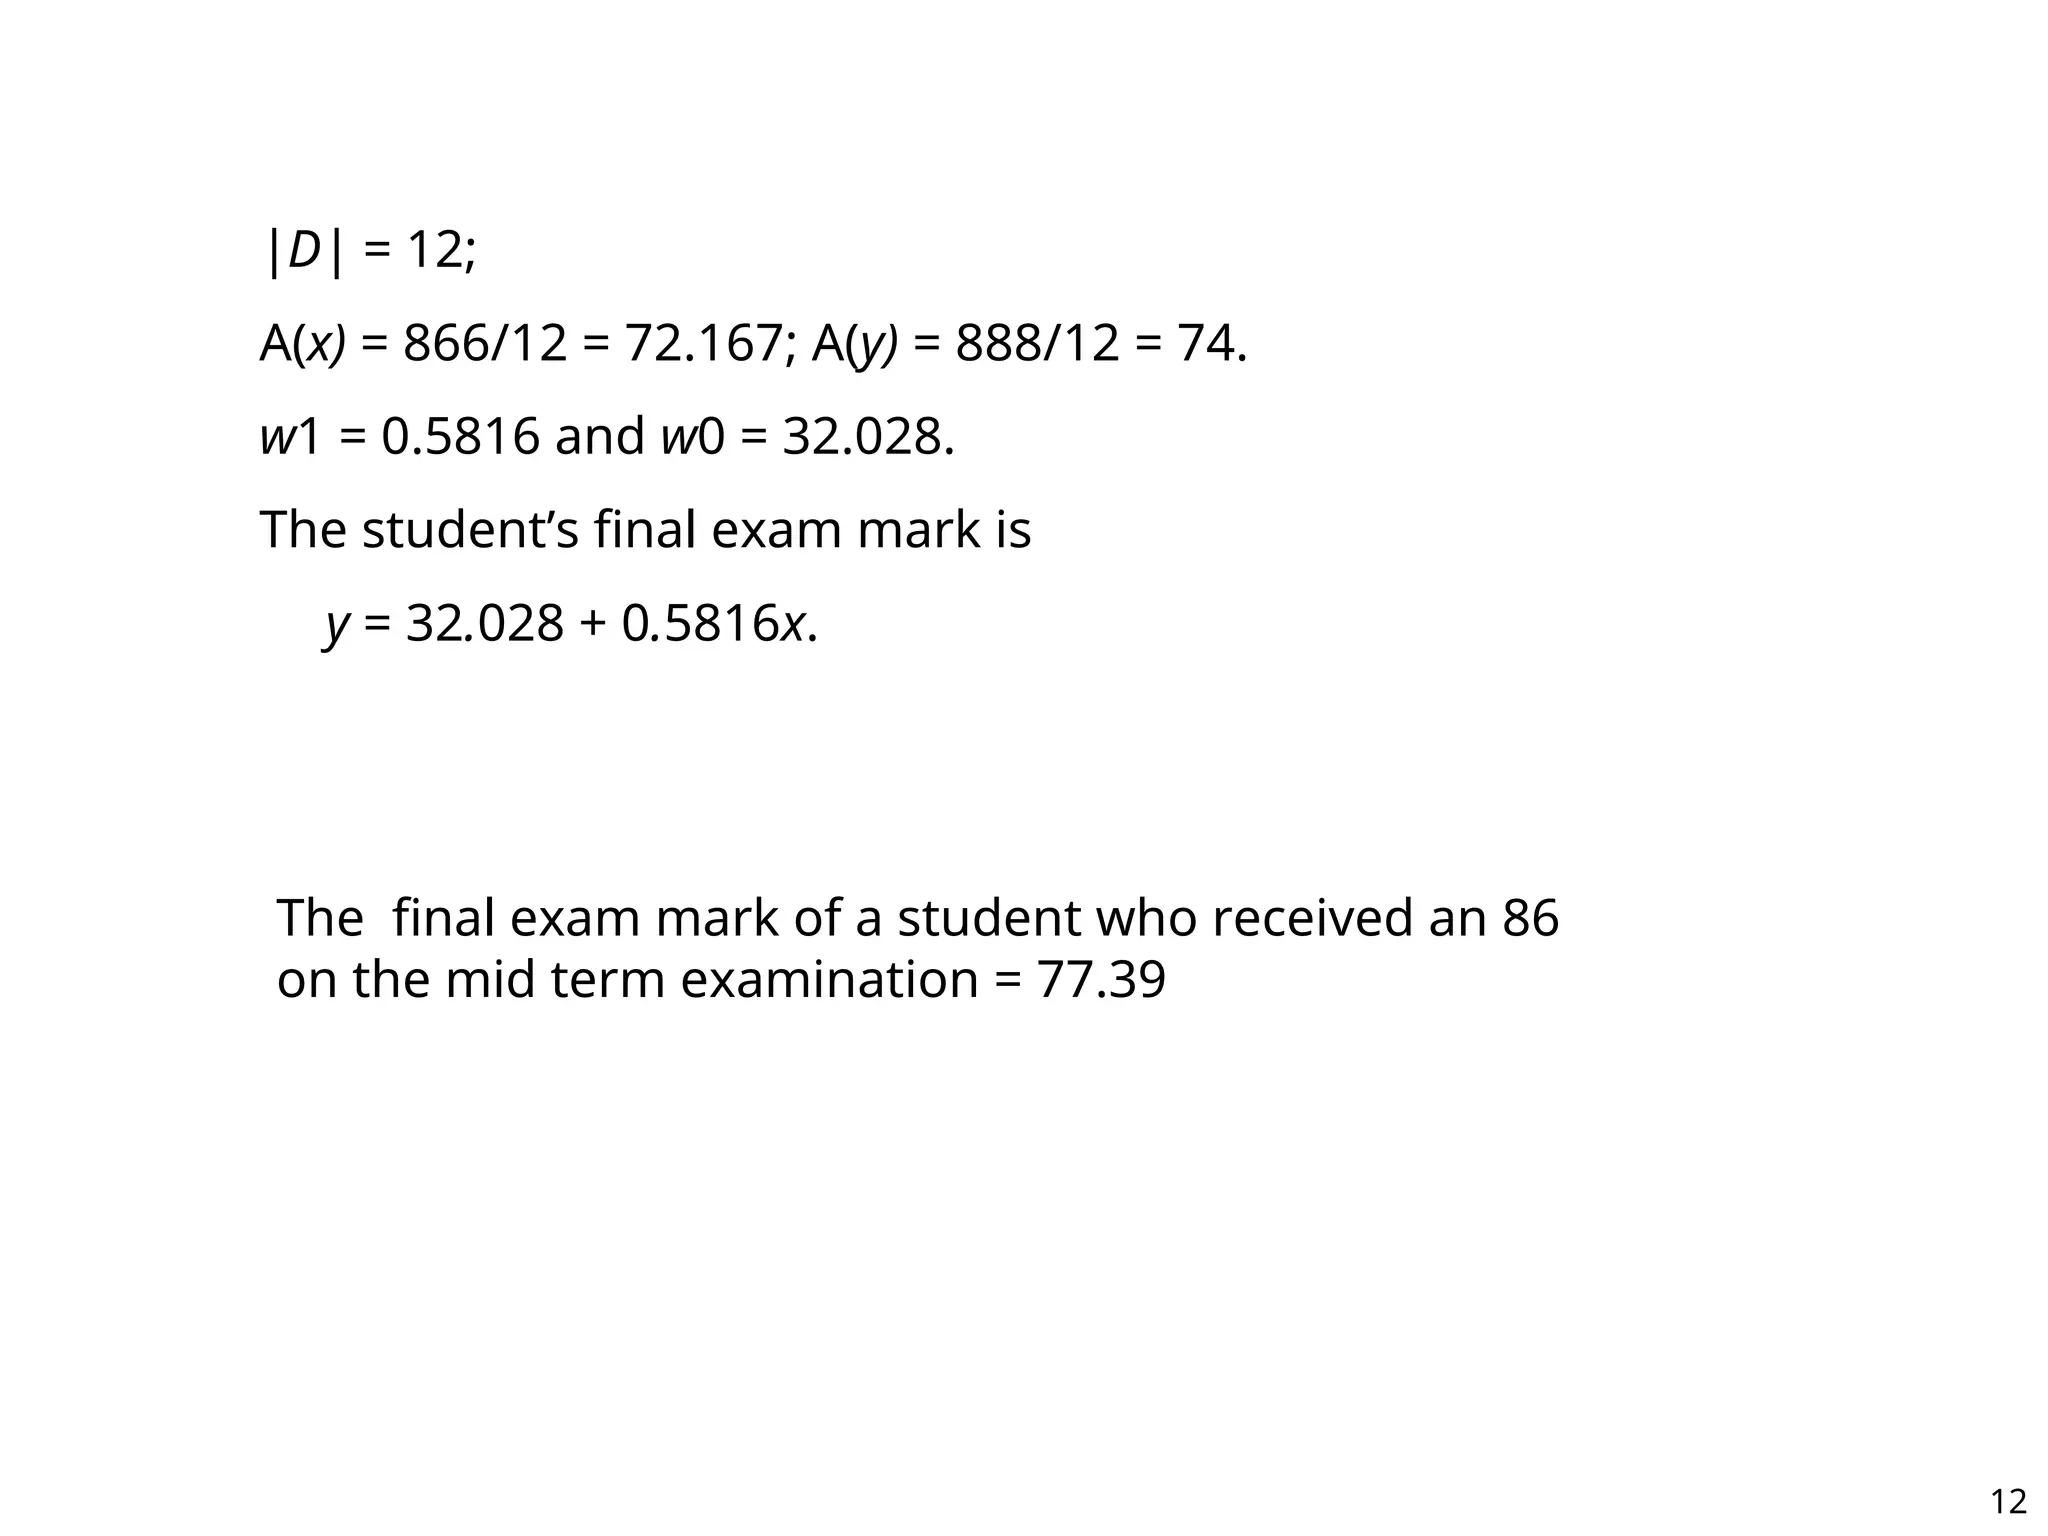
|D| = 12;
A(x)= 866/12 = 72.167; A(y) = 888/12 = 74.
w1 = 0.5816 and w0 = 32.028.
The student’s final exam mark is
y = 32.028 + 0.5816x.
The final exam mark of a student who received an 86
on the mid term examination = 77.39
12
13.
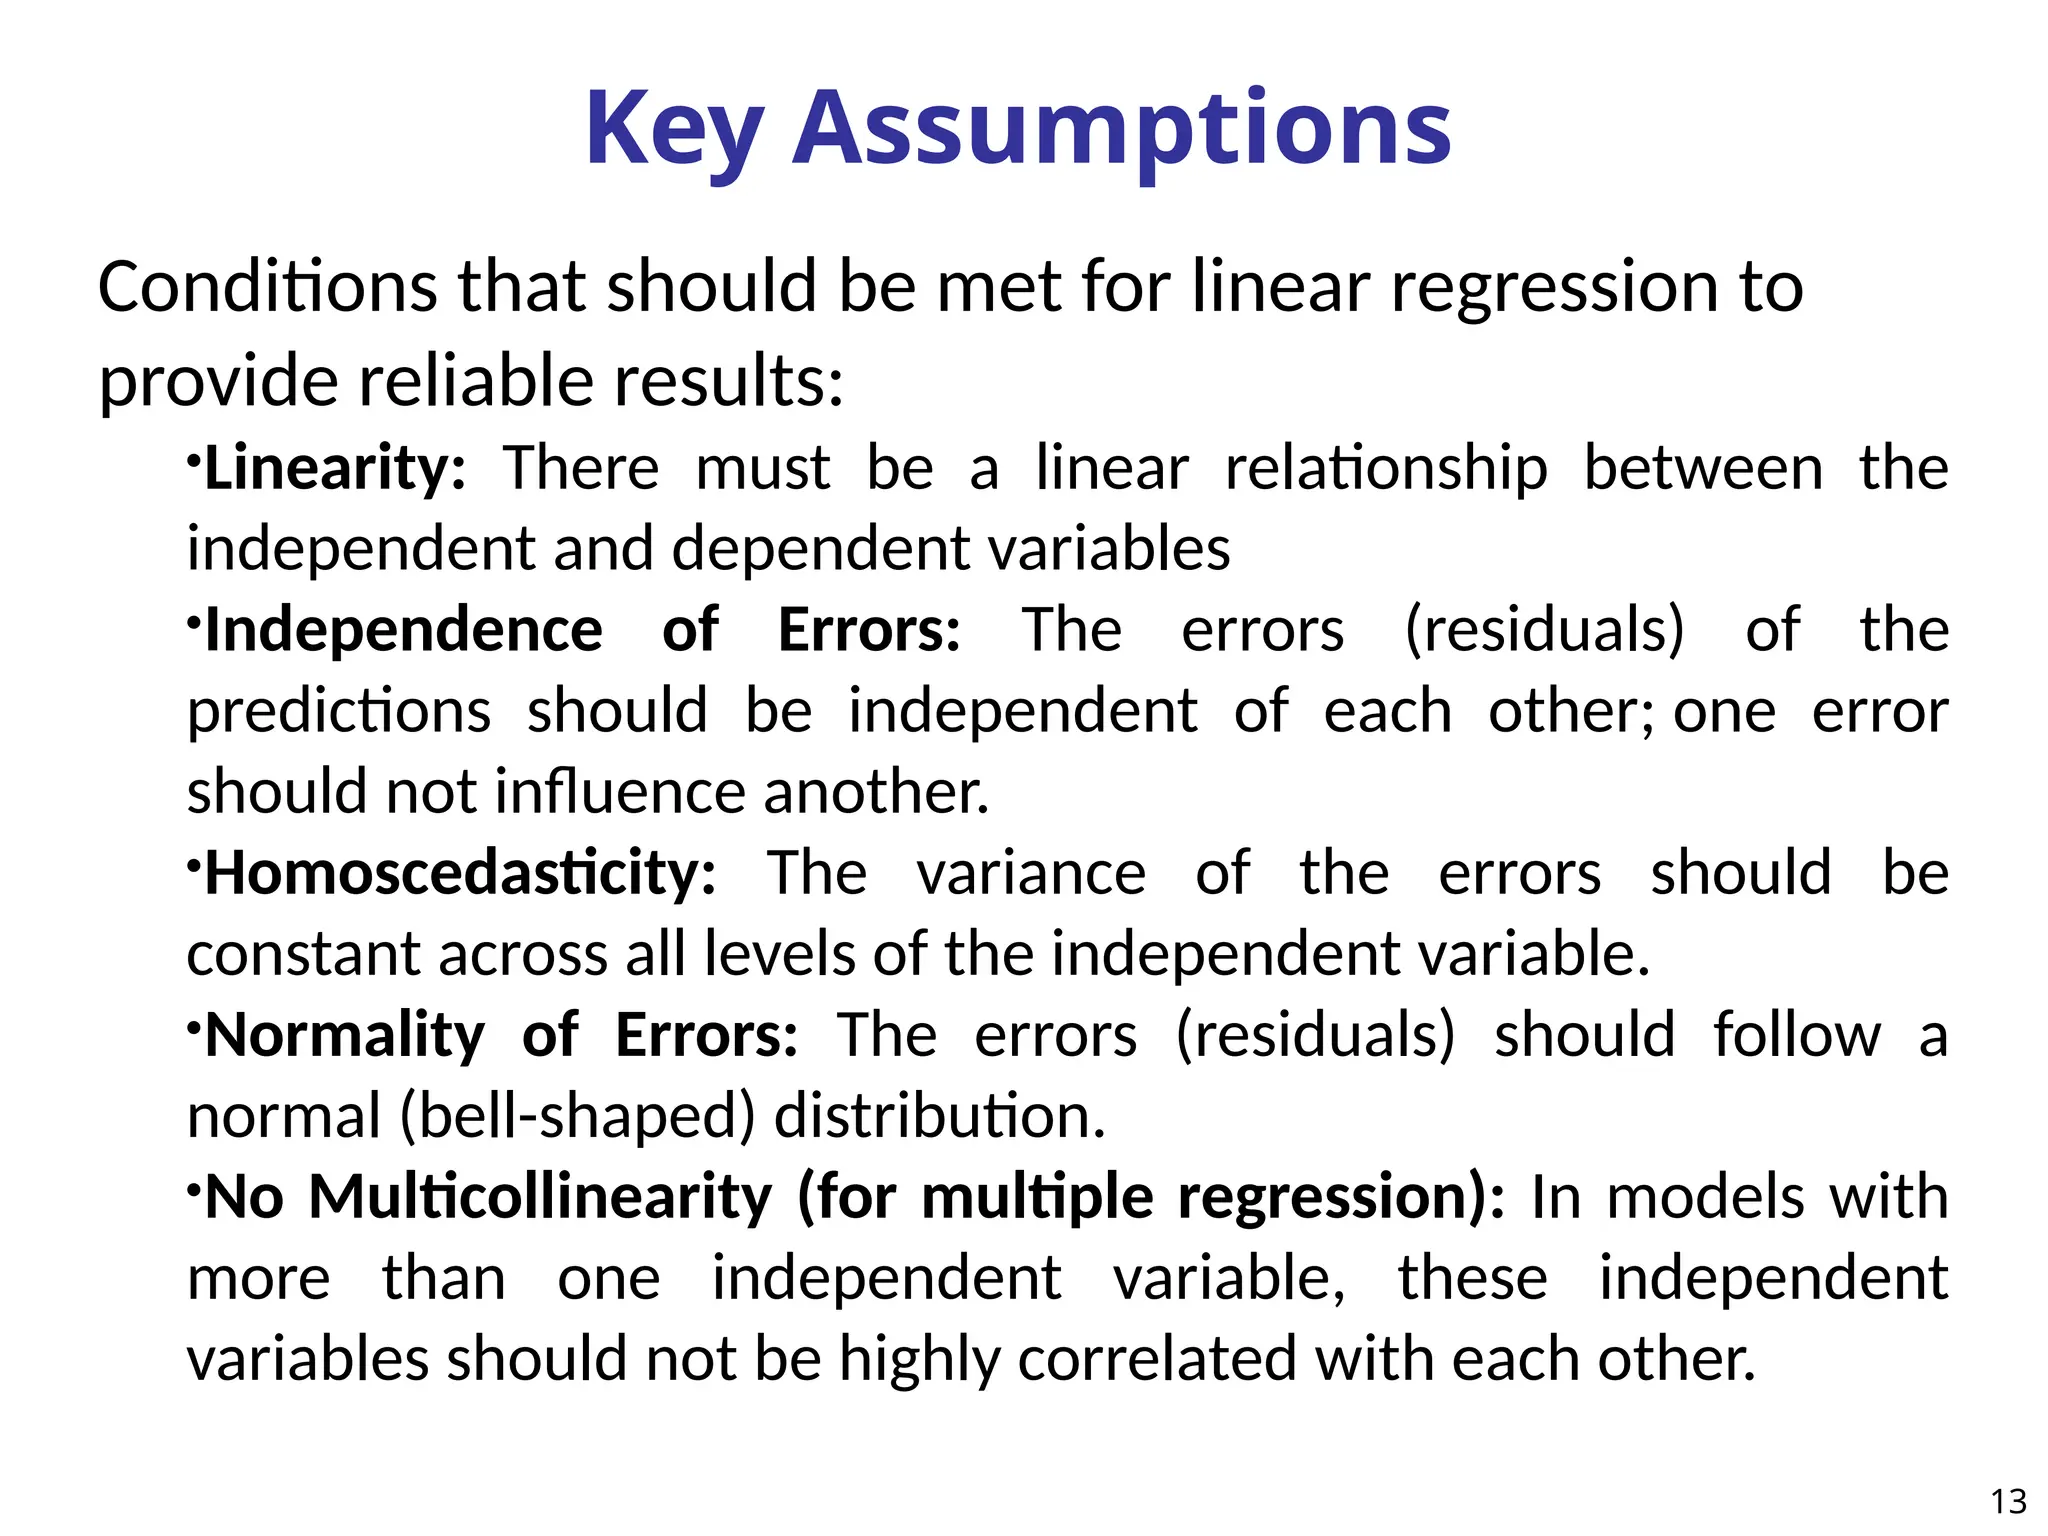
Key Assumptions
Conditions thatshould be met for linear regression to
provide reliable results:
•Linearity: There must be a linear relationship between the
independent and dependent variables
•Independence of Errors: The errors (residuals) of the
predictions should be independent of each other; one error
should not influence another.
•Homoscedasticity: The variance of the errors should be
constant across all levels of the independent variable.
•Normality of Errors: The errors (residuals) should follow a
normal (bell-shaped) distribution.
•No Multicollinearity (for multiple regression): In models with
more than one independent variable, these independent
variables should not be highly correlated with each other.
13
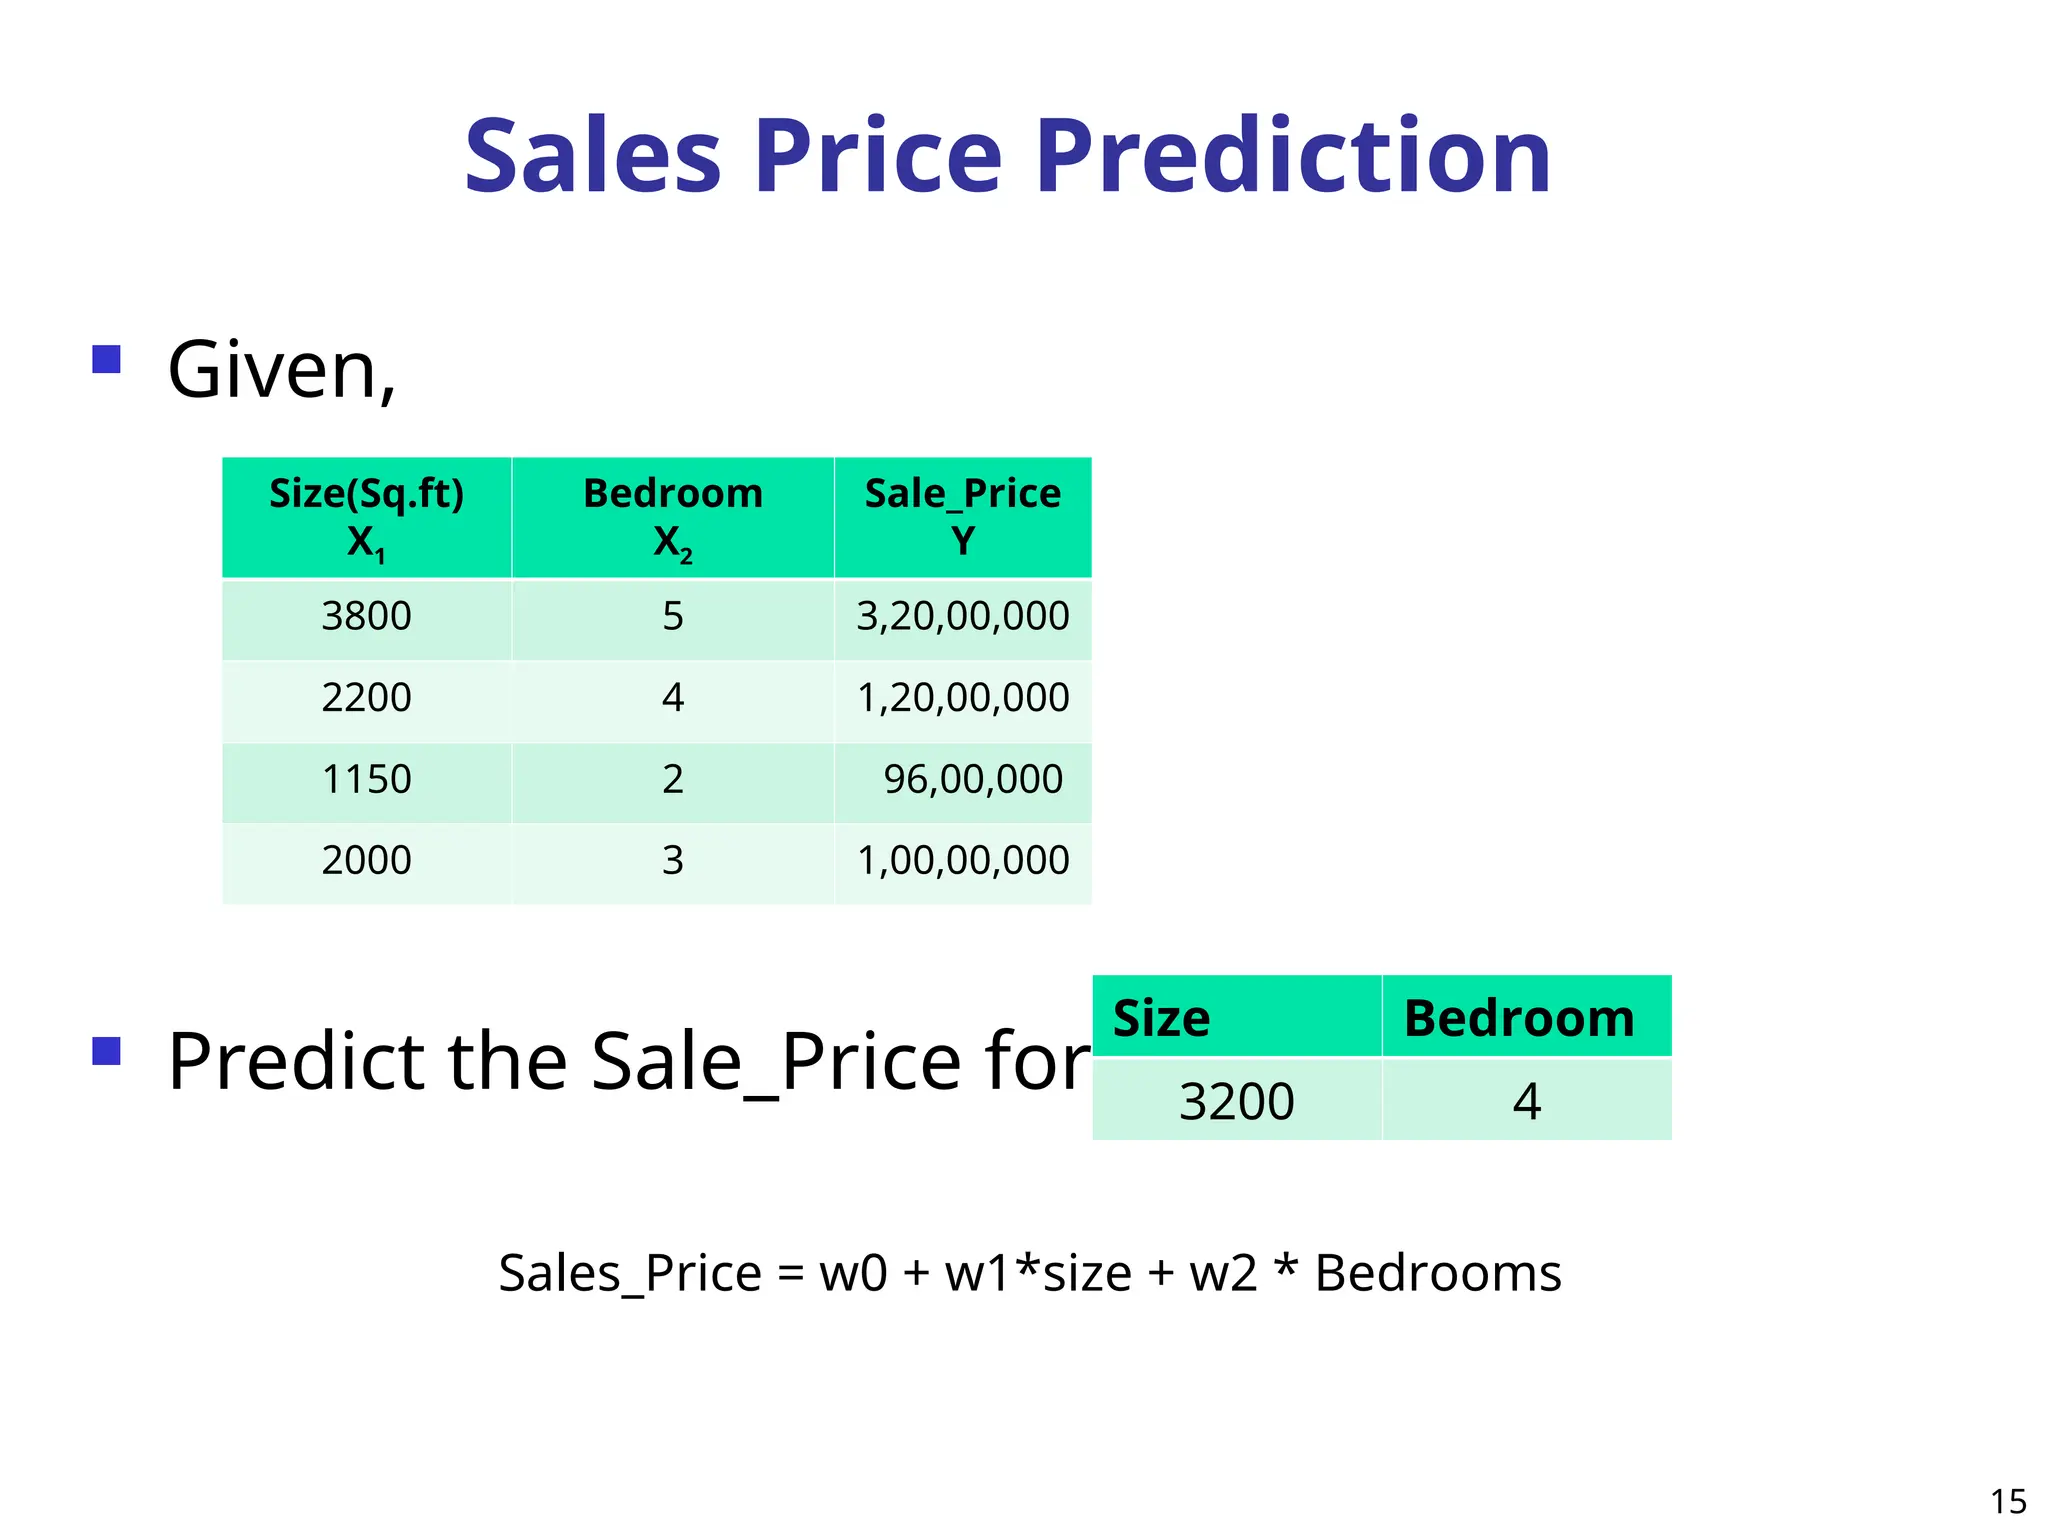
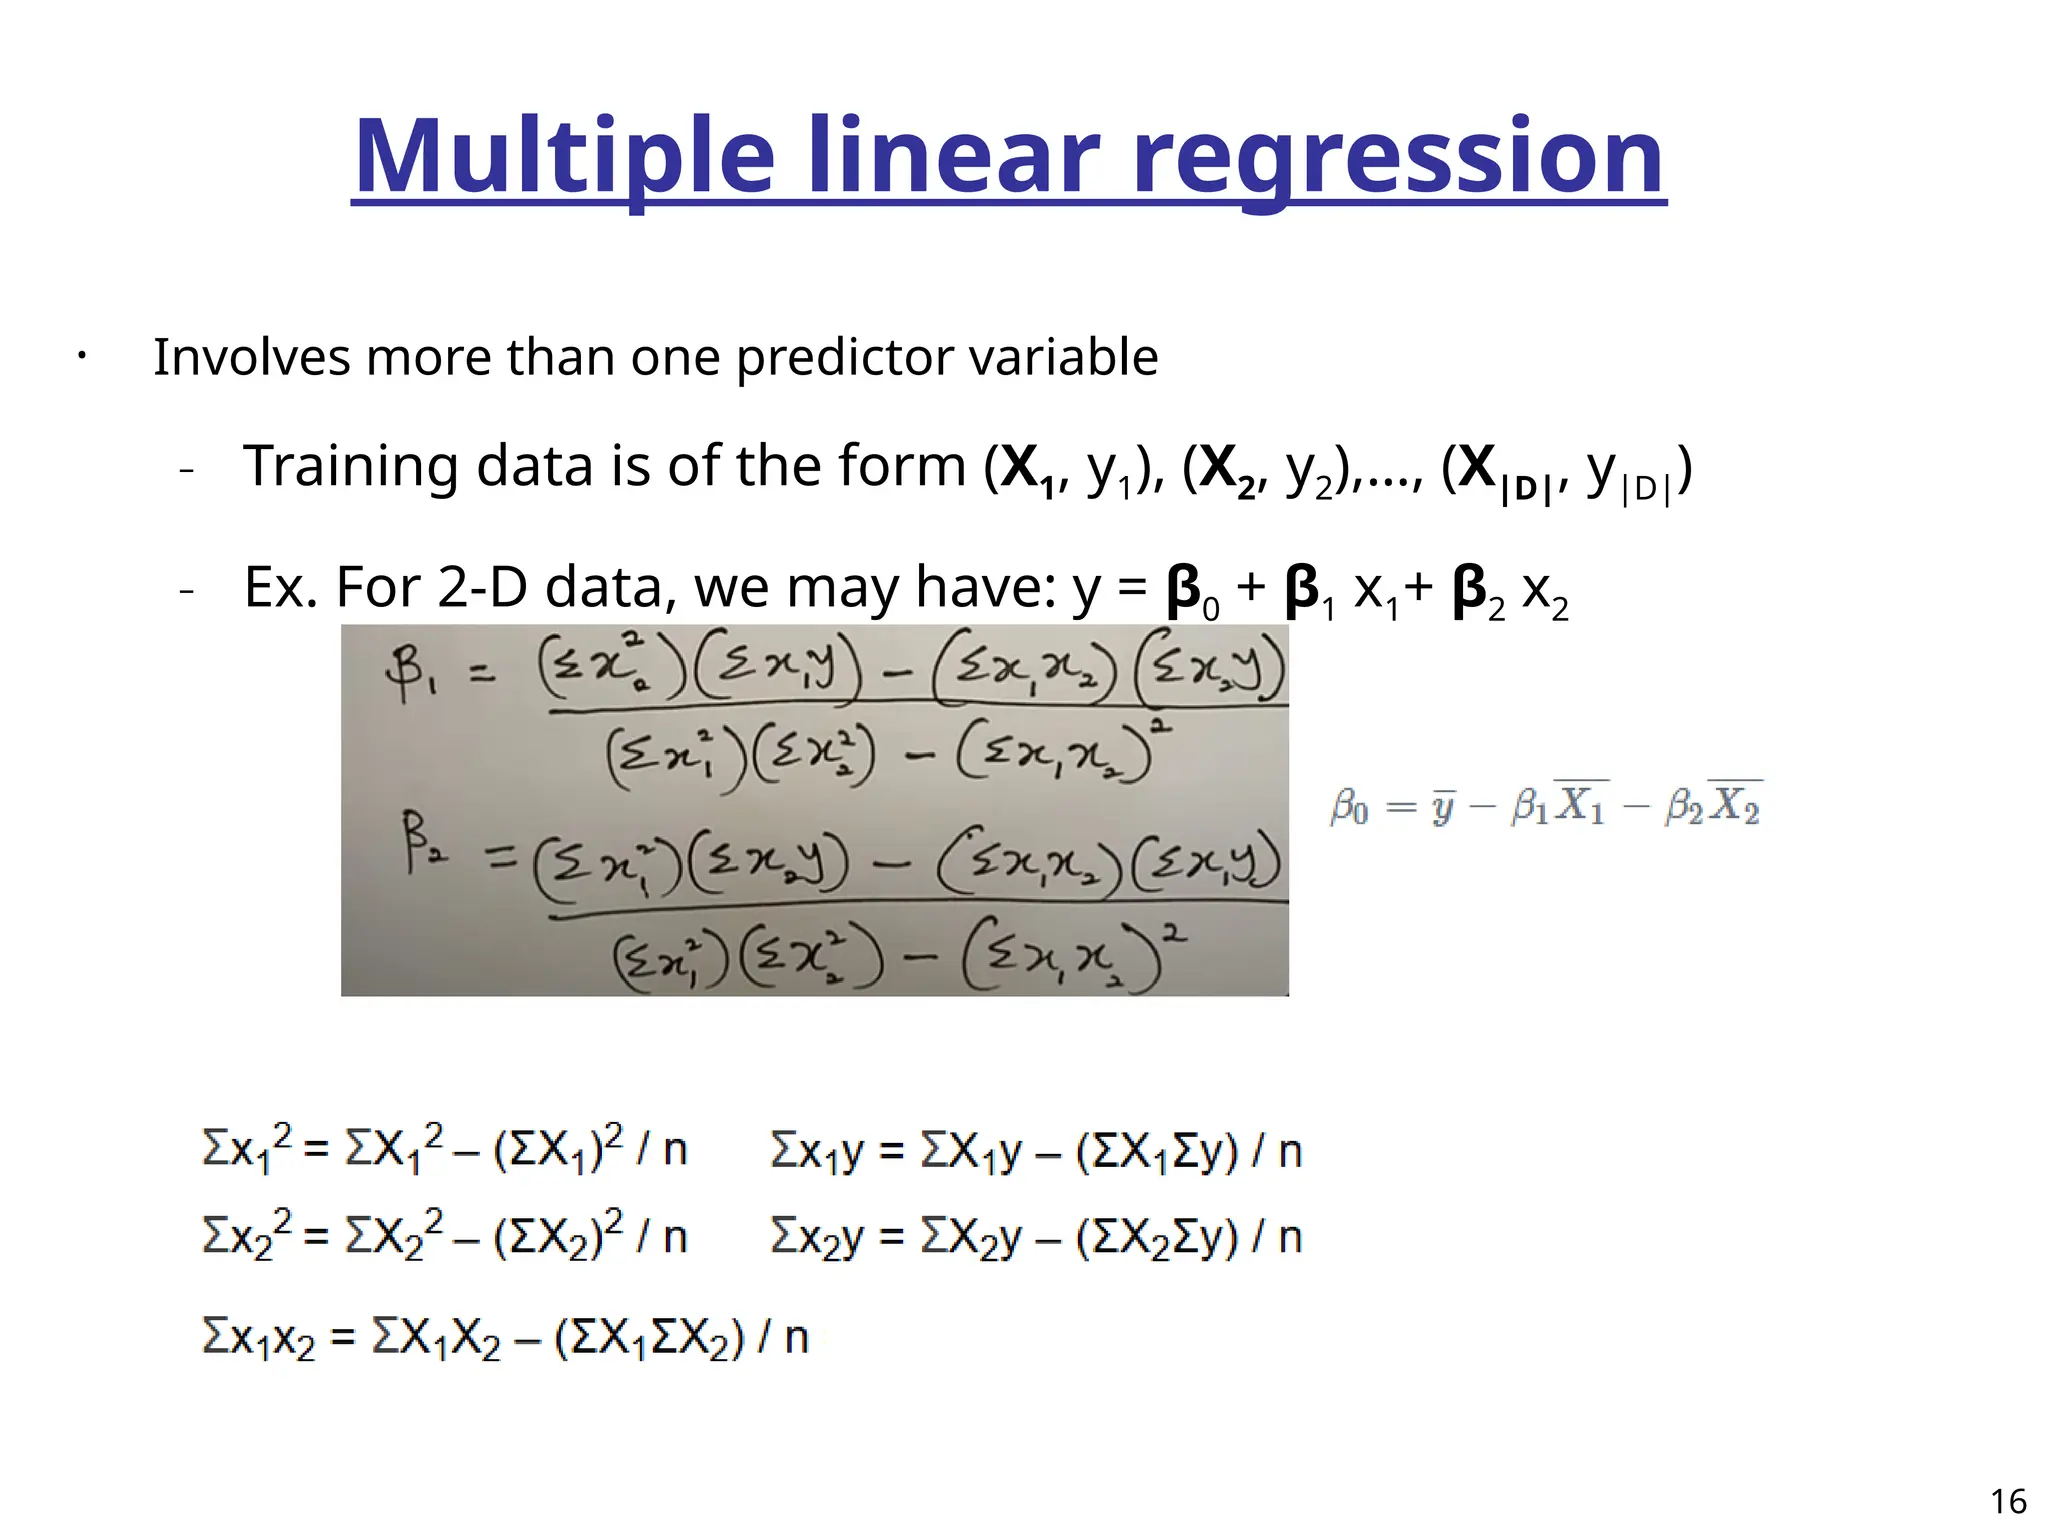
Multiple linear regression
•Involves more than one predictor variable
– Training data is of the form (X1, y1), (X2, y2),…, (X|D|, y|D|)
– Ex. For 2-D data, we may have: y = β0 + β1 x1+ β2 x2
16
17.
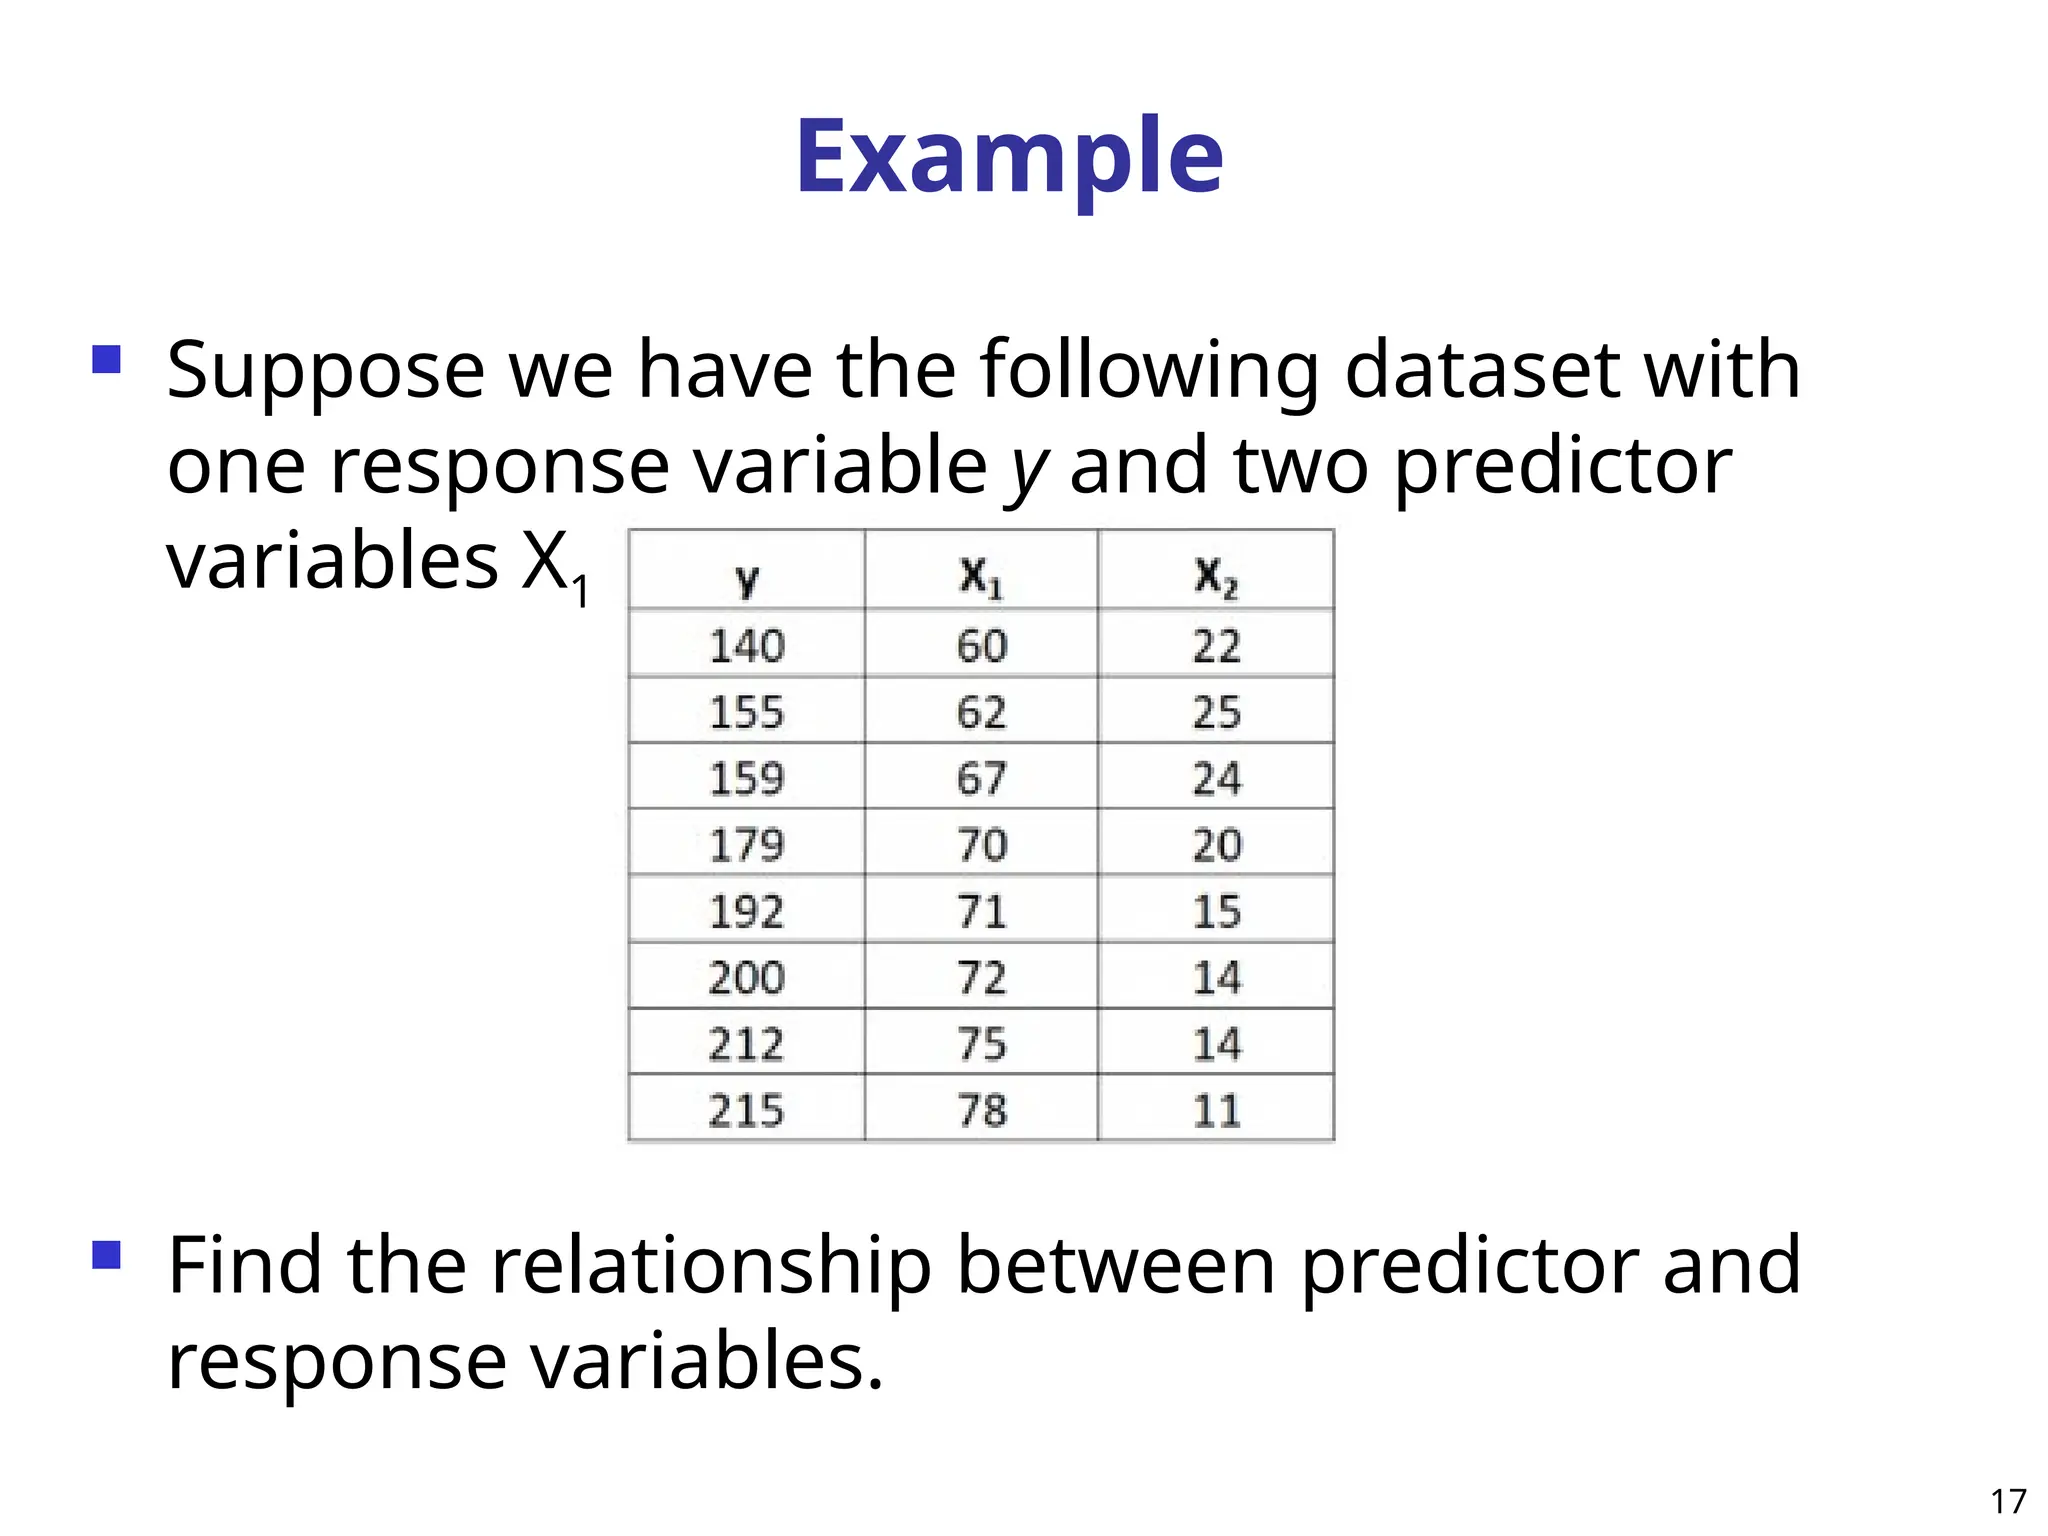
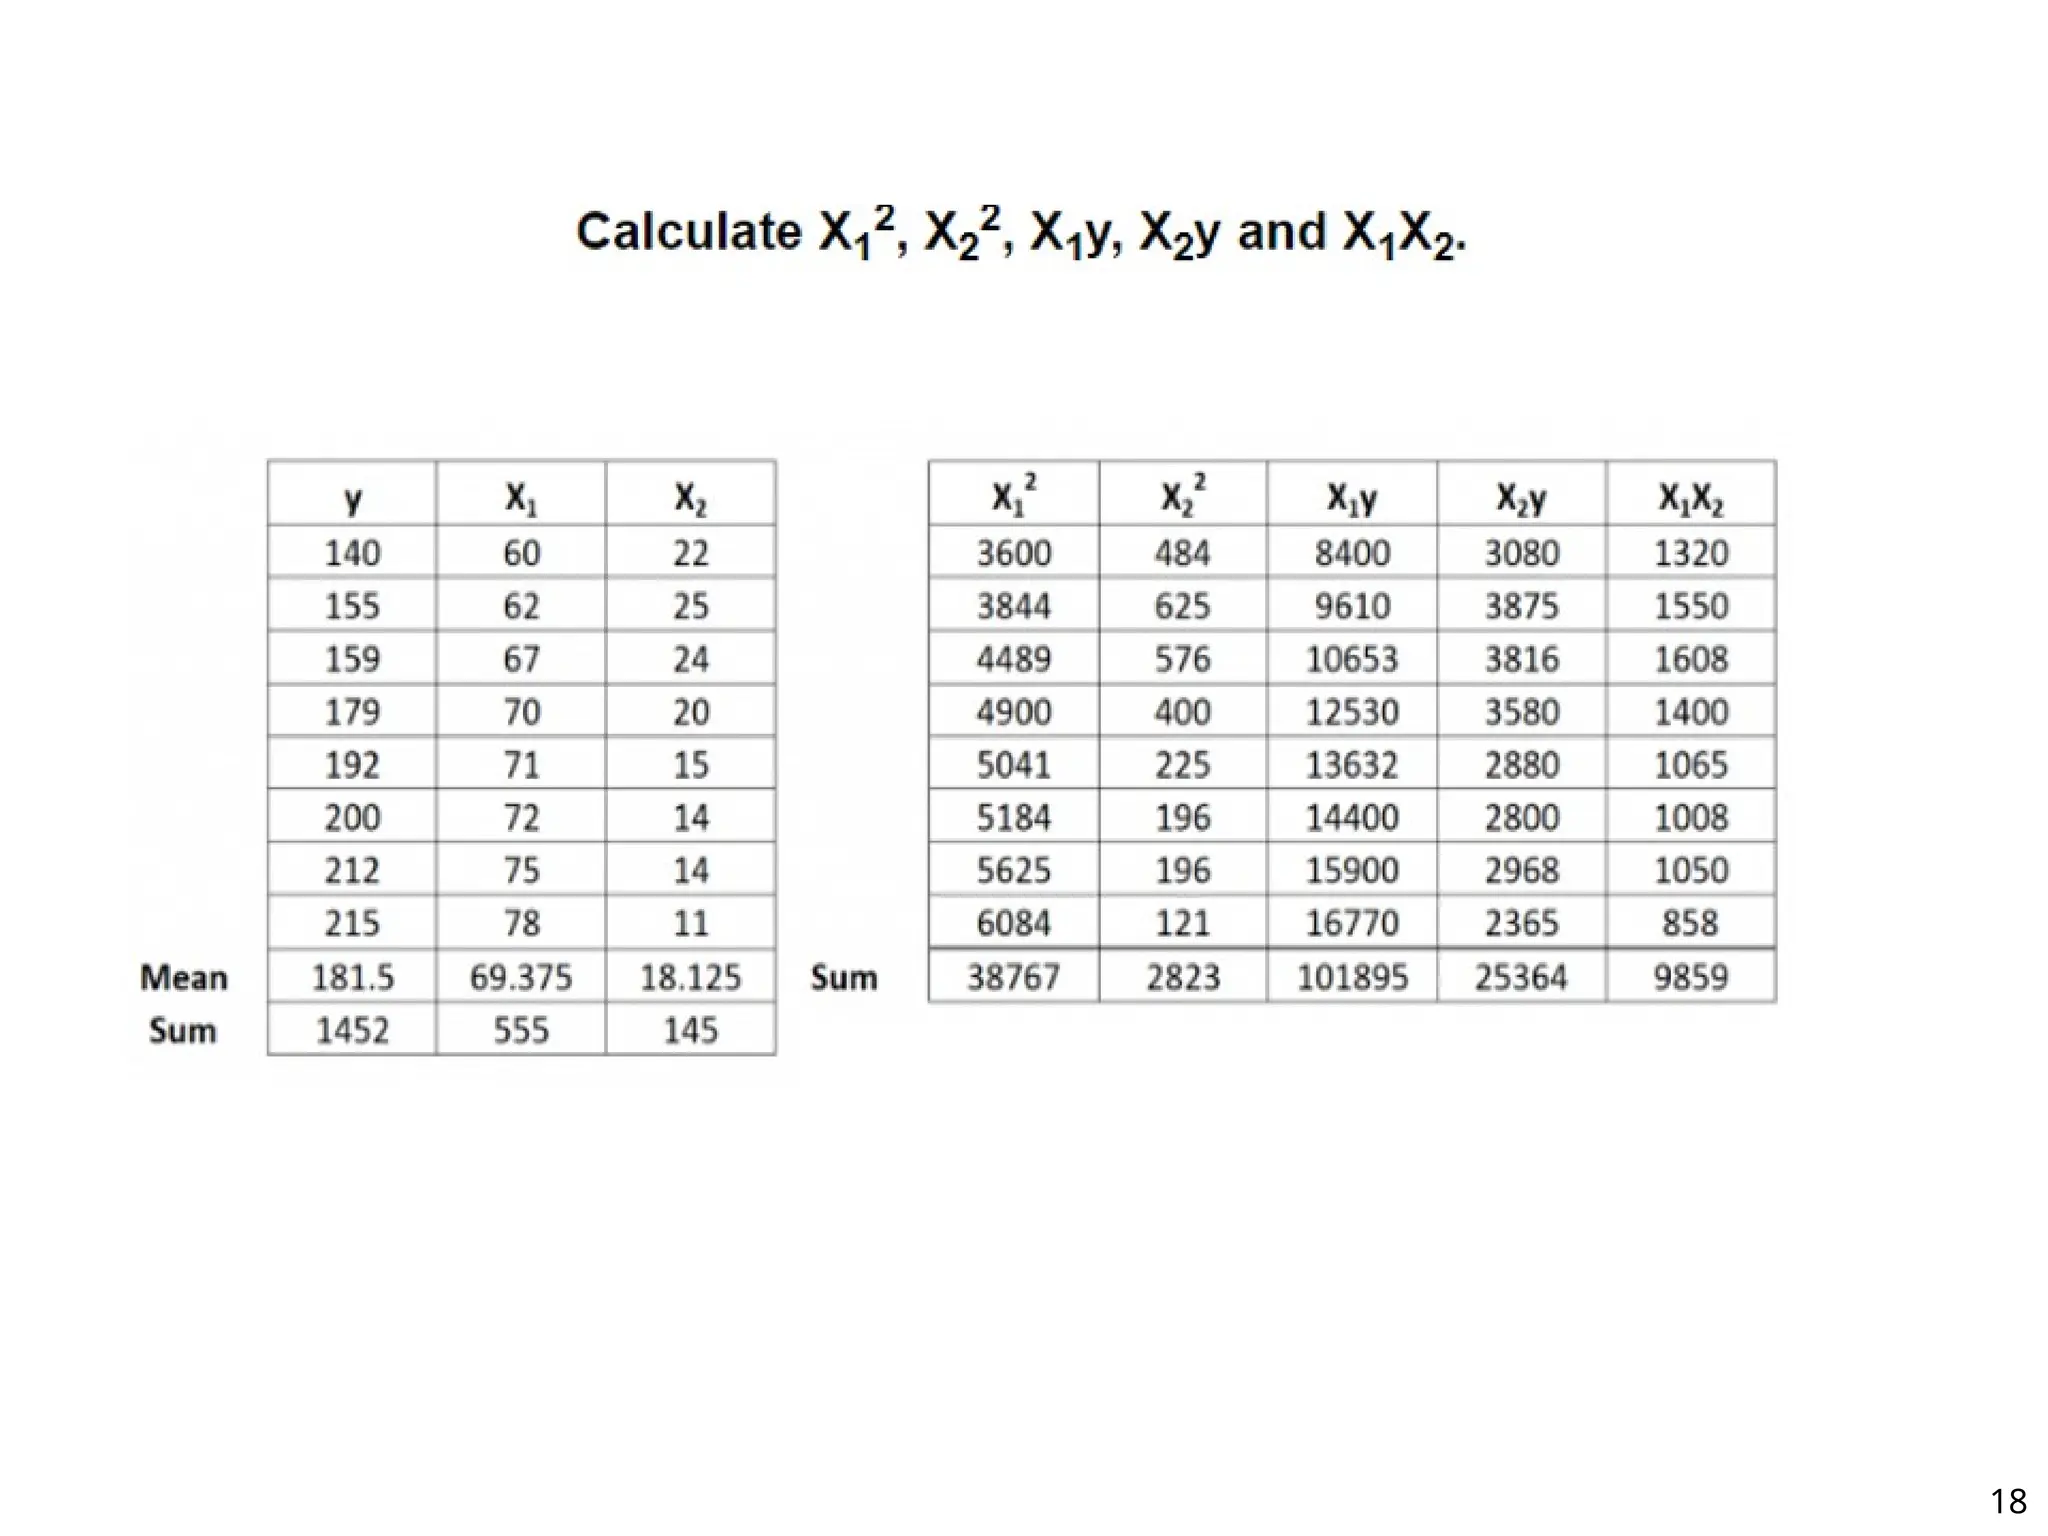
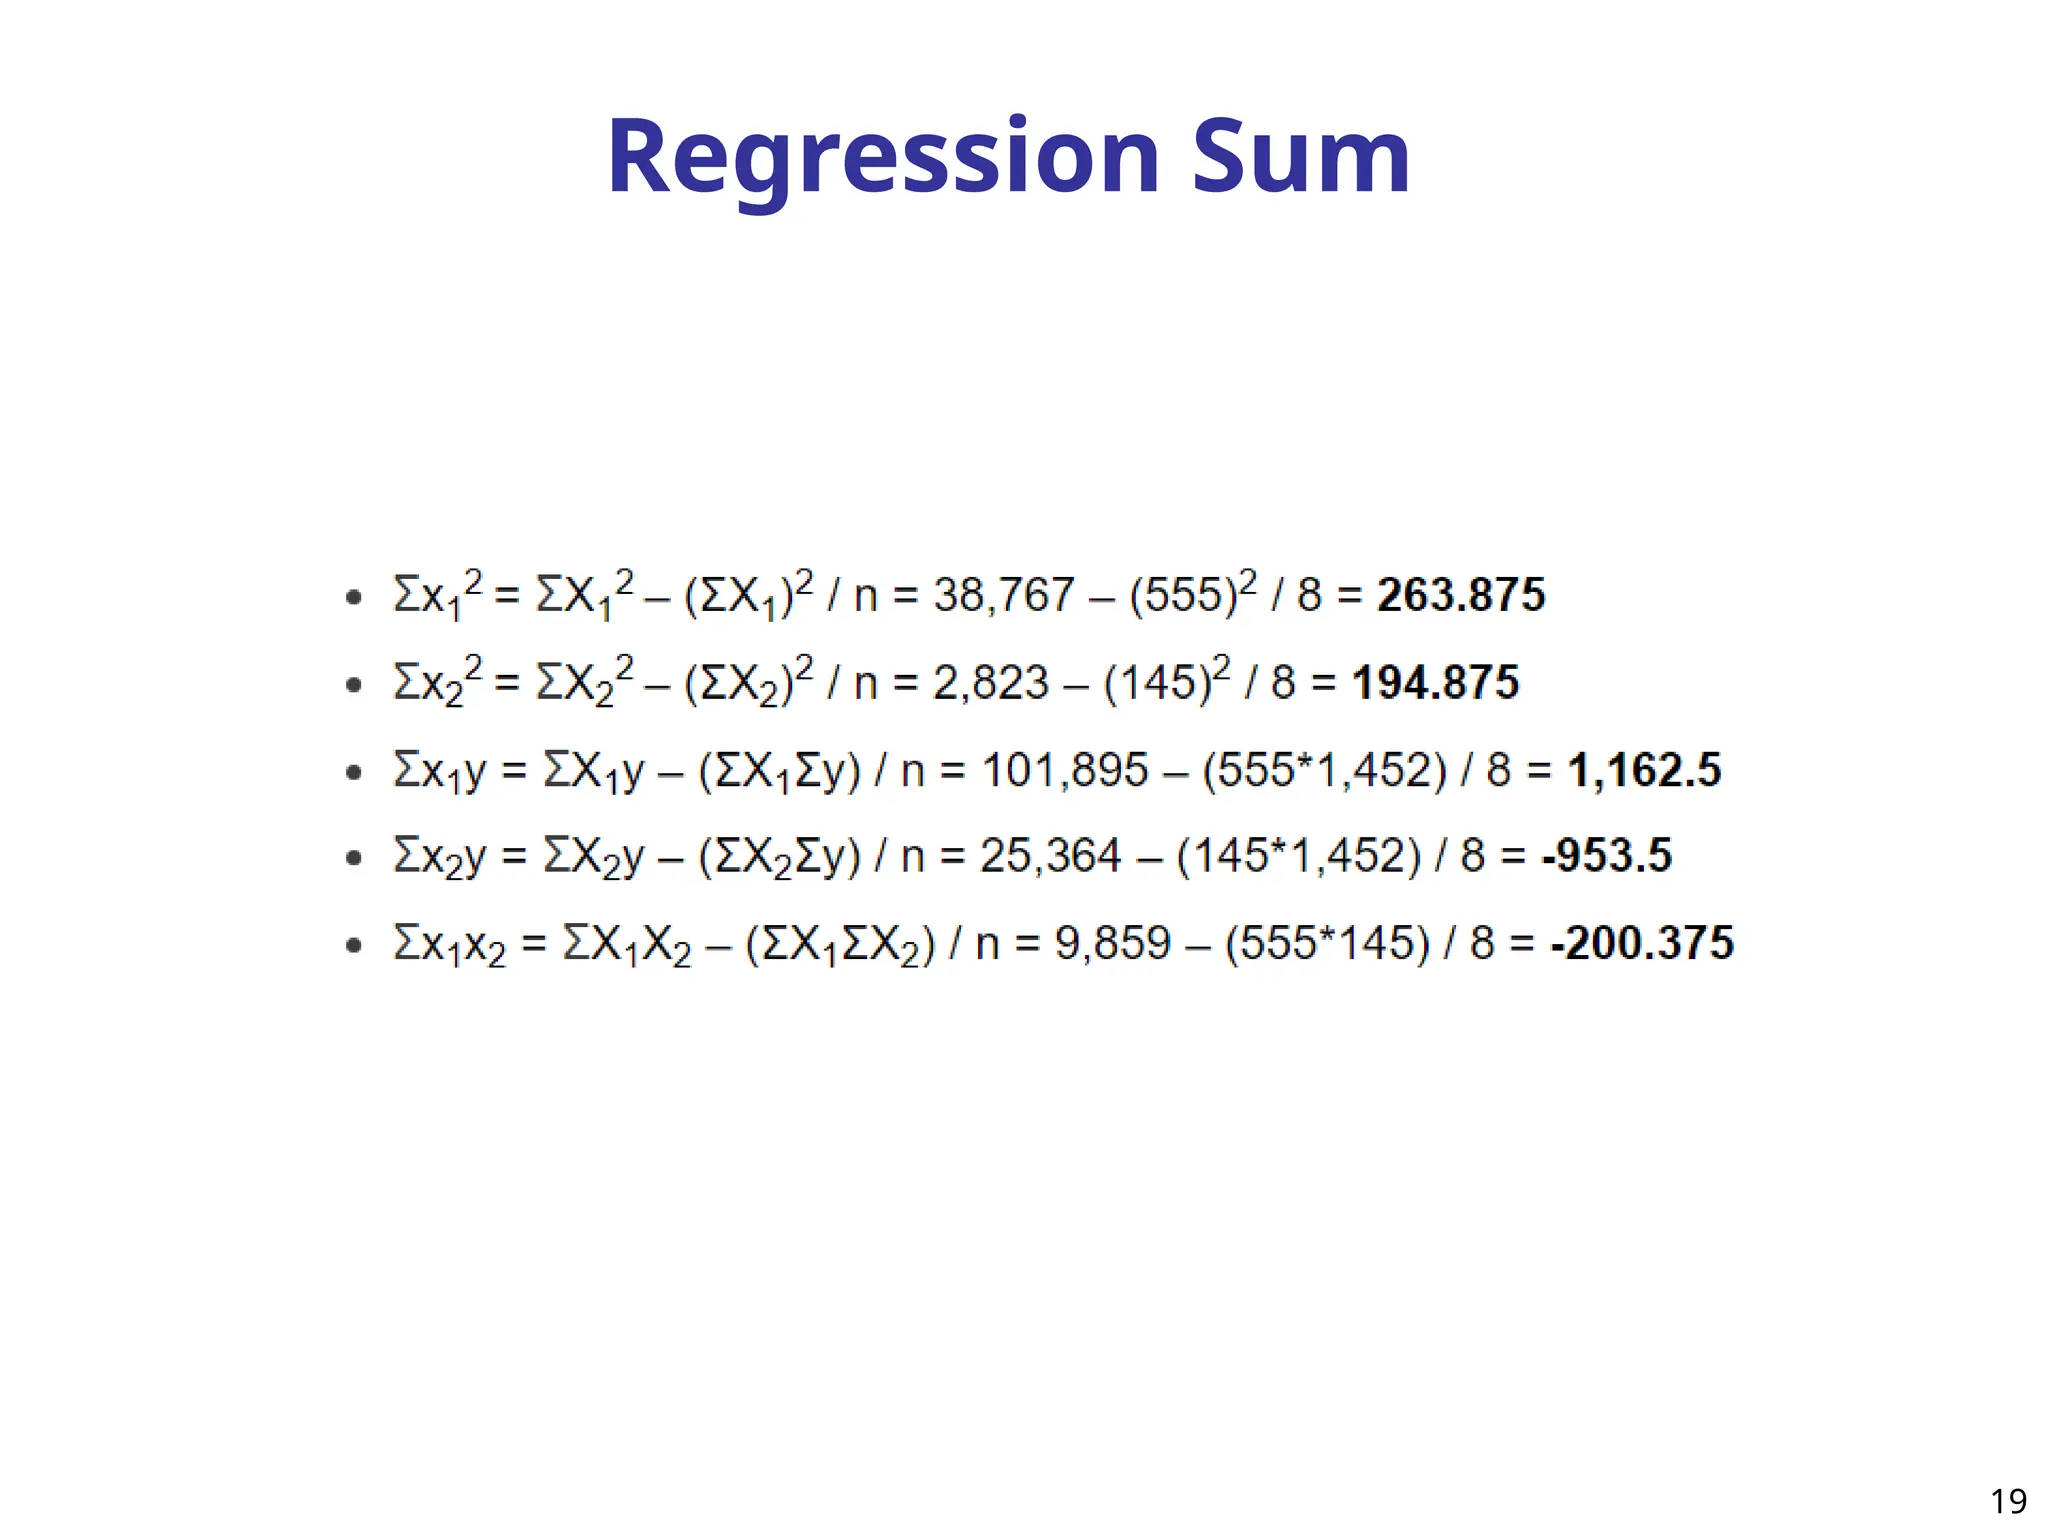
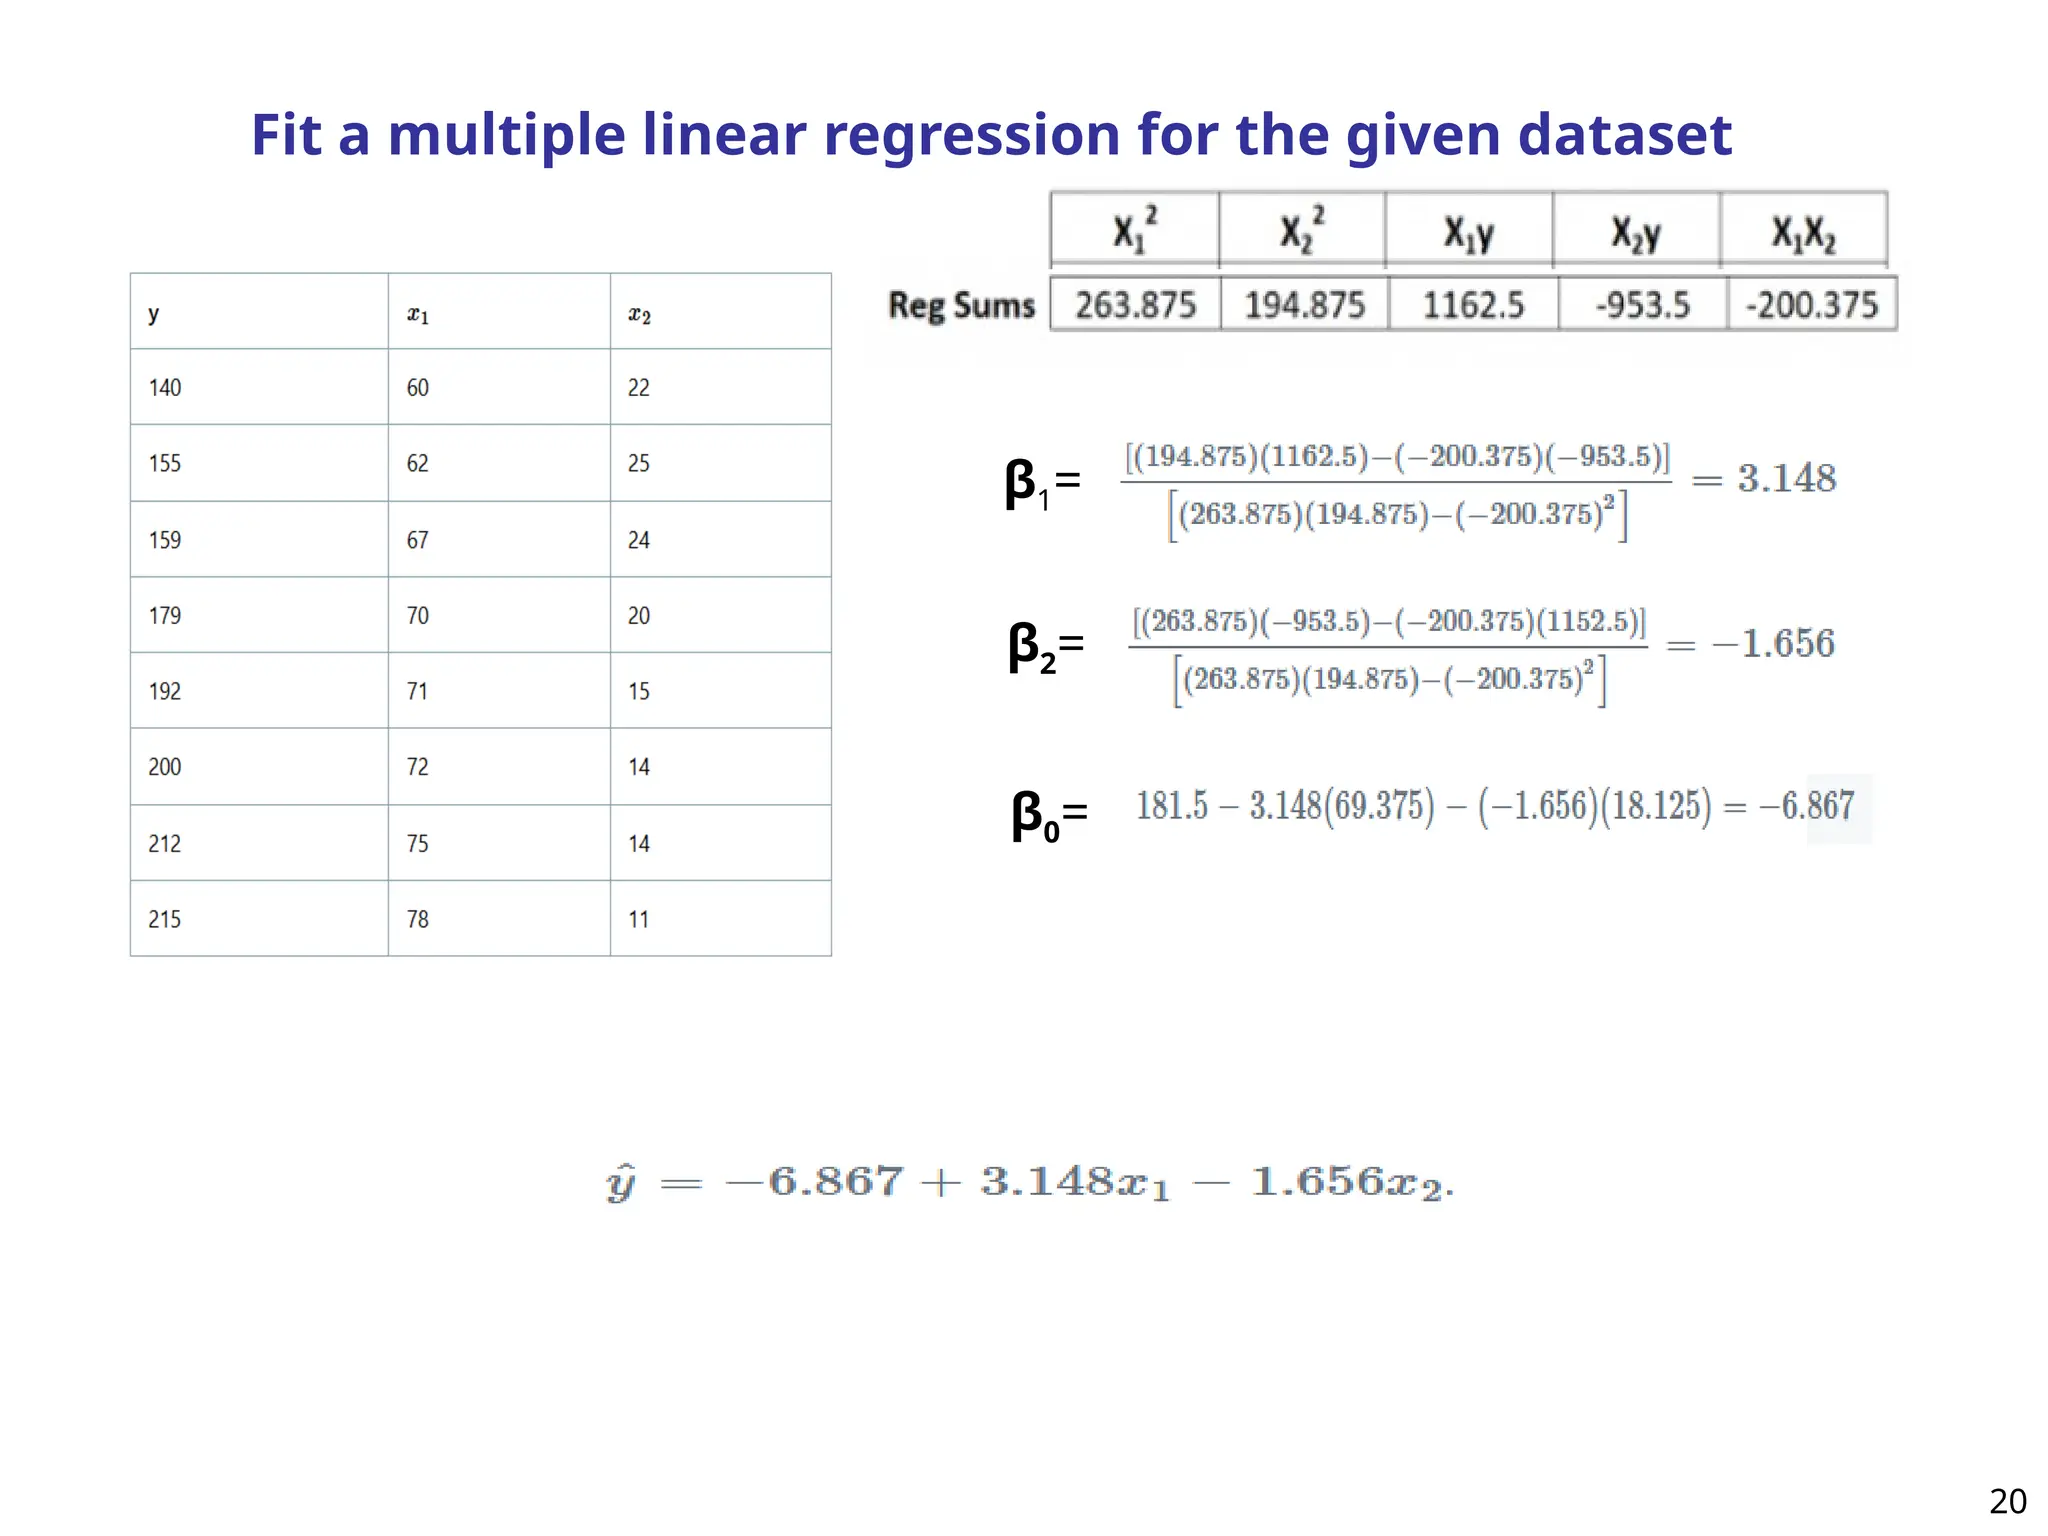
Example
Suppose wehave the following dataset with
one response variable y and two predictor
variables X1 and X2:
Find the relationship between predictor and
response variables.
17
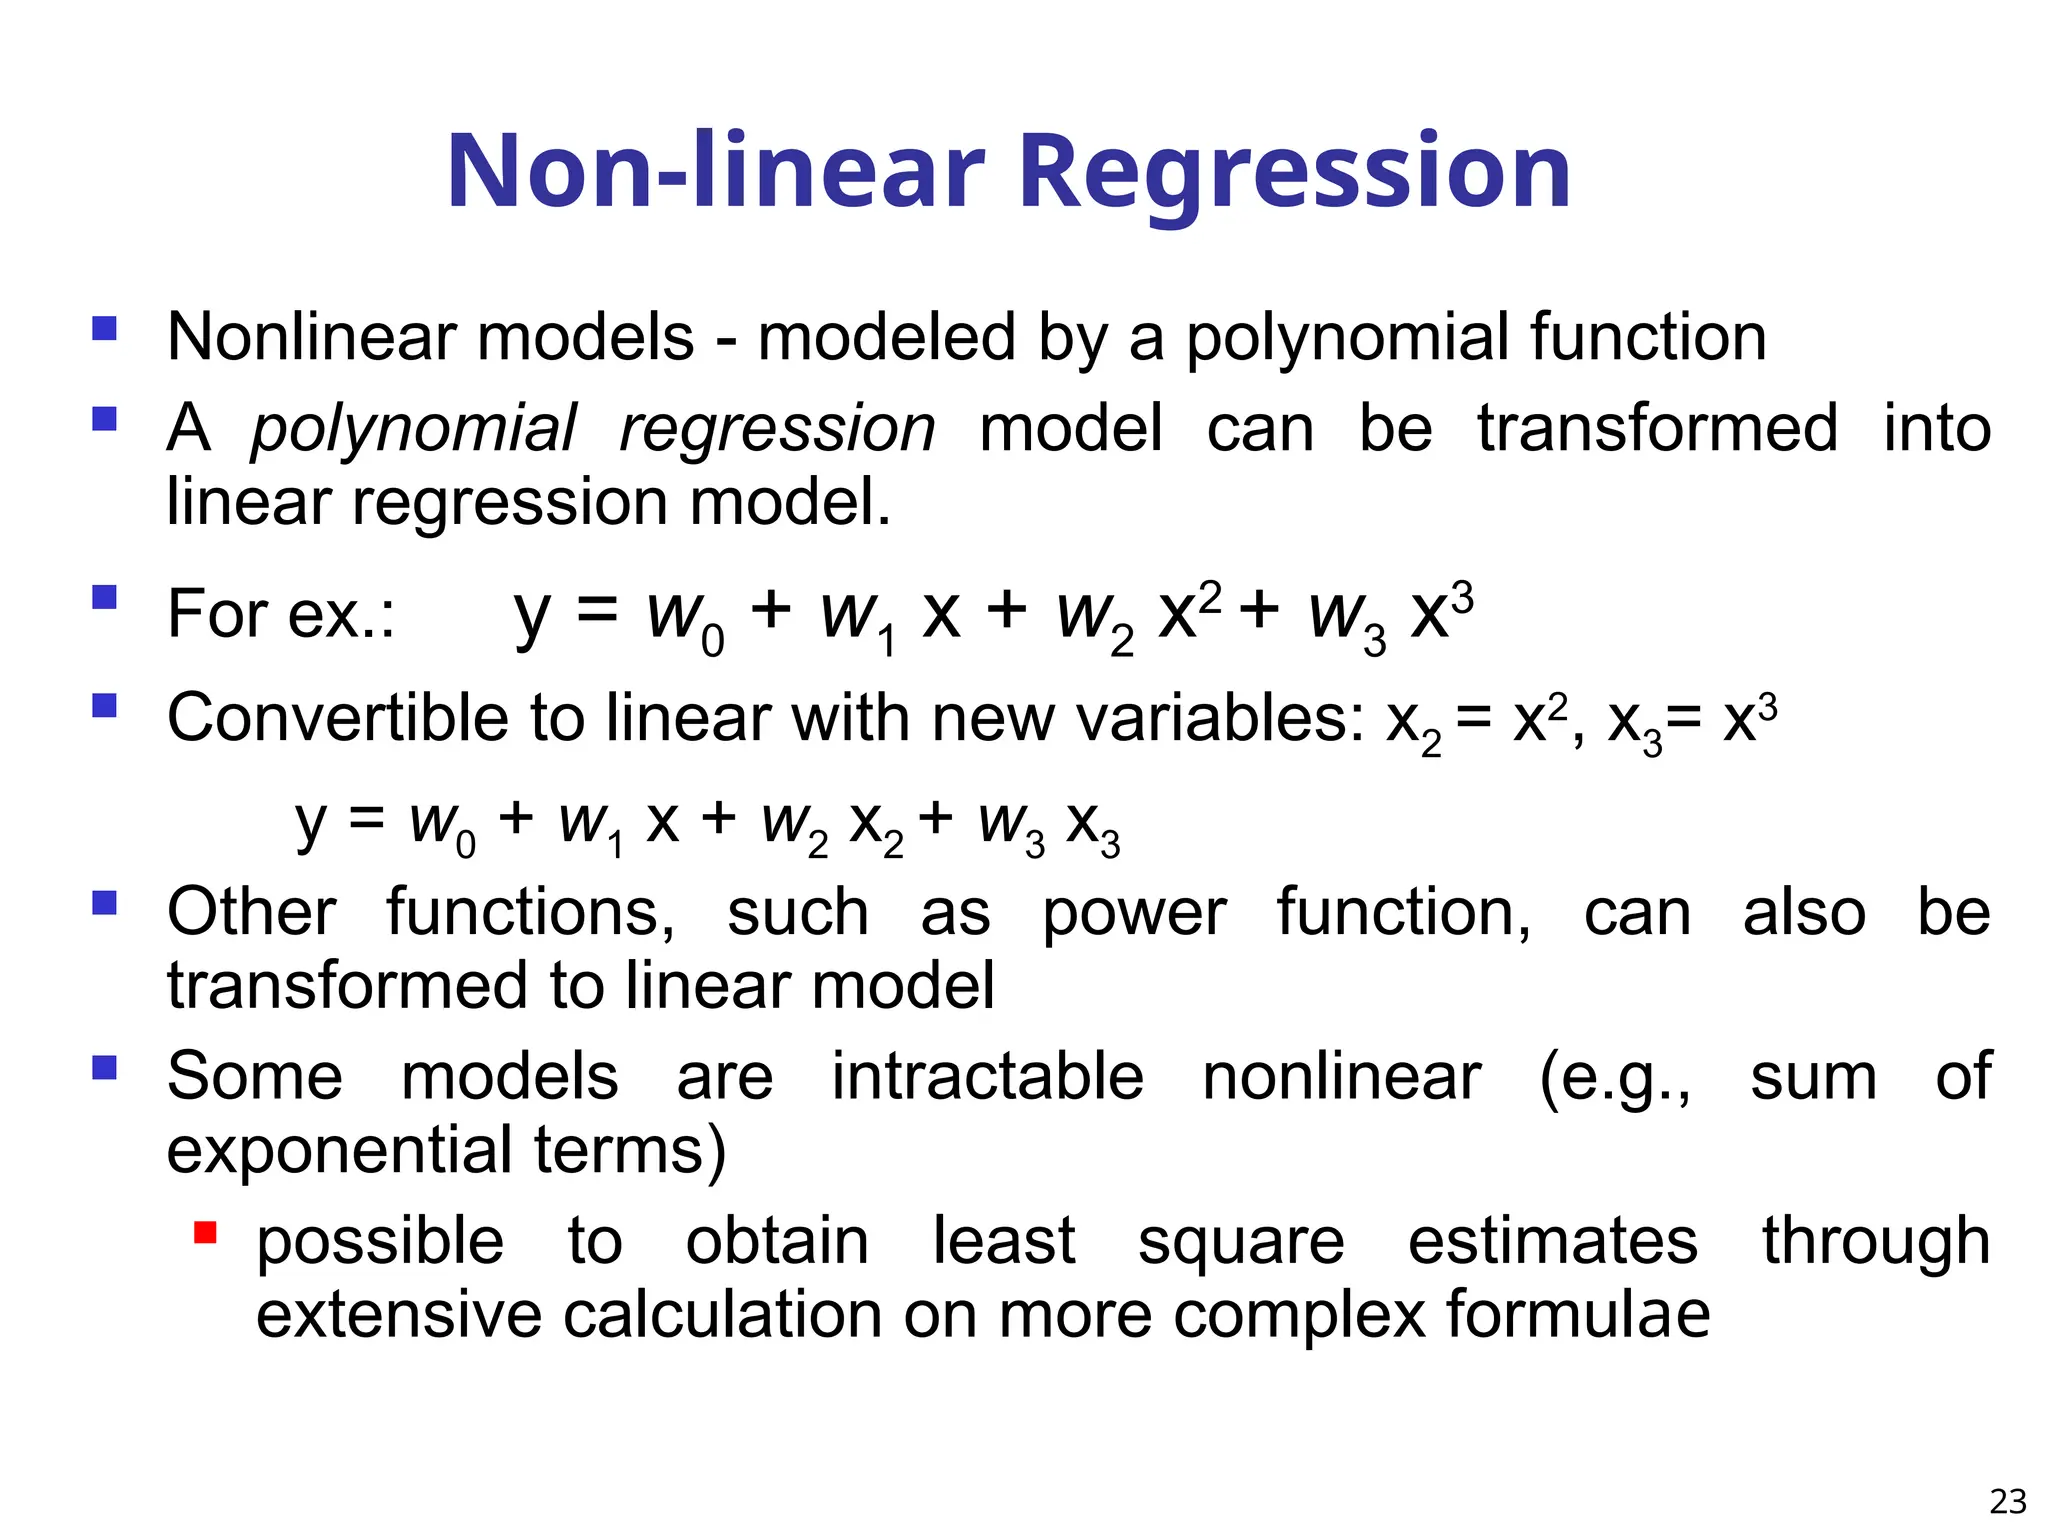
Nonlinear models- modeled by a polynomial function
A polynomial regression model can be transformed into
linear regression model.
For ex.: y = w0 + w1 x + w2 x2
+ w3 x3
Convertible to linear with new variables: x2 = x2
, x3= x3
y = w0 + w1 x + w2 x2 + w3 x3
Other functions, such as power function, can also be
transformed to linear model
Some models are intractable nonlinear (e.g., sum of
exponential terms)
possible to obtain least square estimates through
extensive calculation on more complex formulae
Non-linear Regression
23
![Multiple Regression Using Matrices
22
[β]=[XT
X]-1
[XT
Y]](https://image.slidesharecdn.com/unit3apredictivemodels-250911015009-128db3e5/75/It-is-a-Machine-learning-based-ppt-In-this-all-are-mentioned-22-2048.jpg)