Downloaded 38 times
![2
RENEWABLE POWER GENERATION COSTS IN 2022
© IRENA 2023
Unless otherwise stated, material in this publication may be freely used, shared, copied, reproduced, printed and/or stored, provided
that appropriate acknowledgement is given of IRENA as the source and copyright holder. Material in this publication that is attributed to
third parties may be subject to separate terms of use and restrictions, and appropriate permissions from these third parties may need to
be secured before any use of such material.
Citation:
IRENA (2022), Renewable power generation costs in 2022, International Renewable Energy Agency, Abu Dhabi.
ISBN 978-92-9260-544-5
Acknowledgements
This report was developed under the guidance of Roland Roesch (Director, IRENA Innovation and Technology Center) and
Michael Taylor (IRENA).
The report was authored by Michael Taylor, Sonia Al-Zoghoul and Pablo Ralon (IRENA), with assistance from Olga Sorokina
(European Energy Link Group).
The authors are grateful for the valuable contributions from Erick Ruiz Araya, Francis De Jaeger, Juan Pablo Jimenez Navarro,
Binu Parthan and Ludovico Del Vecchio (IRENA) in the preparation of this study.
This report benefited from the reviews and comments of numerous experts, including Ana Andrade (Direção Geral de Energia
e Geologia [DGEG]), Alex Campbell and Rebecca Ellis (IHA), Manuel Quero (Sunntics), Alexander Hogeveen Rutter (ISA),
Christoph Walter (DEA), Yuetao Xi (CREEI) and Feng Zhao (GWEC). All opinions and errors remain those of the authors.
Publications, editorial and communications support were provided by Francis Field, Stephanie Clarke, Nicole Bockstaller and
Daria Gazzola..
The report was copy-edited by Jonathan Gorvett and Stefanie Durbin, and a technical review was provided by Paul Komor.
The graphic design was provided by Ignacio de la Concepción Sanz.
For further information or to provide feedback: publications@irena.org
This report is available for download: www.irena.org/publications
Disclaimer
This publication and the material herein are provided “as is”. All reasonable precautions have been taken by IRENA to verify the reliability of the material
in this publication. However, neither IRENA nor any of its officials, agents, data or other third-party content providers provides a warranty of any kind,
either expressed or implied, and they accept no responsibility or liability for any consequence of use of the publication or material herein. The information
contained herein does not necessarily represent the views of all Members of IRENA. The mention of specific companies or certain projects or products does
not imply that they are endorsed or recommended by IRENA in preference to others of a similar nature that are not mentioned. The designations employed
and the presentation of material herein do not imply the expression of any opinion on the part of IRENA concerning the legal status of any region, country,
territory, city or area or of its authorities, or concerning the delimitation of frontiers or boundaries.
About IRENA
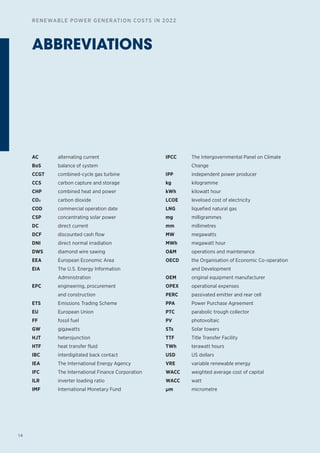
TThe International Renewable Energy Agency (IRENA) is an intergovernmental organisation
that supports countries in their transition to a sustainable energy future and serves as the
principal platform for international co-operation, a centre of excellence, and a repository of
policy, technology, resource and financial knowledge on renewable energy. IRENA promotes the
widespread adoption and sustainable use of all forms of renewable energy, including bioenergy,
geothermal, hydropower, ocean, solar and wind energy, in the pursuit of sustainable development,
energy access, energy security and low-carbon economic growth and prosperity. www.irena.org](https://image.slidesharecdn.com/irenarenewablepowergenerationcostsin2022-230829121119-ecbe0d29/85/IRENA-Renewable-Power-Generation-Costs-Report-2022-2-320.jpg)


![28
RENEWABLE POWER GENERATION COSTS IN 2022
IRENA’s cost analysis programme
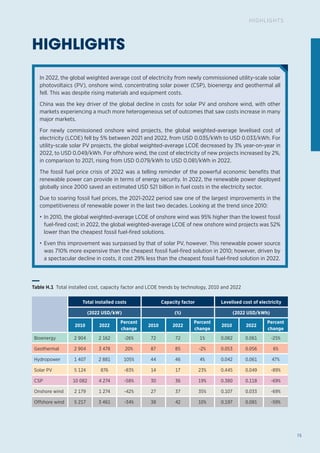
IRENA’s cost analysis programme has been collecting and reporting the cost and performance data of
renewable power generation technologies since 2012. The goal is to provide transparent, up‑to‑date cost
and performance data from a reliable source, given that these data are vital in ensuring the potential of
renewable energy is properly taken into account by policy makers, energy and climate modellers, and
other stakeholders. IRENA’s Member States also rely on this data collection and reporting. Without it, key
decision makers in government and the energy sector will struggle to correctly identify the magnitude of
the role renewable energy can play in meeting our shared economic, environmental and social goals for
the energy transition.
With high learning rates6
and rapid growth in installed capacity of renewable energy technologies, access
to comprehensive and up-to-date data – by market and technology – is essential. The body of data
represented by the IRENA Renewable Cost Database also allows time series analysis of key trends in costs
and performance, helping to support decisions around the next stage in the energy transition. IRENA’s
cost reports also provide an opportunity to examine recent trends in commodity costs and equipment
pricing and their impact on total installed costs in this period of cost inflation.
IRENA maintains two core databases, supplemented by more granular data for a range of metrics. These
have been created to ensure IRENA can respond to its Member States’ needs while also ensuring that
industry and civil society have easy access to the latest renewable power generation cost and performance
data. The two core databases are:
• The IRENA Renewable Cost Database: This includes project‑level cost and performance data for
around 2 200 GW of capacity from around 21 500 projects7
commissioned up to and including 2022.
• The IRENA Auction and Power Purchase Agreement (PPA) Database: This database contains data
on around 13 500 projects, or programme results, where pricing data are not disclosed for individual
winners.
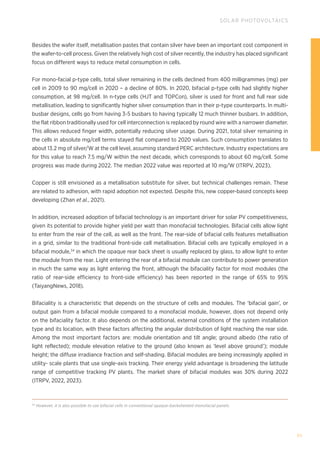
In summarising the latest cost and performance data for projects commissioned in 2022, as well as the
costs and trends for important equipment benchmarks (e.g. solar photovoltaic [PV] modules, wind turbine
prices, etc.) and technology characteristics (e.g. onshore wind turbine capacity sizes), this report presents
a consistent set of core metrics with which to measure the cost and performance of renewable power
generation technologies and how they have evolved over time.
The breadth and depth of the data in the IRENA Renewable Cost Database allows for a meaningful
understanding of variations between countries and technologies, as well as through time. These variations
are reported across each technology and and cost metric for an analysis of how different cost metrics have
changed through time between particular technologies (e.g. solar PV and onshore wind) and in different
markets for those technologies.
6
Learning rates are defined as the percentage reduction in cost or price for every cumulative doubling in production or installation.
7
This excludes projects with an installed capacity of less than 1 MW.](https://image.slidesharecdn.com/irenarenewablepowergenerationcostsin2022-230829121119-ecbe0d29/85/IRENA-Renewable-Power-Generation-Costs-Report-2022-28-320.jpg)


![58
RENEWABLE POWER GENERATION COSTS IN 2022
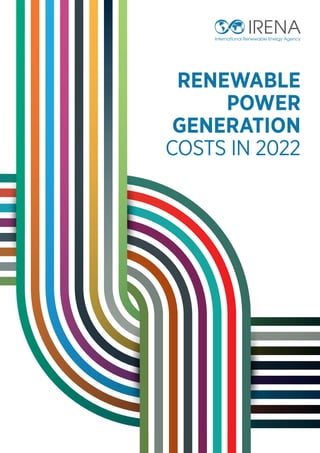
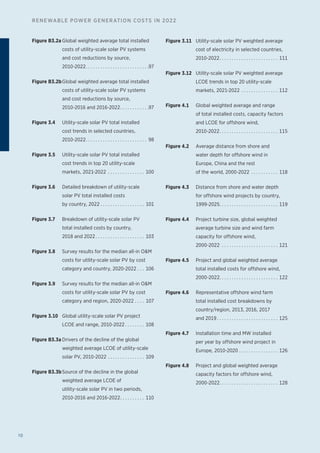
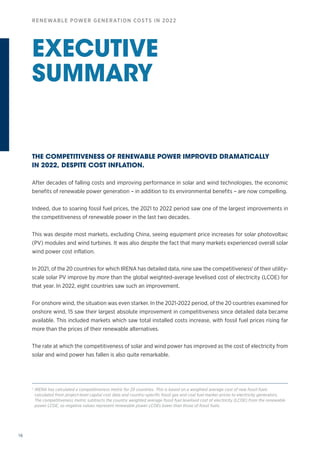
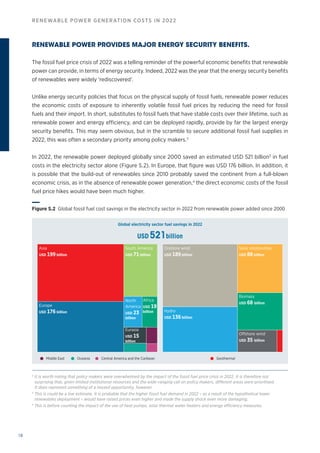
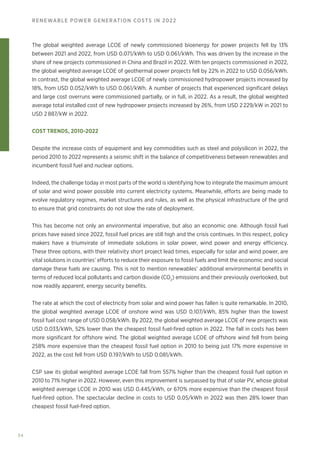
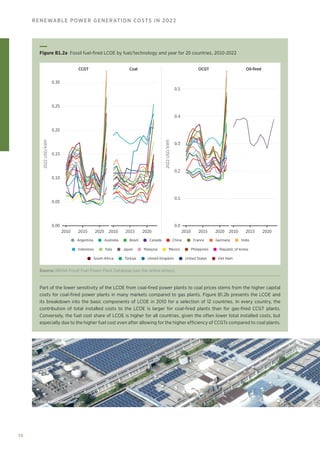
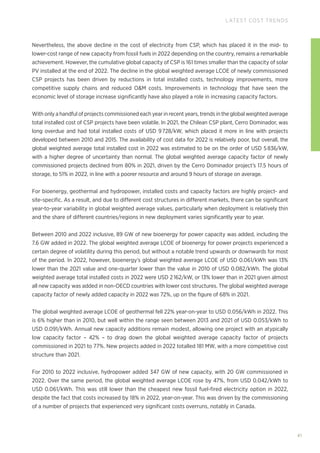
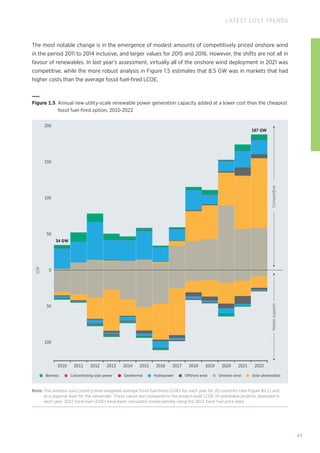
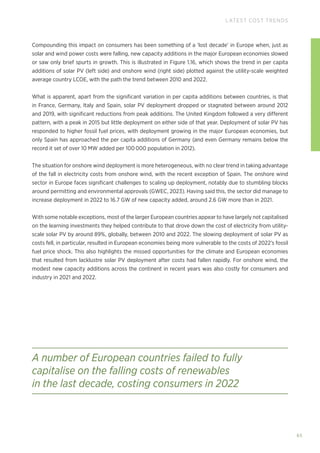
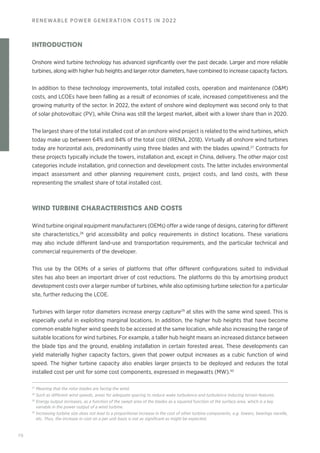
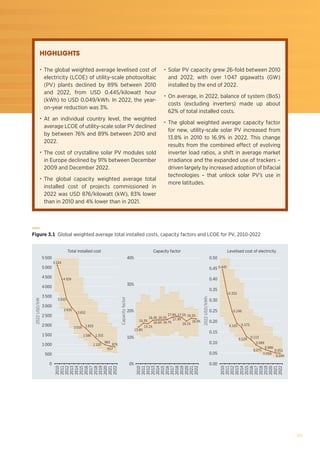
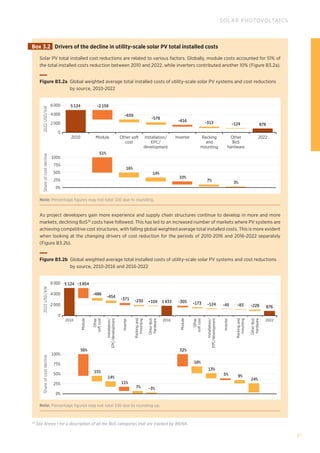
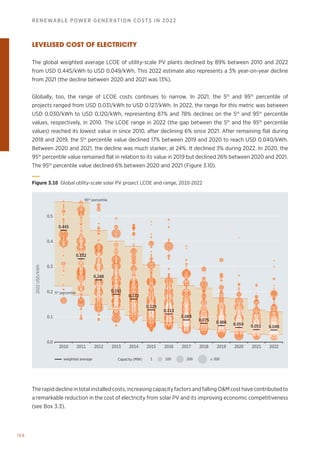
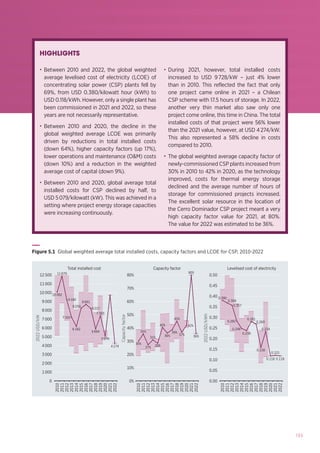
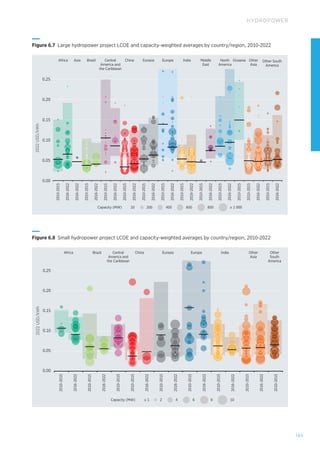
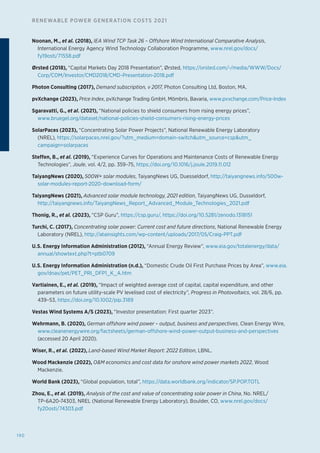
However, the recent LCOE reductions for onshore wind and relative slowing of cumulative capacity growth
(in percentage terms) have seen the LCOE learning rate for the period 2010 to 2022 leapfrog that of solar
PV (previously reported for the period 2010 to 2020 [IRENA, 2021]) to a remarkable 43.4% for the period
2010 to 2022. This is in part driven by the better characterisation of the WACC for technologies by market,
as well as the remarkable cost reductions in China and the continued improvement in turbine technology.
For the period 1984 to 2022, the learning rate was 14%, but again, there appears to be a structural break,
with two periods of very different learning rates.
The implications of these high learning rates for solar and wind power between 2010 and 2020 should
not be underestimated. In the power generation sector itself, they suggest that accelerated deployment
will reduce the cost of the transition. But they have a wider implication as well. They suggest, where the
same characteristics are at work that supported the learning rates for solar and wind (e.g. small modular
technologies, with ability to rapidly scale manufacturing and likely to have a breadth of competitive
suppliers) that the emerging solutions for the energy transition can be assessed against these criteria (and
others). Where similar possibilities for the scale-up exist, policy makers can have greater confidence that
costs will fall rapidly and can be more ambitious in their policy making.
Concentrating solar power Offshore wind Onshore wind Solar photovoltaic
200 500 1 000 2 000 5 000 20 000
10 000 50 000 100 000 200 000 500 000 1 000 000
2010
2010
2010
2010
2011
2011
2011
2011
2012
2012
2012
2012
2013 2016
2017
2016
2016
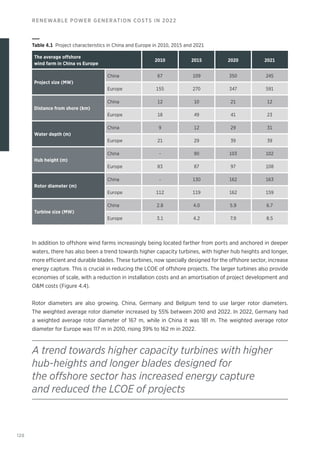
2017
2015
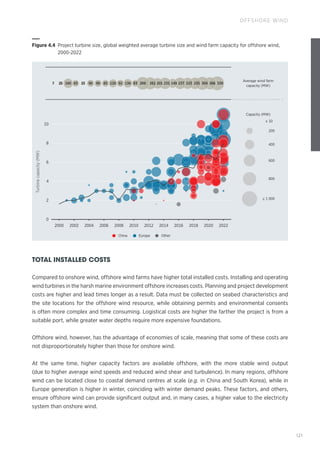
2018
2019
2018
2019
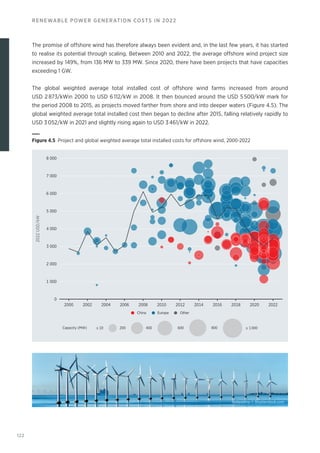
2018
2019 2020
2020
2020
2021
2021
2022
2021
2022
2020
2021
2022
2022
2013
2014
2014
0.010
0.015
0.020
0.030
0.040
0.050
0.070
0.100
0.150
0.200
0.300
0.400
0.500
2022
USD/kWh
Cumulative deployment (MW)
Fossil fuel cost range
Figure 1.12
The global weighted average LCOE learning curve trends for solar PV, CSP, and onshore and offshore
wind, 2010-2022](https://image.slidesharecdn.com/irenarenewablepowergenerationcostsin2022-230829121119-ecbe0d29/85/IRENA-Renewable-Power-Generation-Costs-Report-2022-58-320.jpg)


![72
RENEWABLE POWER GENERATION COSTS IN 2022
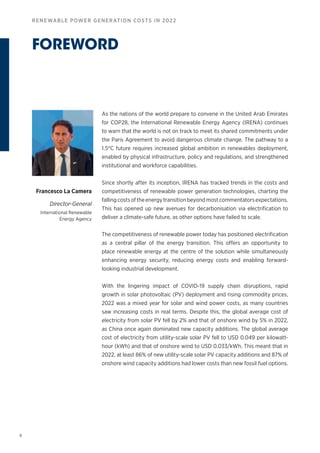
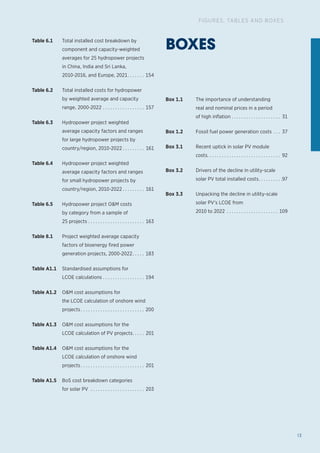
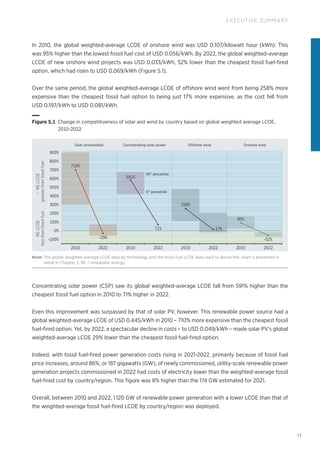
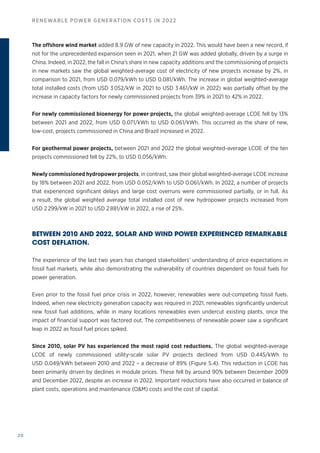
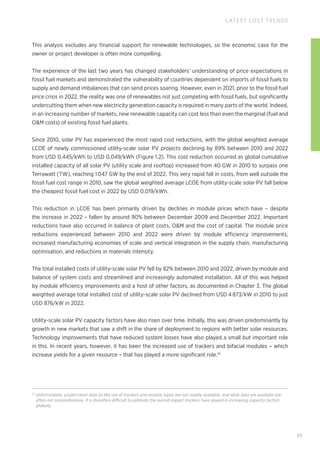
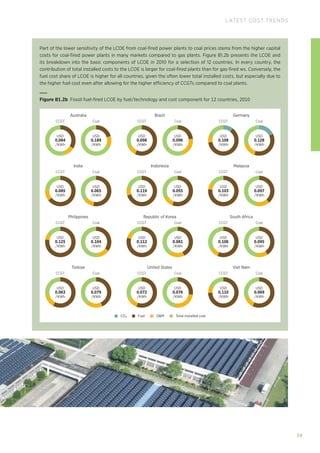
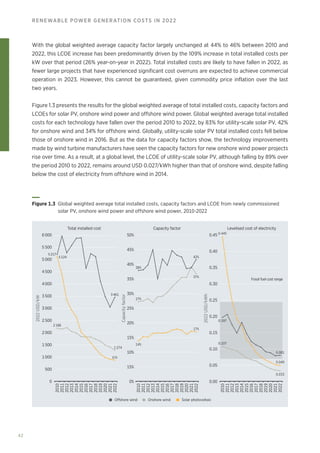
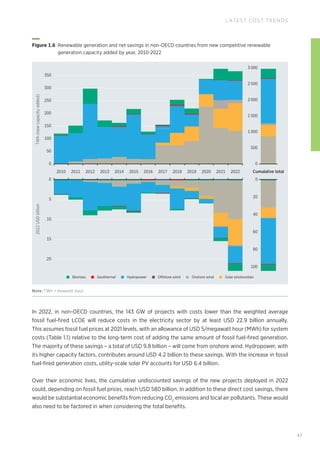
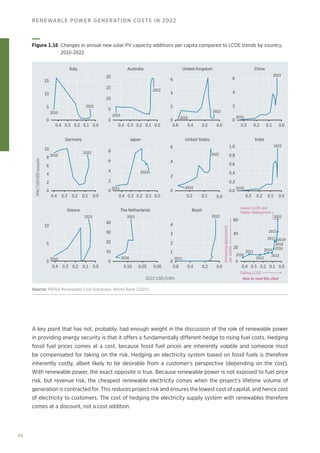
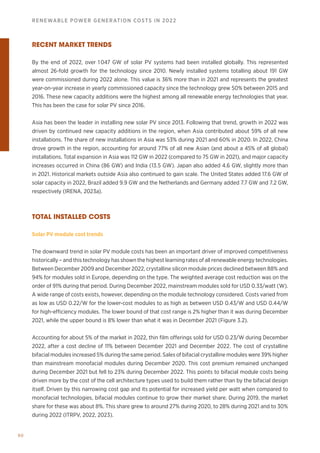
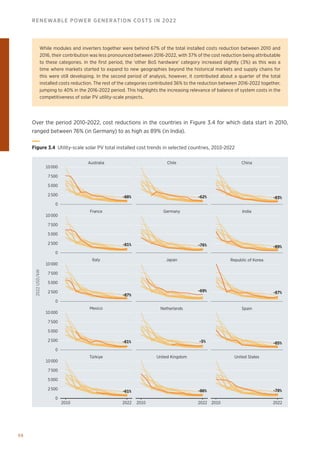
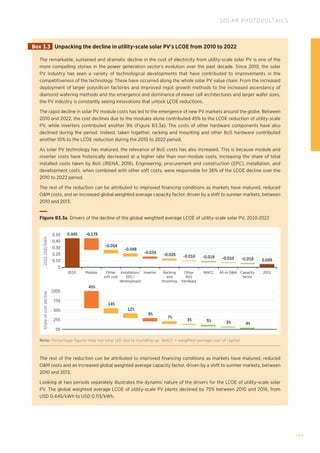
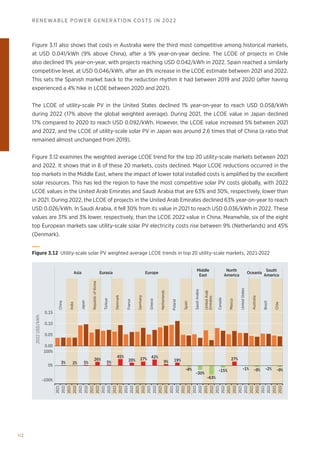
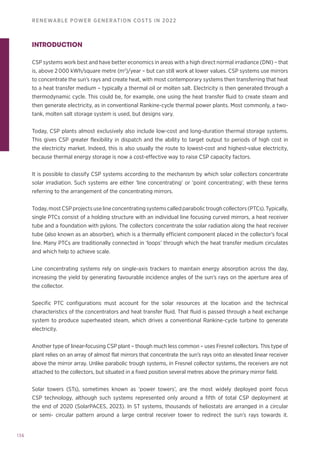
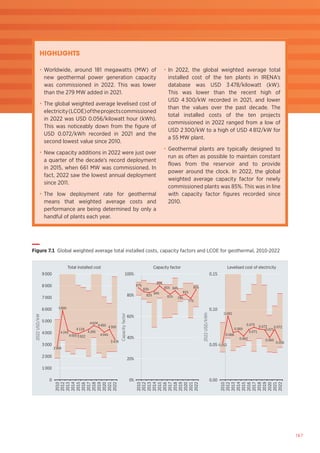
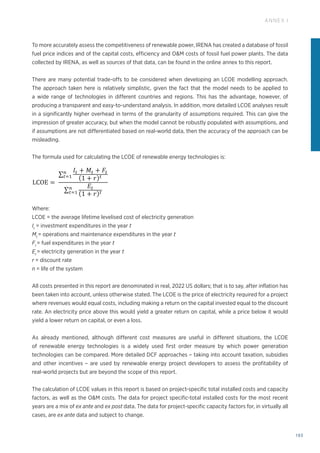
In 2022, contrary to the experience elsewhere, average Chinese wind turbine prices fell to around
USD 310/kW, as continued pressures from developers saw prices fall again, despite an upturn in Q3.
Globally, with greater competition among manufacturers, margins have come under increasing pressure.
Manufacturers’ turbine sales margins have fallen over time and, with increased commodity costs in 2021 and
2022, probably need to rise to return to sustainable levels (Blackburne, 2022). Increased competition is being
reinforced by the increased use of competitive procurement processes for renewable energy in a growing
number of countries. Increased competition has also led to acquisitions in the turbine and balance-of-plant
sectors and a trend of production moving to countries with lower manufacturing costs (Wood MacKenzie,
2020). This increased competition does not make the sector immune from the impact of supply and demand
imbalances, however. Significant growth in the market in 2020 and supply chain constraints due to COVID-19
saw wind turbine pricing in late 2020 and early 2021 tick up, with elevated prices continuing into 2022.
Quarterly turbine pricing ranged from USD 840/kW to USD 1089/kW for orders (excluding China) received in
2021 (BNEF, 2023; Vestas, 2023). This range widened somewhat in 2022, from USD 840/kW to USD 1175/kW,
but this corresponded with Vestas’s selling price dropping in Q1 2023 as the mix of orders by geographic
location changed (Vestas, 2023). It is too early to tell if prices will continue to ease in 2023.
The decline in turbine prices globally over the last decade occurred despite the increase in rotor diameters,
hub heights and nameplate capacities. In addition, price differences between turbines with differing rotor
diameters narrowed significantly in 2019. However, in late 2020, the gap between Class I and both Class II
and Class III31
wind turbines started to widen and has persisted into 2022 (BNEF, 2023).
31
This refers to the International Electrical Commission’s wind turbine classification. Broadly speaking, Class I wind turbines are designed
for the best wind speed sites and typically have shorter rotors, and Class III turbines are designed for poorer wind conditions where
larger rotor diameters and lower specific power (W/swept square metre [m2
]) are used to harvest the maximum energy.
Chinese turbine prices
Vestas average selling price
United States 5-100 MW
United States 5 MW
United States 100 MW
BNEF WTPI 100m Ø BNEF Class II
BNEF WTPI =100m Ø BNEF Class III
BNEF WTPI BNEF Class I
2022
USD/kW
0
2 500
2 000
1 500
1 000
500
1997
1998
1999
2000
2001
2002
2003
2004
2005
2006
2007
2008
2009
2010
2011
2012
2013
2014
2015
2016
2017
2018
2019
2023
2022
2021
2020
Figure 2.3 Wind turbine price indices and price trends, 1997-2023
Source: BNEF (2023); Vestas Wind Systems A/S (2023); Wiser et al. (2022); and IRENA Renewable Cost Database.](https://image.slidesharecdn.com/irenarenewablepowergenerationcostsin2022-230829121119-ecbe0d29/85/IRENA-Renewable-Power-Generation-Costs-Report-2022-72-320.jpg)


![94
RENEWABLE POWER GENERATION COSTS IN 2022
The efficiency of PERC modules, however, is expected to grow towards 22% in the next few years,
approaching its limits. In terms of cell architecture beyond PERC, likely candidates to drive efficiencies
higher take two main approaches: first, a focus on reducing losses at contacts (e.g. heterojunction [HJT]
and tunnel oxide passivated contact [TOPCon] technology); or second, by focusing on moving metallisation
to the rear of the cell to reduce front-side shading (e.g. interdigitated back contact [IBC] or cells).
Yet, at the module design level – independent from the cell – recent developments in technology have
contributed to increasing module power outputs. Half-cut cells, multi- busbars and high-density cell
packing pathways, such as shingling and others, are clear examples of this. These technologies are also
expected to be increasingly utilised in the future.
Until recently, the prevalent module design has been based on square, or pseudo-square, crystalline silicon
cells. These have an approximate side length from 156 millimetres (mm) to 159 mm and are based on wafer
formats known as M2 and G1. Cells are typically connected in series using metallic ribbon, soldered to the
front busbars of one cell and the rear busbars/soldering pads of the adjacent cells. As cells have evolved,
busbars have increased in number from 2 per cell to 4-8 per cell in mainstream production. With the
aim of maximising power output, this typical module design is changing rapidly. Alternative designs with
variants such as half-cell modules, shingled cell modules and multi-busbar cells/modules (with as many
as 12 thinner busbars) continue to mature. Newer modules are increasingly based on larger wafer formats,
and current wafer sizes are likely to rapidly give way to larger formats of 182 mm (M10) to 210 mm (G12)
in side length.
These technological changes have meant that the power output of modules has seen important growth in
recent years. For example, in 2017, typical module power output for top modules was 350 W, while currently,
500 W is the new norm, though modules with output beyond 600 W are also already commercial. Given
the diversification of module designs, however, a pure comparison of module power rating as labelled
may be misleading, with the efficiency of the modules remaining the most important performance metric
(TaiyangNews 2020, 2021; ITRPV 2022; Lin, 2019).
The sustainability of the materials used in solar PV modules is gaining in importance as the market continues
to grow globally. Technological developments related to this are becoming the focus of many industry
efforts, particularly in lieu of the 2021 supply chain constraints and the related supply/demand imbalances
affecting manufacturing and shipping of solar PV modules and other system components.
Polysilicon consumption reduction remains as relevant as ever in this context, and industry efforts continue
in this regard. For example, improved wafer sawing technologies, notably diamond wire sawing (DWS),
have taken over from earlier slurry-based wafer sawing, contributing to reduced polysilicon use in the
wafering step. The amount of polysilicon lost during cutting the wafers (kerf loss) has also declined. During
2021, kerf loss values of 60 micrometers (μm) were already typical (a decline of more than 62% from 2010).
During 2022 they have been reported below that at 57 μm (a decline of about 64% since 2010).](https://image.slidesharecdn.com/irenarenewablepowergenerationcostsin2022-230829121119-ecbe0d29/85/IRENA-Renewable-Power-Generation-Costs-Report-2022-94-320.jpg)


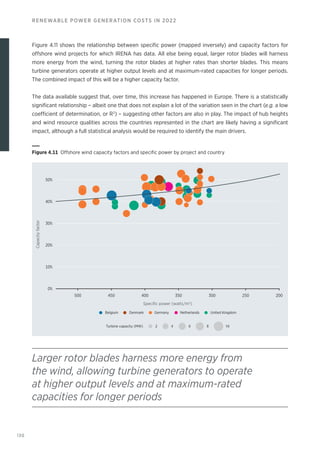
![127
OFFSHORE WIND
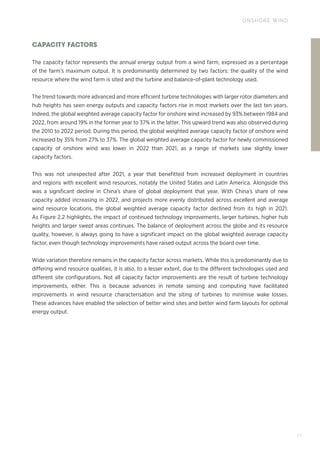
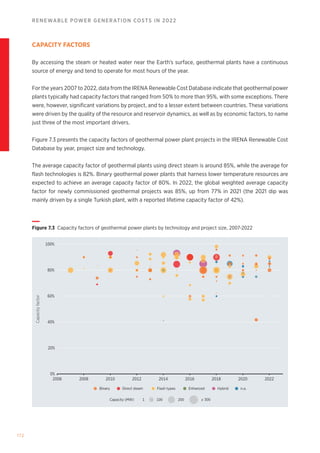
CAPACITY FACTORS
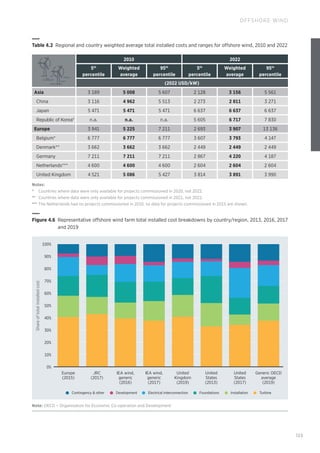
The range of capacity factors for offshore wind farms is very wide due to differences in the meteorology
between wind farm sites, the technology used and the wind farm’s configuration, i.e. the optimal turbine
spacing to minimise wake losses and increase energy yields. Optimisation of the OM strategy over the life
of the project is also an important determinant of the realised lifetime capacity factor.
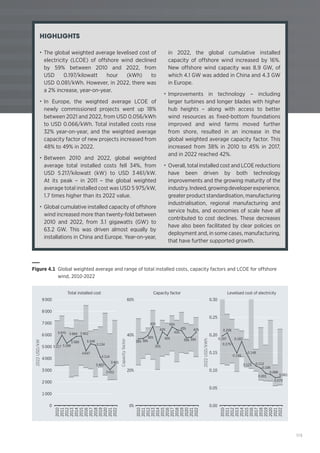
Between 2010 and 2022, the global weighted average capacity factor of newly commissioned offshore
wind farms grew from 38% to 42%. This was driven by wind turbines with higher hub heights and larger
swept areas that enable turbines to harvest more electricity from the same resource. In 2022, the capacity
factor range (5th
and 95th
percentile) for newly installed projects was between 28% and 50% (Figure 4.8).
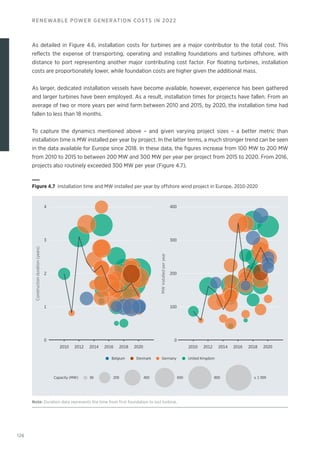
The decline in the global weighted average capacity factor since 2017 and until 2021 has predominantly,
but not entirely, been driven by the increased share of China in global deployment (around 54% of new
capacity added in 2022). As discussed, China’s wind resource is generally not as good as in the North
Sea, even well offshore, while projects, historically, tended to be near-shore or inter-tidal – locations that
generally have poorer wind resources than those available further offshore. China’s projects also did not
use the very large, turbines deployed in Europe and elsewhere. However, turbine size jumped in 2022, as
developers had to adjust to new 'grid parity' regime with the end of the FiT programme.
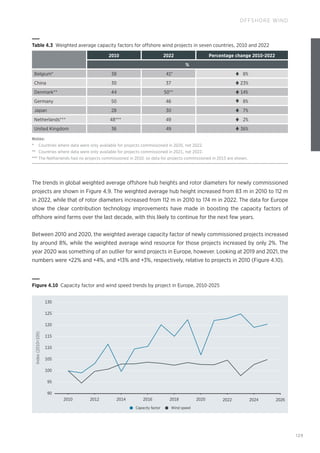
The weighted average capacity factor for projects commissioned in Europe increased by 26% (or
ten percentage points) from 39% in 2010 to 49% in 2022. In Europe, the 5th
and 95th
percentile capacity
factorsforprojectscommissionedin2022were45%and52%,respectively.Incontrast,theweightedaverage
capacity factor for projects commissioned in China in 2022 was 37%, while the 5th
and 95th
percentiles were
30% and 43%, respectively.
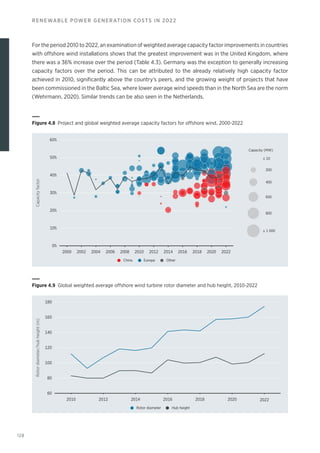
Figure 4.9 shows that both offshore wind rotor diameter and hub height followed a similar, increasing
trend over the period 2010 to 2022. The turbine rotor diameter experienced a 56% increase over that
period, growing from a weighted average value of 112 m to 175 m. Over the same period, turbine hub height
grew by 35%, from a weighted average of 83 m to 112 m.
With rotor diameters increasing faster than both hub heights and turbine sizes, the specific power of wind
turbines (measured in watts per square metre [W/m2
]) has fallen over time, particularly in Europe. This has
important implications for capacity factor trends, as, all else being equal, in many situations, lower specific
power levels will result in higher capacity factors.
There has also been a trend towards reduced downtime as manufacturers have integrated experience
from operating wind farm models into new, more reliable designs. It is also worth noting the experience in
optimising OM practices to reduce unscheduled maintenance that has been unlocked by improvements in
data collection and analytics, allowing for predictive maintenance and production output optimisation. In
addition, improvements in the development stage, due to greater experience, have led to better methods
for wind resource characterisation when it comes to identifying the best sites, and improved wind farm
designs that optimise operational output.](https://image.slidesharecdn.com/irenarenewablepowergenerationcostsin2022-230829121119-ecbe0d29/85/IRENA-Renewable-Power-Generation-Costs-Report-2022-127-320.jpg)

![146
RENEWABLE POWER GENERATION COSTS IN 2022
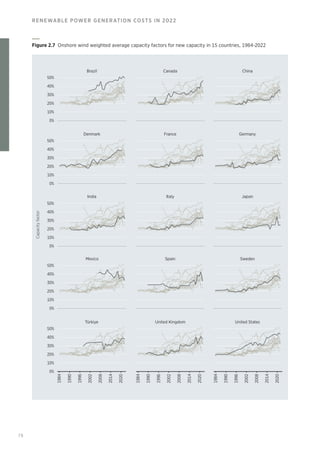
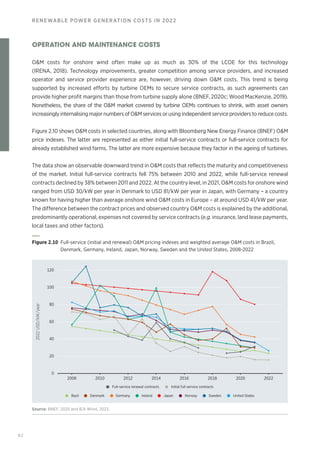
Historically, the largest individual OM cost for CSP plants has been expenditure on receiver and mirror
replacements. As the market has matured, however, experience – as well as new designs and improved
technology – have helped reduce failure rates for receivers and mirrors, driving down these costs.
In addition, personnel costs represent a significant component of OM, with the mechanical and electrical
complexity of CSP plants relative to solar PV, in particular, driving this. Insurance charges also continue to
be an important further contributor to OM costs. These typically range between 0.5% and 1% of the initial
capital outlay (a figure that is lower than the total installed cost).
With some exceptions, typical OM costs for early CSP plants still in operation today range from
USD 0.02/kWh to USD 0.04/kWh. This is likely a good approximation for the current levels of OM
in relevant markets for projects built in and around 2010, globally. This is so, even if it is based on an
analysis relying on a mix of bottom-up engineering estimates and best-available reported project data
(IRENA, 2018; Li et al., 2015; Turchi, 2017; Zhou, Xu and Wang, 2019).
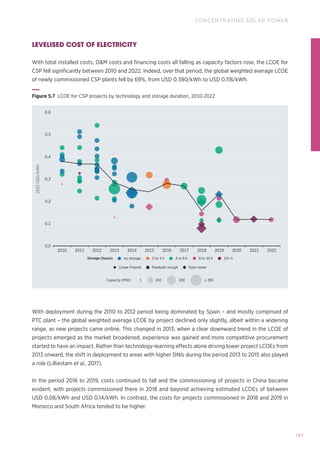
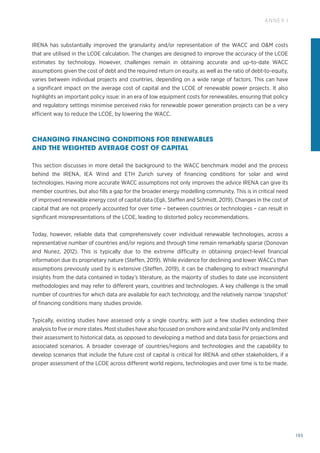
Analysis by IRENA undertaken in collaboration with the Institute of Solar Research (Das Institut für
Solarforschung des Deutschen Zentrums für Luft- und Raumfahrt [DLR]) shows, however, that more
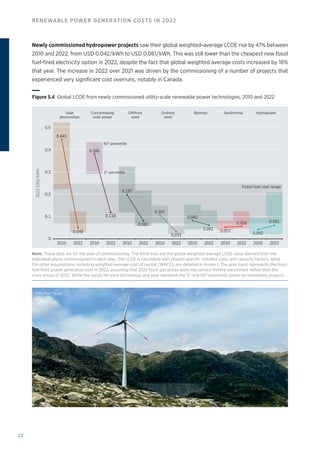
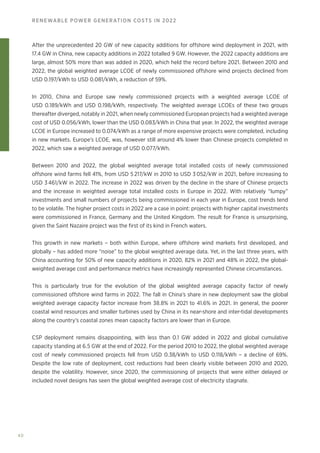
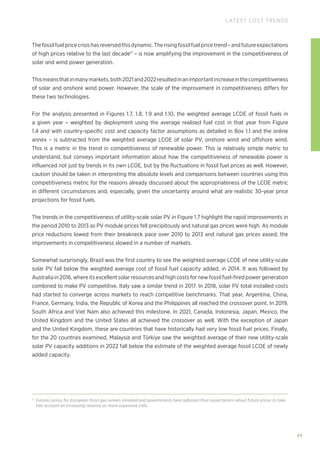
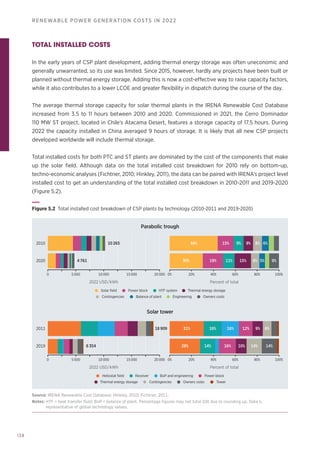
competitive OM costs are possible in a range of markets (Table 5.1). In these, projects achieved financial
closure in 2019 and 2020.
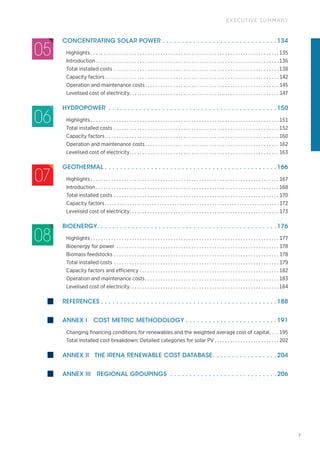
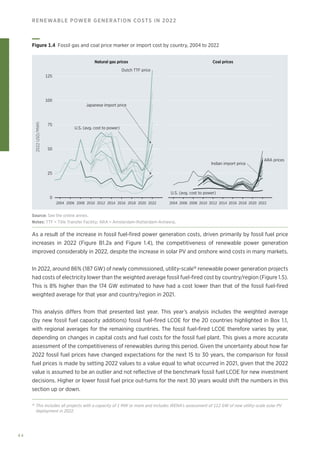
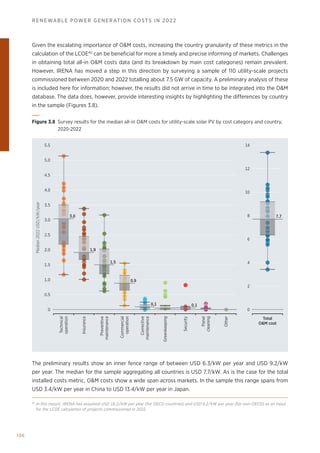
The OM costs per kWh in many of these markets are high in absolute terms, compared to solar PV and
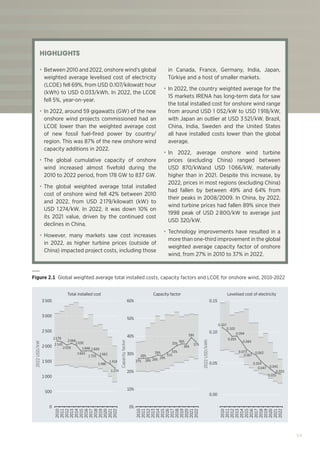
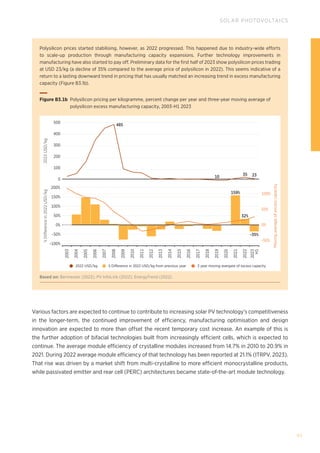
many onshore wind farms. However, they are about 18% to 20% of the LCOE for comparable projects in G20
countries. Taking this into account, the LCOE calculations in the following section reflect OM costs in the
IRENA Renewable Cost Database that declined from a capacity weighted average of USD 0.037/kWh in 2010
to USD 0.022/kWh in 2022 (41% lower than in 2010). The weighted average value has stayed flat since 2020.
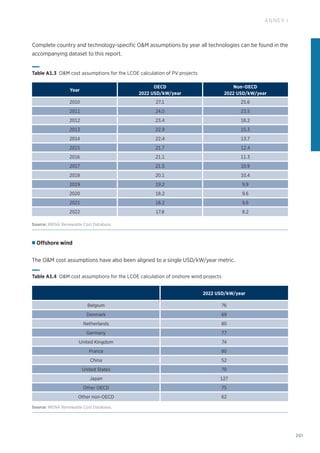
Table 5.1 All-in (insurance included) OM cost estimates for CSP plants in selected markets, 2019-2020
Country
Parabolic trough collectors Solar tower
(2022 USD/kWh) (2022USD/kWh)
Argentina 0.028 0.026
Australia 0.030 0.029
Brazil 0.022 0.022
China 0.024 0.020
France 0.035 0.030
India 0.017 0.017
Italy 0.028 0.026
Mexico 0.018 0.017
Morocco 0.014 0.013
Russian Federation 0.027 0.025
Saudi Arabia 0.013 0.012
South Africa 0.014 0.013
Spain 0.027 0.025
Türkiye 0.020 0.018
United Arab Emirates 0.020 0.022
United States of America 0.027 0.024](https://image.slidesharecdn.com/irenarenewablepowergenerationcostsin2022-230829121119-ecbe0d29/85/IRENA-Renewable-Power-Generation-Costs-Report-2022-146-320.jpg)


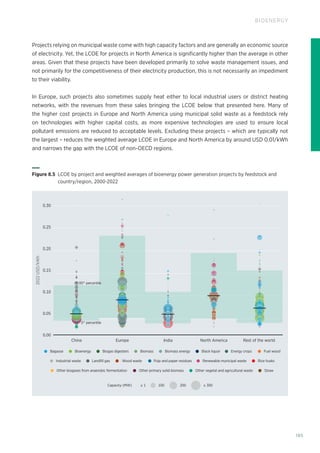
![179
BIOENERGY
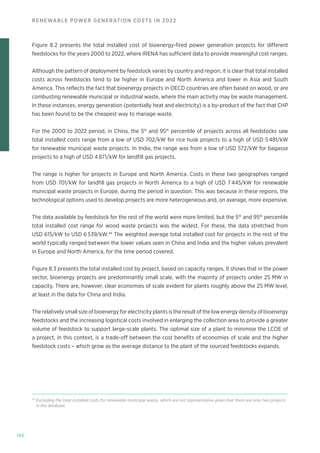
In addition to cost, the physical properties of the feedstocks matter because they will differ in ash content,
density, particle size and moisture, with heterogeneity in quality. These factors also have an impact on the
transportation, pre-treatment and storage costs, as well as the appropriateness of different conversion
technologies. Some of these are relatively robust and can cope with varied feedstocks, while others require
more uniformity (e.g. some gasification processes).
A key cost consideration for bioenergy is that most forms have relatively low energy density. Collection
and transport costs often therefore dominate the costs of feedstocks derived from forest residues and
dedicated energy crops. A consequence of this is that logistical costs start to increase significantly as the
distance to the power plant from the feedstocks that need to be sourced increases. In practical terms, this
tends to limit the economic size of bioenergy power plants, as the lowest cost of electricity is achieved
once feedstock delivery reaches a certain radius around the plant.
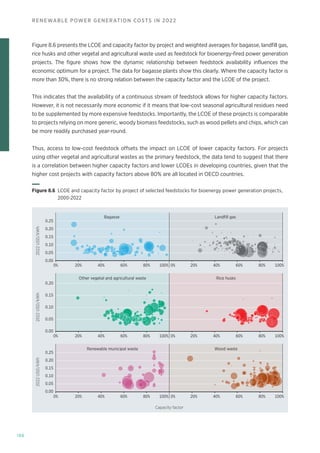
For biomass technologies, the typical share of the feedstock cost in the total LCOE ranges between 20%
and 50%. Prices for biomass sourced and consumed locally, however, are difficult to obtain. This means
that whatever market indicators for feedstock costs are available must be used as proxies. Alternatively,
estimates of feedstock costs from techno-economic analyses that may not necessarily be representative
or up to date can be used (see IRENA [2015] for a more detailed discussion of feedstock costs).
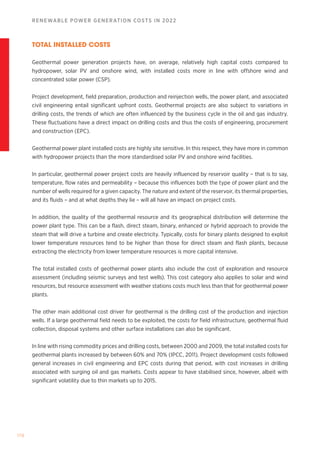
TOTAL INSTALLED COSTS
Different regions have differing costs in biomass power generation, with both a technology component
and a local cost component in total cost.
Projects in emerging economies tend to have lower investment costs than projects in OECD countries. This
is because emerging economies often benefit from lower labour and commodity costs. This allows for the
deployment of lower cost technologies with reduced emission control investments, albeit with higher local
pollutant emissions, in some cases.
The main categories in the total investment costs of a biomass power plant are: planning, engineering and
construction costs; fuel handling and preparation machinery; and other equipment (e.g. the prime mover
and fuel conversion system). Additional costs are derived from grid connection and infrastructure (e.g. civil
works and roads).
Equipment costs tend to dominate, but specific projects can have high costs for infrastructure and logistics,
or for grid connection when located in remote areas. CHP biomass installations have higher capital costs.
Yet, their higher overall efficiency (around 80% to 85%) and their ability to produce heat and/or steam for
industrial processes – or for space and water heating through district heating networks – can significantly
improve their economics.](https://image.slidesharecdn.com/irenarenewablepowergenerationcostsin2022-230829121119-ecbe0d29/85/IRENA-Renewable-Power-Generation-Costs-Report-2022-179-320.jpg)

![188
RENEWABLE POWER GENERATION COSTS 2021
Anzinger, N., and Kostka, G. (2015), Offshore wind power expansion in Germany: Scale, patterns and causes
of time delays and cost overruns, Hertie School of Governance, Berlin, Germany, www.hertie-school.org/
fileadmin/2_Research/2_Research_directory/Research_projects/Large_infrastructure_projects_in_
Germany_Between_ambition_and_realities/4_WP_Offshore_Wind_Energy.pdf
Bernreuter (2022), Price trend: Current level, chart, forecast history of the polysilicon price, Bernreuter
Research, www.bernreuter.com/polysilicon/price-trend/
BNEF (2020), 2H 2020 wind operations and maintenance price index, Bloomberg New Energy Finance.
BNEF (2023), 1H 2023 Wind Turbine Price Index: Down From the Peak, Bloomberg New Energy Finance.
Bolinger, M., et al. (2022), Utility-Scale Solar, 2022 Edition, LBNL, https://emp.lbl.gov/publications/utility-
scale-solar-2022-edition
EEA (2009), Europe’s onshore and offshore wind energy potential, European Environment Agency,
Copenhagen, Denmark, www.energy.eu/publications/a07.pdf
EIA (2017), Annual Energy Outlook 2017 with projections to 2050 (summer update), US Energy Information
Administration (EIA).
Ember (2023), European Electricity Review 2023, Ember, https://ember-climate.org/insights/research/
european-electricity-review-2023/
Energy Trend (2022), Solar price, Trend Force, www.energytrend.com/solar-price.html
Eurostat (2023a), “Electricity prices for household consumers - bi-annual data (from 2007 onwards)
[NRG_PC_204__custom_6511473]”, https://ec.europa.eu/eurostat/databrowser/view/NRG_PC_204/
default/table?lang=en
Eurostat (2023b), “Electricity prices for non-household consumers - bi-annual data (from 2007 onwards)
[NRG_PC_205__custom_6511374]”.
Eurostat (n.d.), “Comext: Eurostat statistics on international trade in goods”, https://ec.europa.eu/eurostat/
comext/newxtweb/ (accessed 5 May 2022).
Fichtner (2010), Technology Assessment of CSP Technologies for a Site Specific Project in South Africa: Final
Report, The World Bank Energy Sector Management Assistance Program (ESMAP), Washington, D.C.
Garcia-Casals, X., and Bianco, E. (2022), Potential limitations of marginal pricing for a power system based on
renewables, Technical Paper 3/2022, International Renewable Energy Agency, Abu Dhabi, www.irena.org/
Technical-Papers/Potential-Limitations-of-Marginal-Pricing-for-a-Power-System-Based-on-Renewables
GlobalData (2023), “Solar Power Sector, Generation and Markets Database”, www.globaldata.com/data-
insights/listing/ search/?industry=4800016q[]=Solar%2520power%2520sector (accessed 5 May 2023).
Green, R., and Vasilakos, N. (2011), “The economics of offshore wind”, Energy Policy, vol. 39/2, pp. 496–502,
https://doi.org/10.1016/j.enpol.2010.10.011
Greenpeace (2015), Energy [R]Evolution. A Sustainable World Energy Outlook 2015, Greenpeace;
SolarPower Europe; GWEC, www.greenpeace.org/archive-international/Global/international/publications/
climate/2015/Energy-Revolution-2015-Full.pdf
REFERENCES](https://image.slidesharecdn.com/irenarenewablepowergenerationcostsin2022-230829121119-ecbe0d29/85/IRENA-Renewable-Power-Generation-Costs-Report-2022-188-320.jpg)
![191
ANNEX I
COST METRIC METHODOLOGY
Cost can be measured in different ways, with different cost metrics bringing their own insights. The costs
that can be examined include equipment costs (e.g. photovoltaic modules or wind turbines), financing
costs, total installed costs, fixed and variable operating and maintenance costs (OM), fuel costs (if any),
and the levelised cost of electricity (LCOE).
The analysis of costs can be very detailed, but for comparison purposes and transparency, the approach
used here is a simplified one that focusses on the core cost metrics for which good data are readily
available. This allows greater scrutiny of the underlying data and assumptions, improves transparency and
confidence in the analysis, while facilitating the comparison of costs by country or region for the same
technologies, enabling the identification of the key drivers in any cost differences.
The five key indicators that have been selected are:
• equipment cost (factory gate, free onboard [FOB], and delivered at site);
• total installed project cost, including fixed financing costs;
• capacity factor by project; and
• the LCOE.
The analysis in this paper focuses on estimating the costs of renewables from the perspective of private
investors, whether they are a state-owned electricity generation utility, an independent power producer
(IPP), or an individual or community looking to invest in small-scale renewables. The analysis excludes the
impact of government incentives or subsidies, system balancing costs associated with variable renewables
and any system-wide cost-savings from the merit order effect. Furthermore, the analysis does not take
into account any CO2
pricing or the benefits of renewables in reducing other externalities (e.g. reduced
local air pollution or contamination of the natural environment). Similarly, the benefits of renewables being
insulated from volatile fossil fuel prices have not been quantified. These issues are important but are
covered by other programmes of work at IRENA.](https://image.slidesharecdn.com/irenarenewablepowergenerationcostsin2022-230829121119-ecbe0d29/85/IRENA-Renewable-Power-Generation-Costs-Report-2022-191-320.jpg)
![192
RENEWABLE POWER GENERATION COSTS IN 2022
Clear definitions of the technology categories are provided, where this is relevant, to ensure that cost
comparisons are robust and provide useful insights (e.g. small hydropower vs. large hydropower). Similarly,
functionality has to be distinguished from other qualities of the renewable power generation technologies
being investigated (e.g. concentrating solar power [CSP] with and without thermal energy storage).
This is important to ensure that system boundaries for costs are clearly set and that the available data are
directly comparable. Other issues can also be important, such as cost allocation rules for combined heat
and power plants, and grid connection costs.
The data used for the comparisons in this paper come from a variety of sources, such as IRENA Renewable
Costing Alliance members, business journals, industry associations, consultancies, governments, auctions
and tenders. Every effort has been made to ensure that these data are directly comparable and are for
the same system boundaries. Where this is not the case, the data have been corrected to a common basis
using the best available data or assumptions. These data have been compiled into a single repository – the
IRENA Renewable Cost Database – that includes a mix of confidential and public domain data.
An important point is that, although this report examines costs, strictly speaking, the data points available
are actually prices – which are sometimes not even true market average prices, but price indicators
(e.g. surveyed estimates of average module selling prices in different markets).
The difference between costs and prices is determined by the amount above, or below, the normal profit
that would be seen in a competitive market.
The rapid growth of renewables markets from a small base means that the market for renewable power
generation technologies is sometimes not well balanced. As a result, prices can rise significantly above
costs in the short term if supply is not expanding as fast as demand, while in times of excess supply, losses
can occur, and prices may be below production costs. This can make analysing the cost of renewable power
generation technologies challenging for some technologies in given markets at certain times. Where costs
are significantly above or below where they might be expected to be in their long- term trend, every effort
has been made to identify the causes.
Although every effort has been made to identify the reasons why costs differ between markets for individual
technologies, the absence of the detailed data required for this type of analysis often precludes a definitive
answer. IRENA conducted a number of analyses focusing on individual technologies and markets in an
effort to fill this gap (IRENA, 2016a and 2016b).
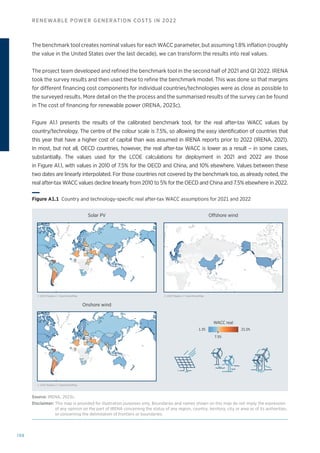
The LCOE of renewable energy technologies varies by technology, country and project, based on the
renewable energy resource, capital and operating costs, and the efficiency/performance of the technology.
The approach used in the analysis presented here is based on a discounted cash flow (DCF) analysis. This
method of calculating the cost of renewable energy technologies is based on discounting financial flows
(annual, quarterly or monthly) to a common basis, taking into consideration the time value of money. Given
the capital-intensive nature of most renewable power generation technologies and the fact that fuel costs
are low, or often zero, the weighted average cost of capital (WACC) used to evaluate the project – often
also referred to as the discount rate – has a critical impact on the LCOE.](https://image.slidesharecdn.com/irenarenewablepowergenerationcostsin2022-230829121119-ecbe0d29/85/IRENA-Renewable-Power-Generation-Costs-Report-2022-192-320.jpg)
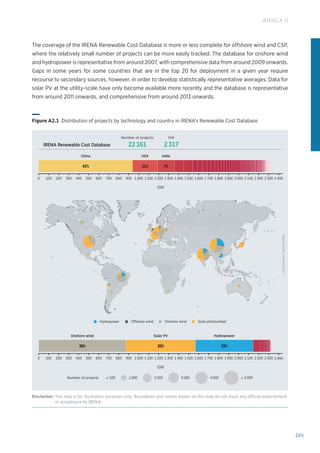

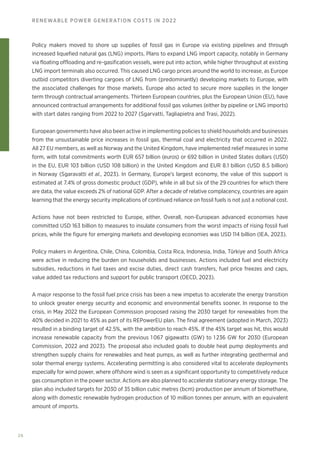
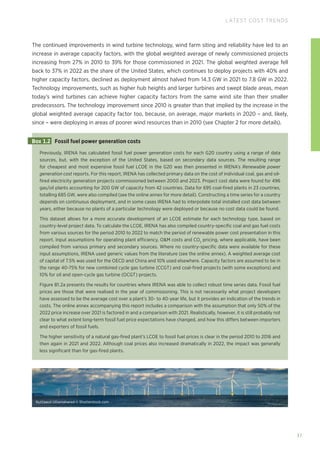
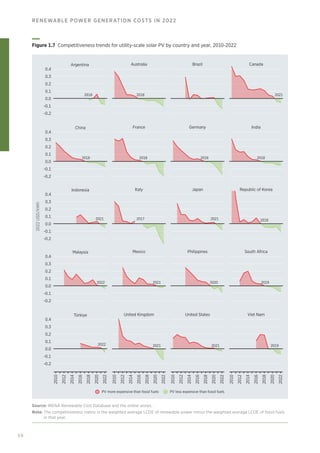
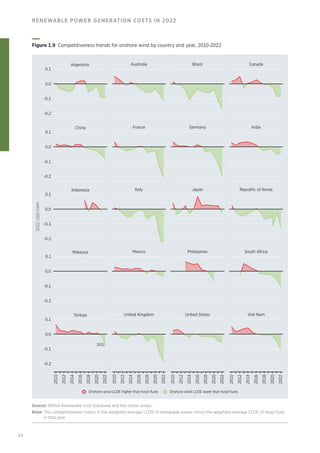
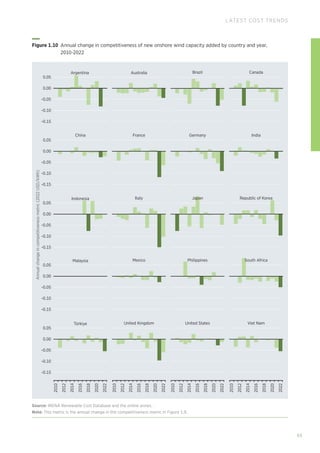
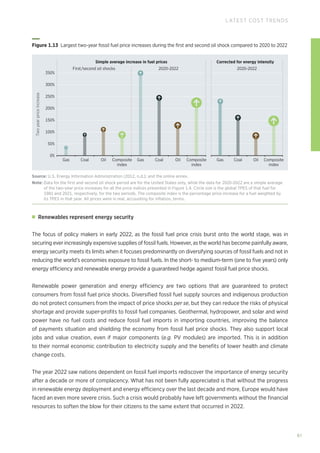
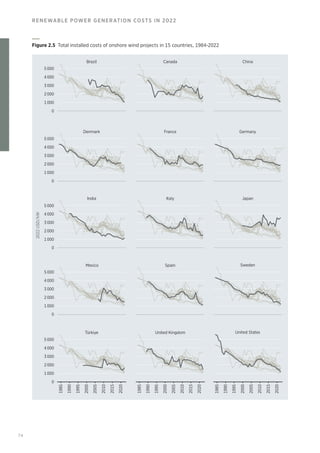
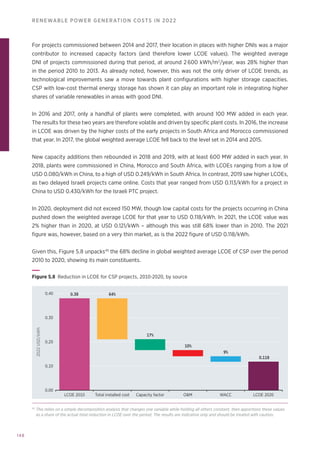
The document reports on renewable power generation costs in 2022. It finds that despite supply chain issues and rising costs, the average global cost of electricity from solar PV fell by 2% and wind by 5% in 2022. At least 86% of new utility-scale solar and 87% of onshore wind projects had lower costs than fossil fuel options. However, fossil fuel price rises improved the competitiveness of renewables even more in some countries. The document provides details on latest cost trends for solar PV and onshore wind technologies.

![[PME] Power Monitoring Expert & AHF.pdf](https://cdn.slidesharecdn.com/ss_thumbnails/pmepowermonitoringexpertahf-220802150322-9ed2996b-thumbnail.jpg?width=640&height=640&fit=bounds)


