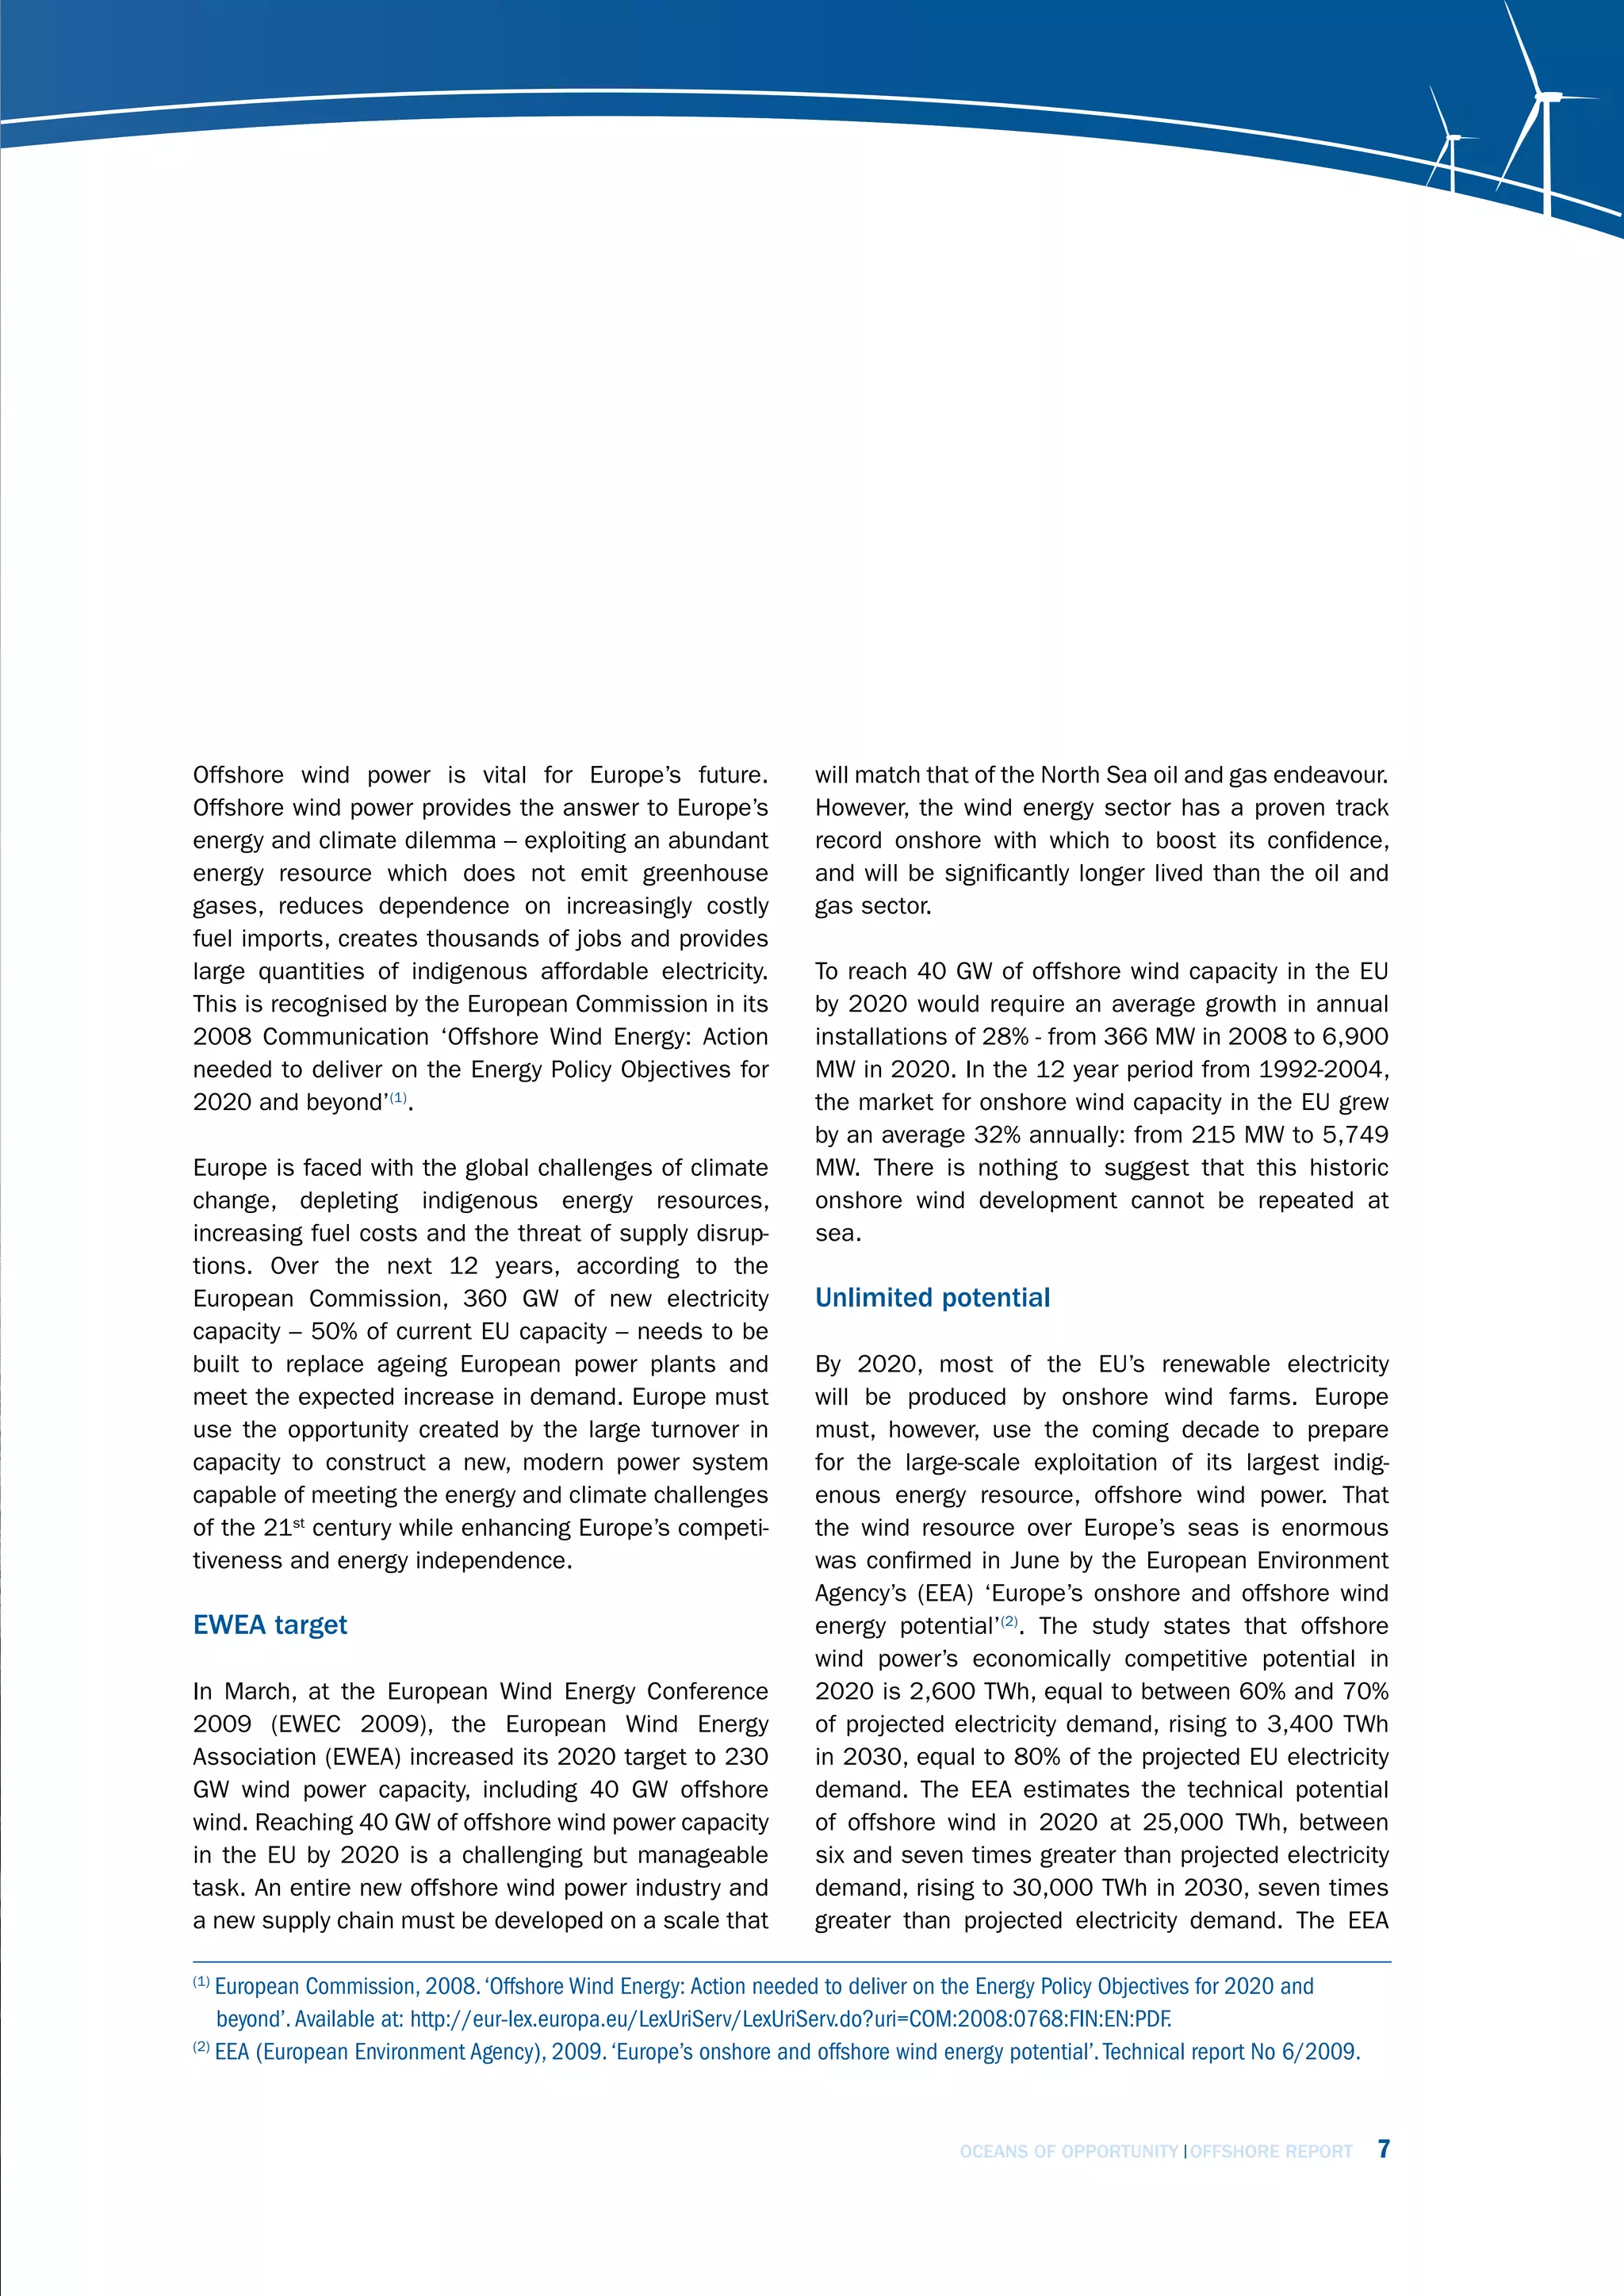


![Investments and financing
invEstmEnt cost EstimAtEs
Until now, few studies have published estimates on
investment costs for a Europe-wide offshore grid. Two
recent reports made some preliminary calculations
which allow ballpark figures to be estimated for the
total investment cost of a transnational offshore grid.
• Greenpeace(27): this study proposed a grid in the
North Sea for 68 GW of offshore wind power, to
be in place by around 2025. The topology consid-
ered for the study has a total single line length of
6,200 km. Assuming 1 GW capacity per line, the
proposed grid would cost €15-20 billion;
• TradeWind(28): the additional investment costs were
estimated for a meshed offshore grid connecting
the “far” offshore wind farm clusters with a total
installed capacity of 80 GW in the North Sea to
those in the Baltic Sea, according to the 2030 high
scenario. The additional investment costs for the
topology were estimated to be around €9 billion,
taking into account specific cable lengths and
transmission capacities (not including the costs
of the interconnectors envisaged already now for
trading purposes);
• for comparison purposes: the UK’s East Coast
Transmission study(29) looked at an offshore
network along the east coast of GB linking in the
Shetland and Orkney Islands in 2020. It estimated
a total investment cost of €5.5 billion.
Taking into account the fact that the offshore network
discussed in this chapter is more extensive than the
topologies used in the studies mentioned above, a safe
reduction in the operational costs of power generation bottom line assumption for investments in offshore
caused by dedicated grid upgrades. transmission up to 2030 is in the range of €20-30
billion. This number would include both the ‘trade’
For TradeWind’s 2020 grid and wind power scenario, interconnectors and the dedicated lines for wind power
the savings in operational costs amount to €1.5 connection. For comparison, the International Energy
billion per year, allowing for an average investment Agency (IEA) estimates total investments in European
cost of €490 million for each of the 42 transmis- electricity transmission grids of €187 billion in the
sion upgrade projects that were proposed, including period 2007-2030(30). The economic projections and
several offshore HVDC lines. Because this estimate budgeting should be made within the framework of a
assumed a less strong interconnection between total upgrade of the European transmission network,
the countries around the North Sea than the one which also comprises the required onshore upgrades.
proposed in this report, it should be considered as It is evident that a detailed assessment has to be
conservative. based on detailed network designs. Furthermore in
(27)
Greenpeace, 2008. ‘A North Sea Electricity Grid [R]evolution’. Available at: http://www.greenpeace.org/belgium.
(28)
TradeWind, 2009. ‘Integrating Wind - Developing Europe’s power market for the large-scale integration of wind power.’
Available at: http://www.trade-wind.eu.
(29)
Seanergy: East Coast Transmission (January 2008).
(30)
International Energy Agency, 2008. ‘World Energy Outlook’.
OCEANS OF OPPORTUNITY OFFSHORE REPORT 39](https://image.slidesharecdn.com/offshorereport2009-091021100454-phpapp02/75/Offshore-Report-2009-EWEA-41-2048.jpg)


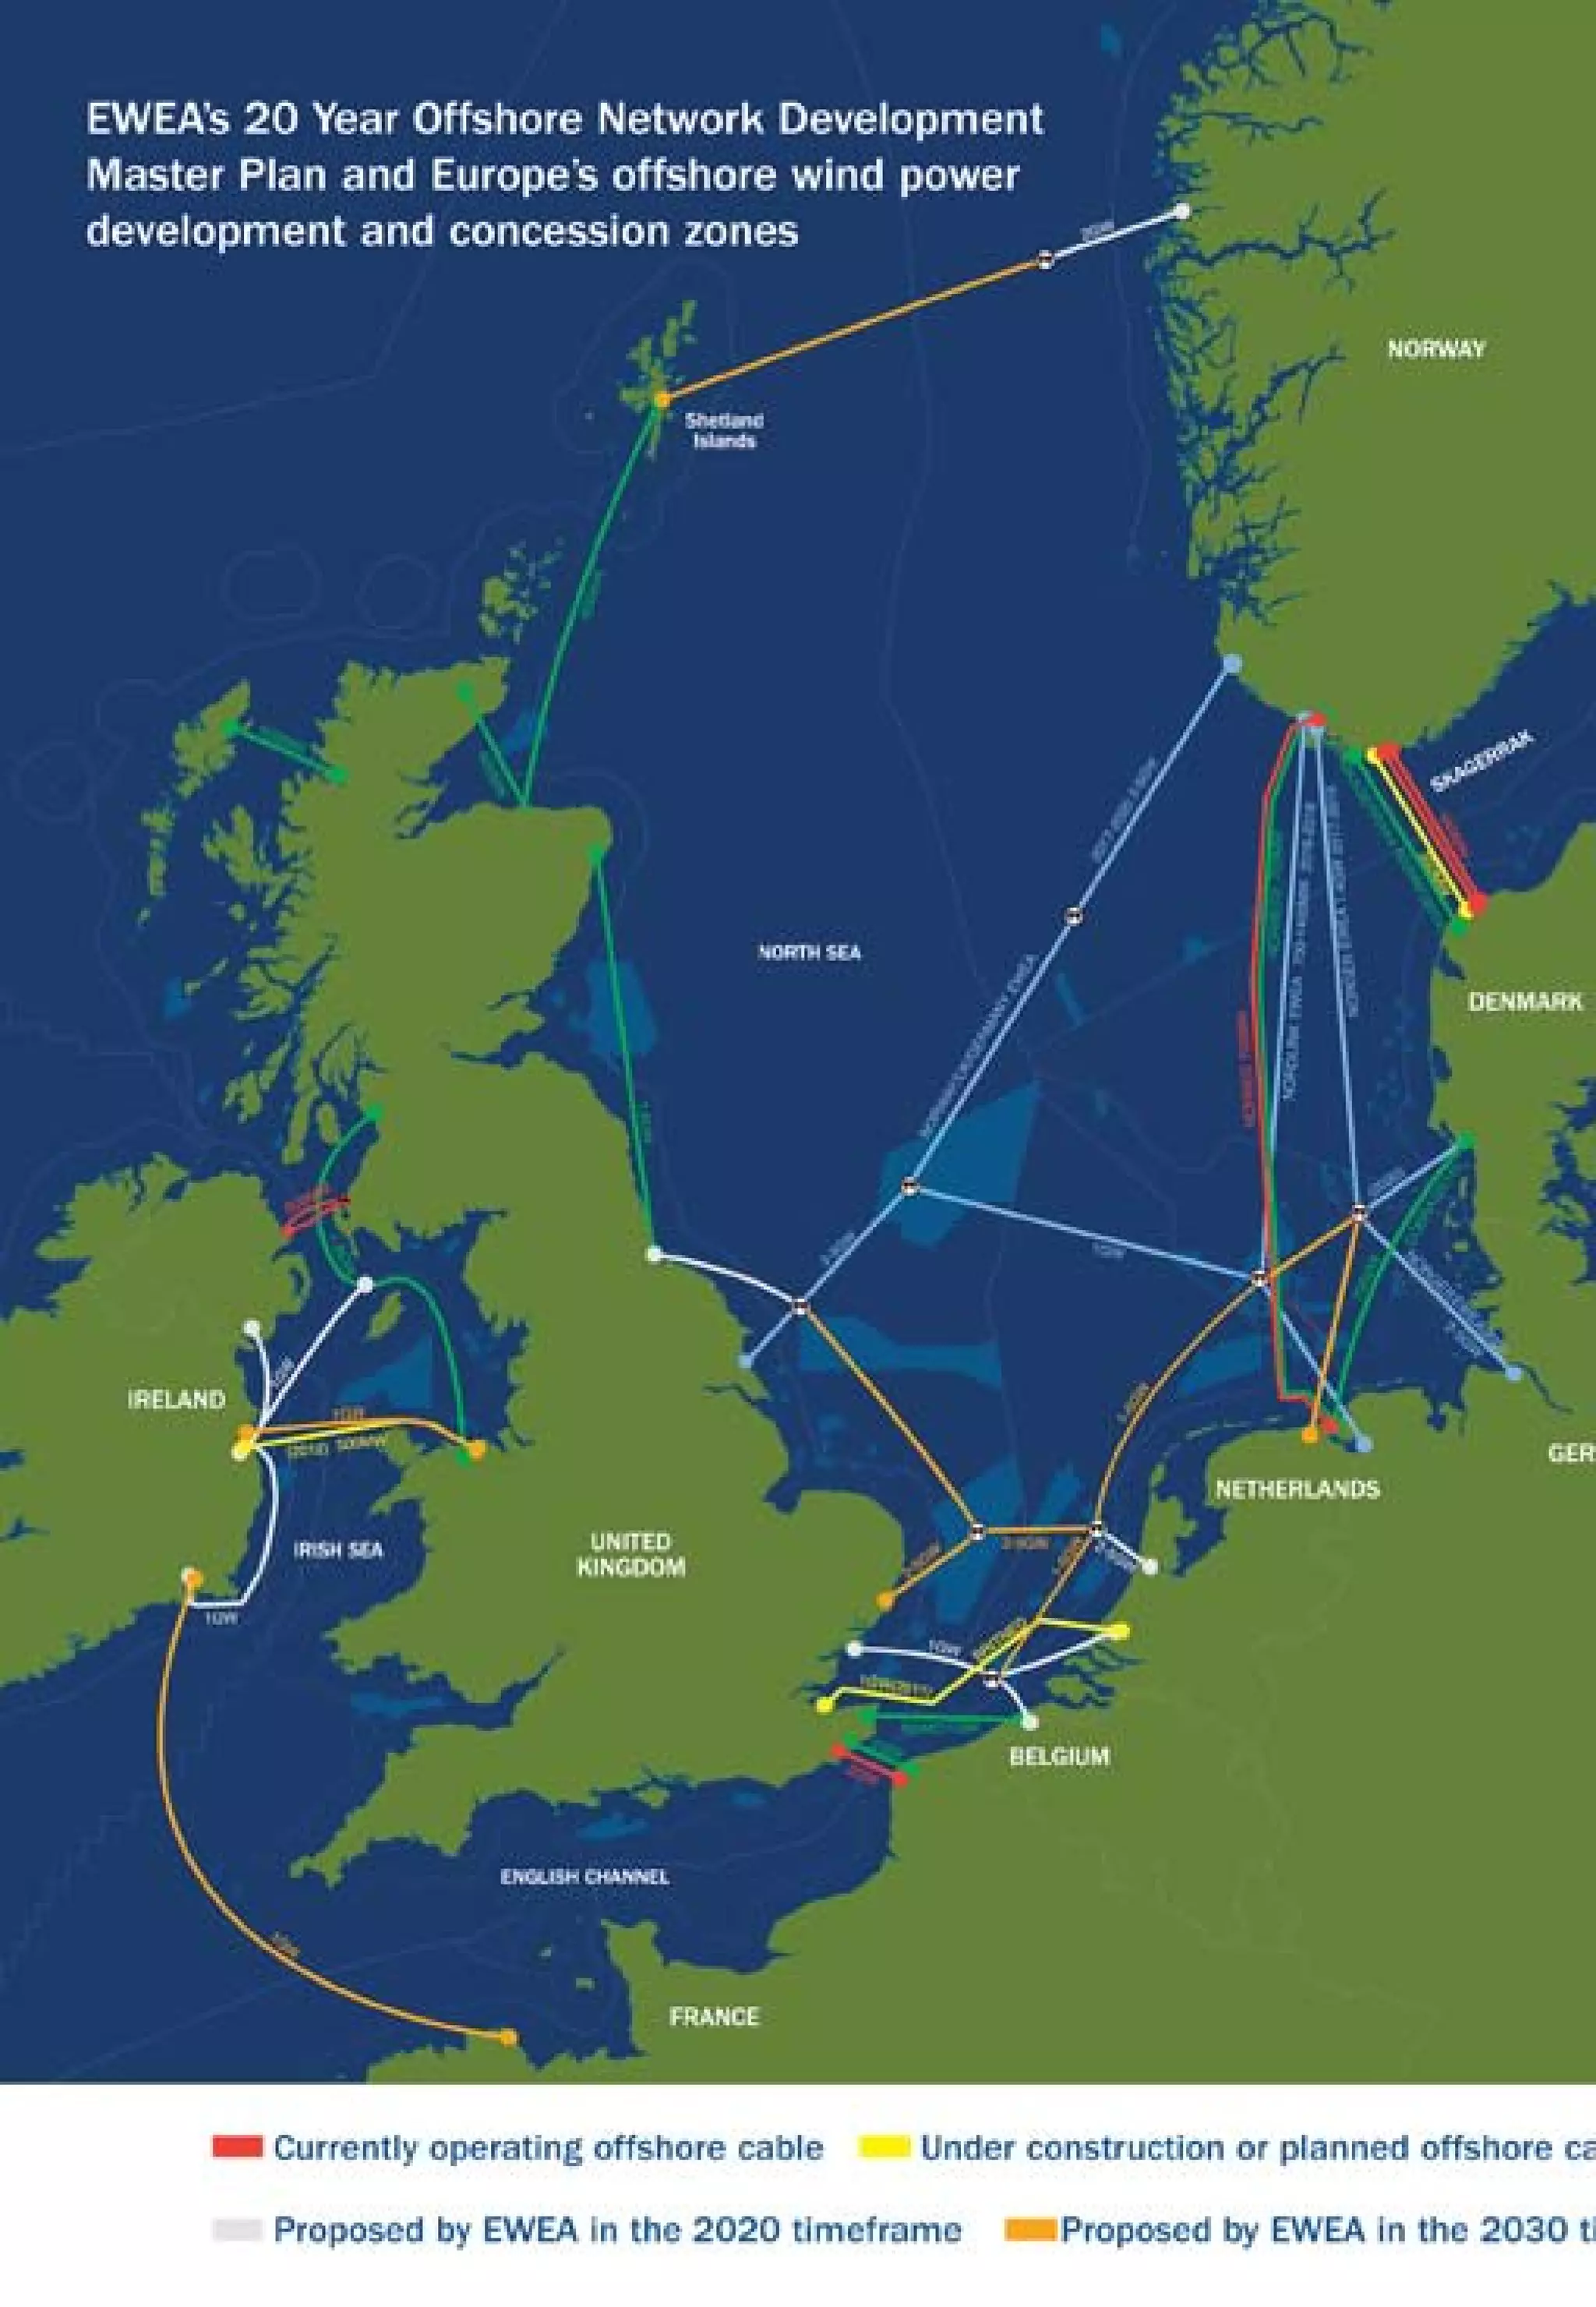
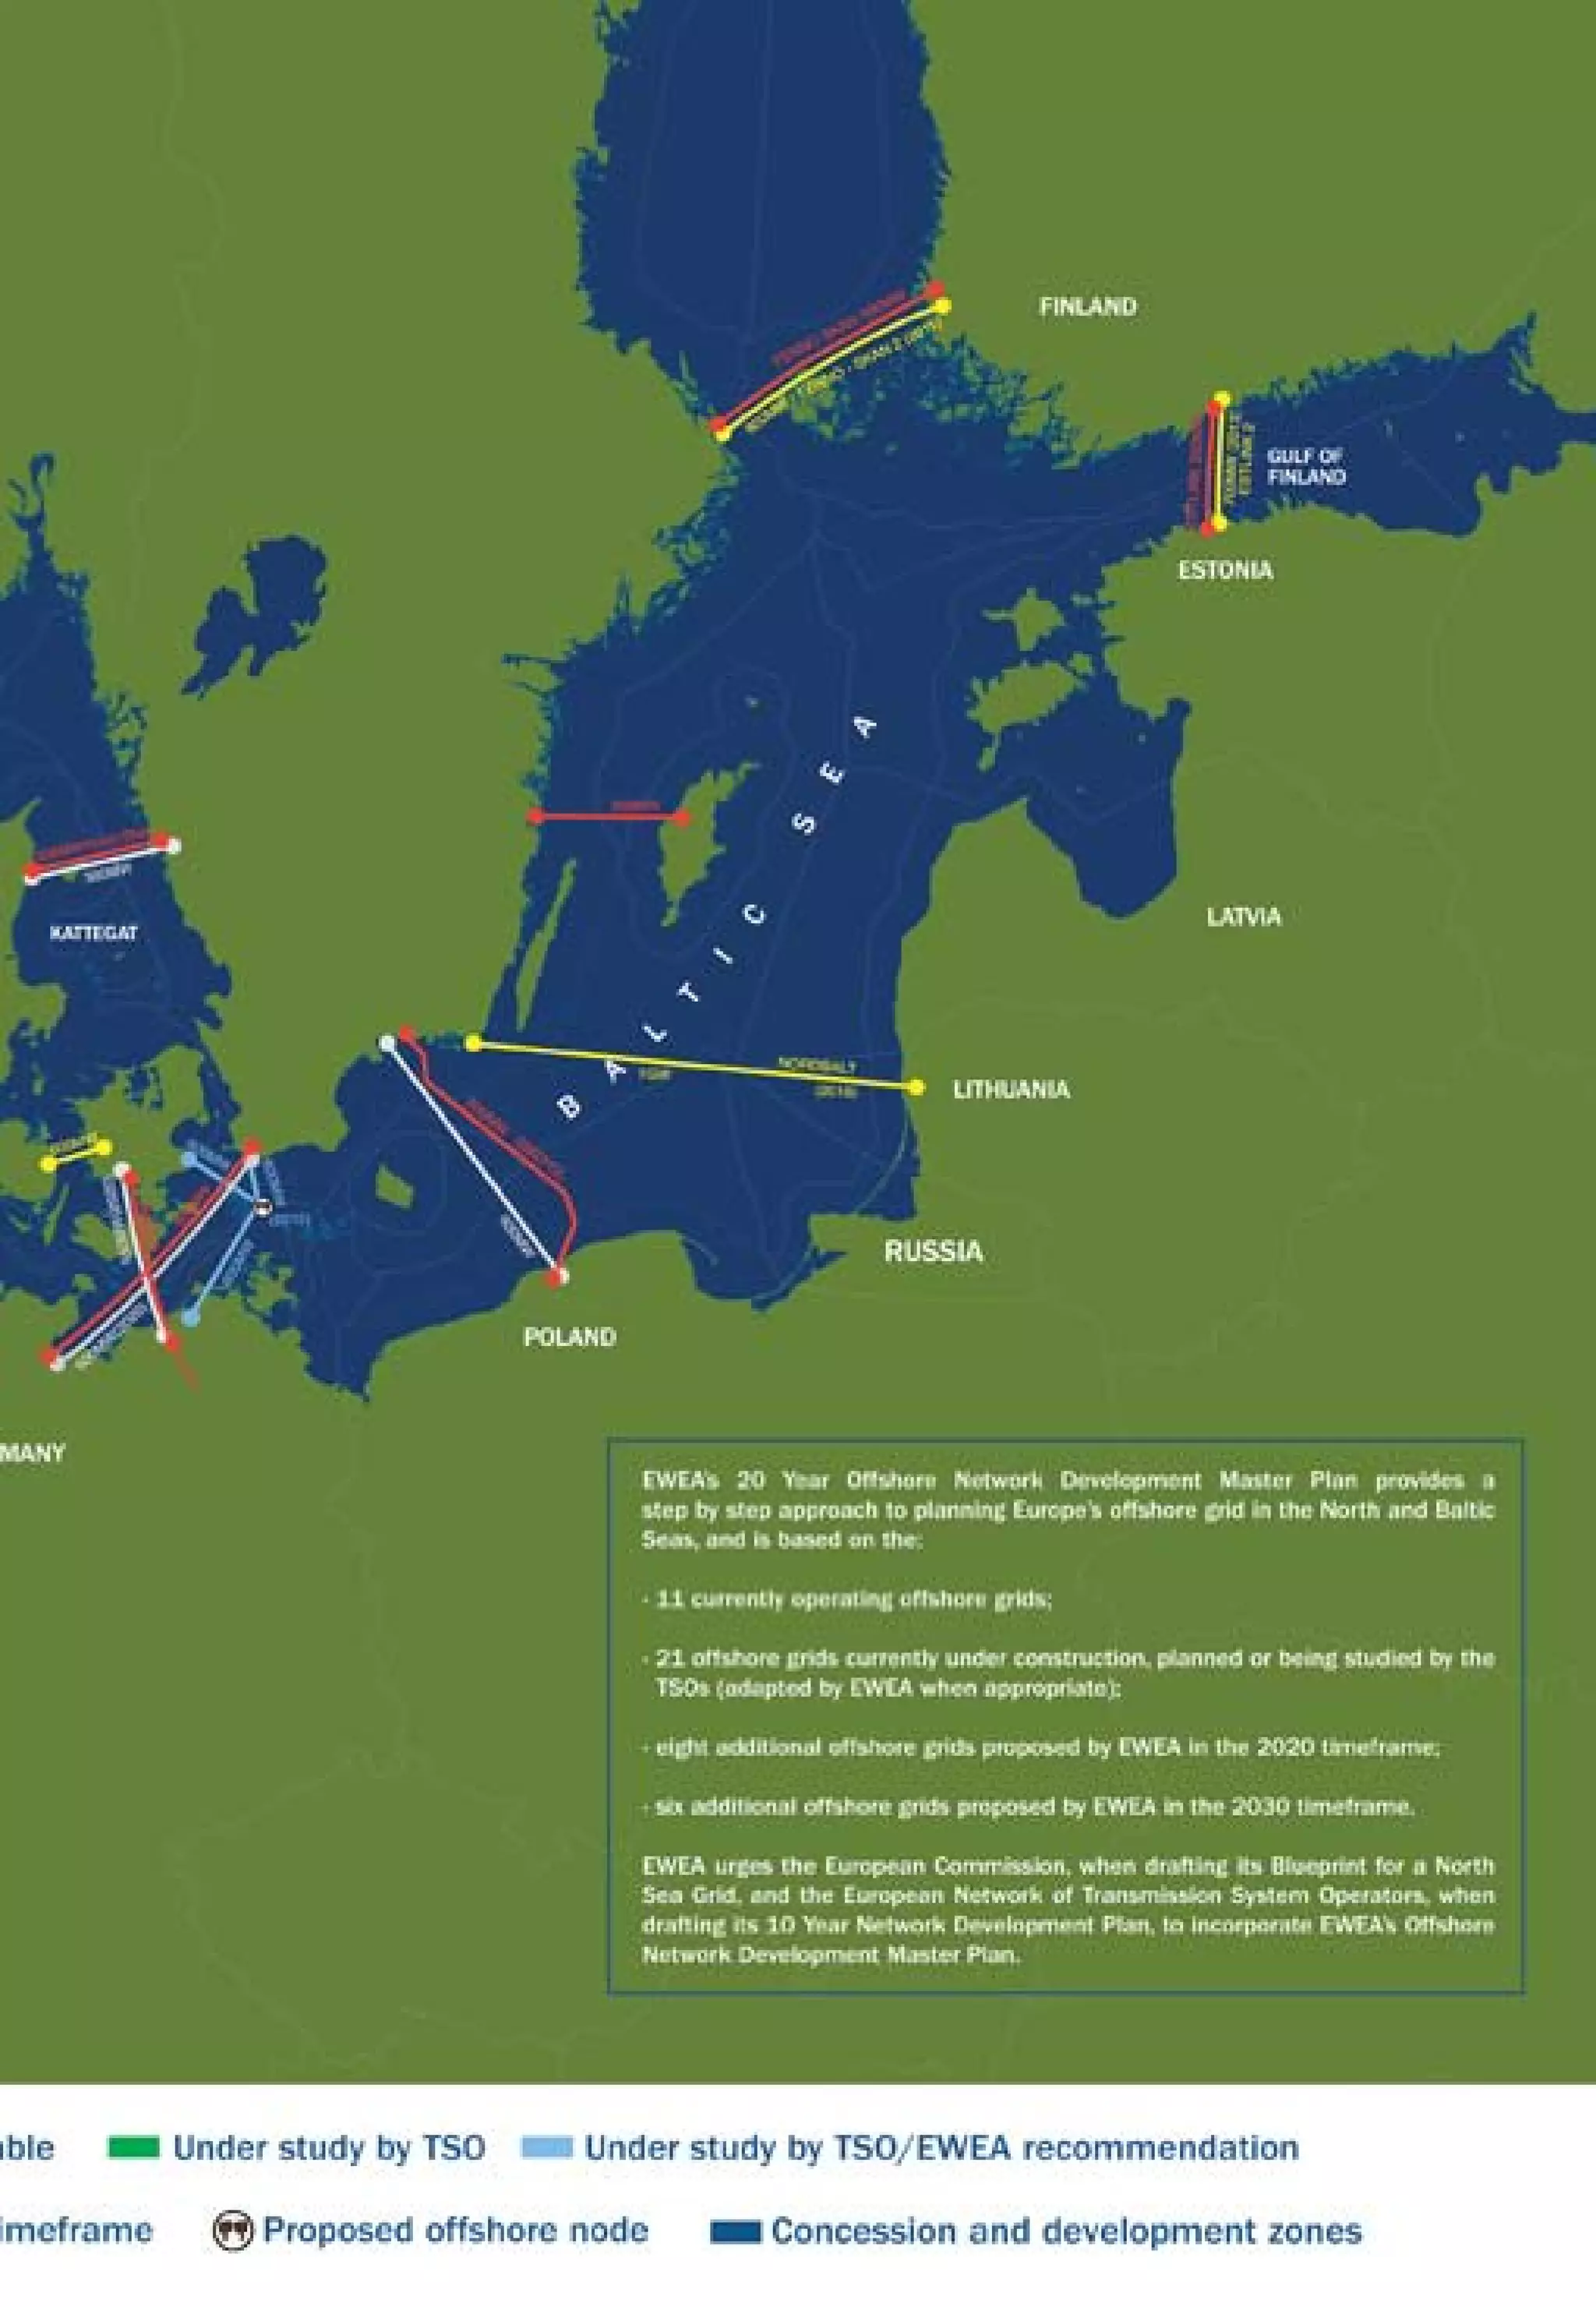
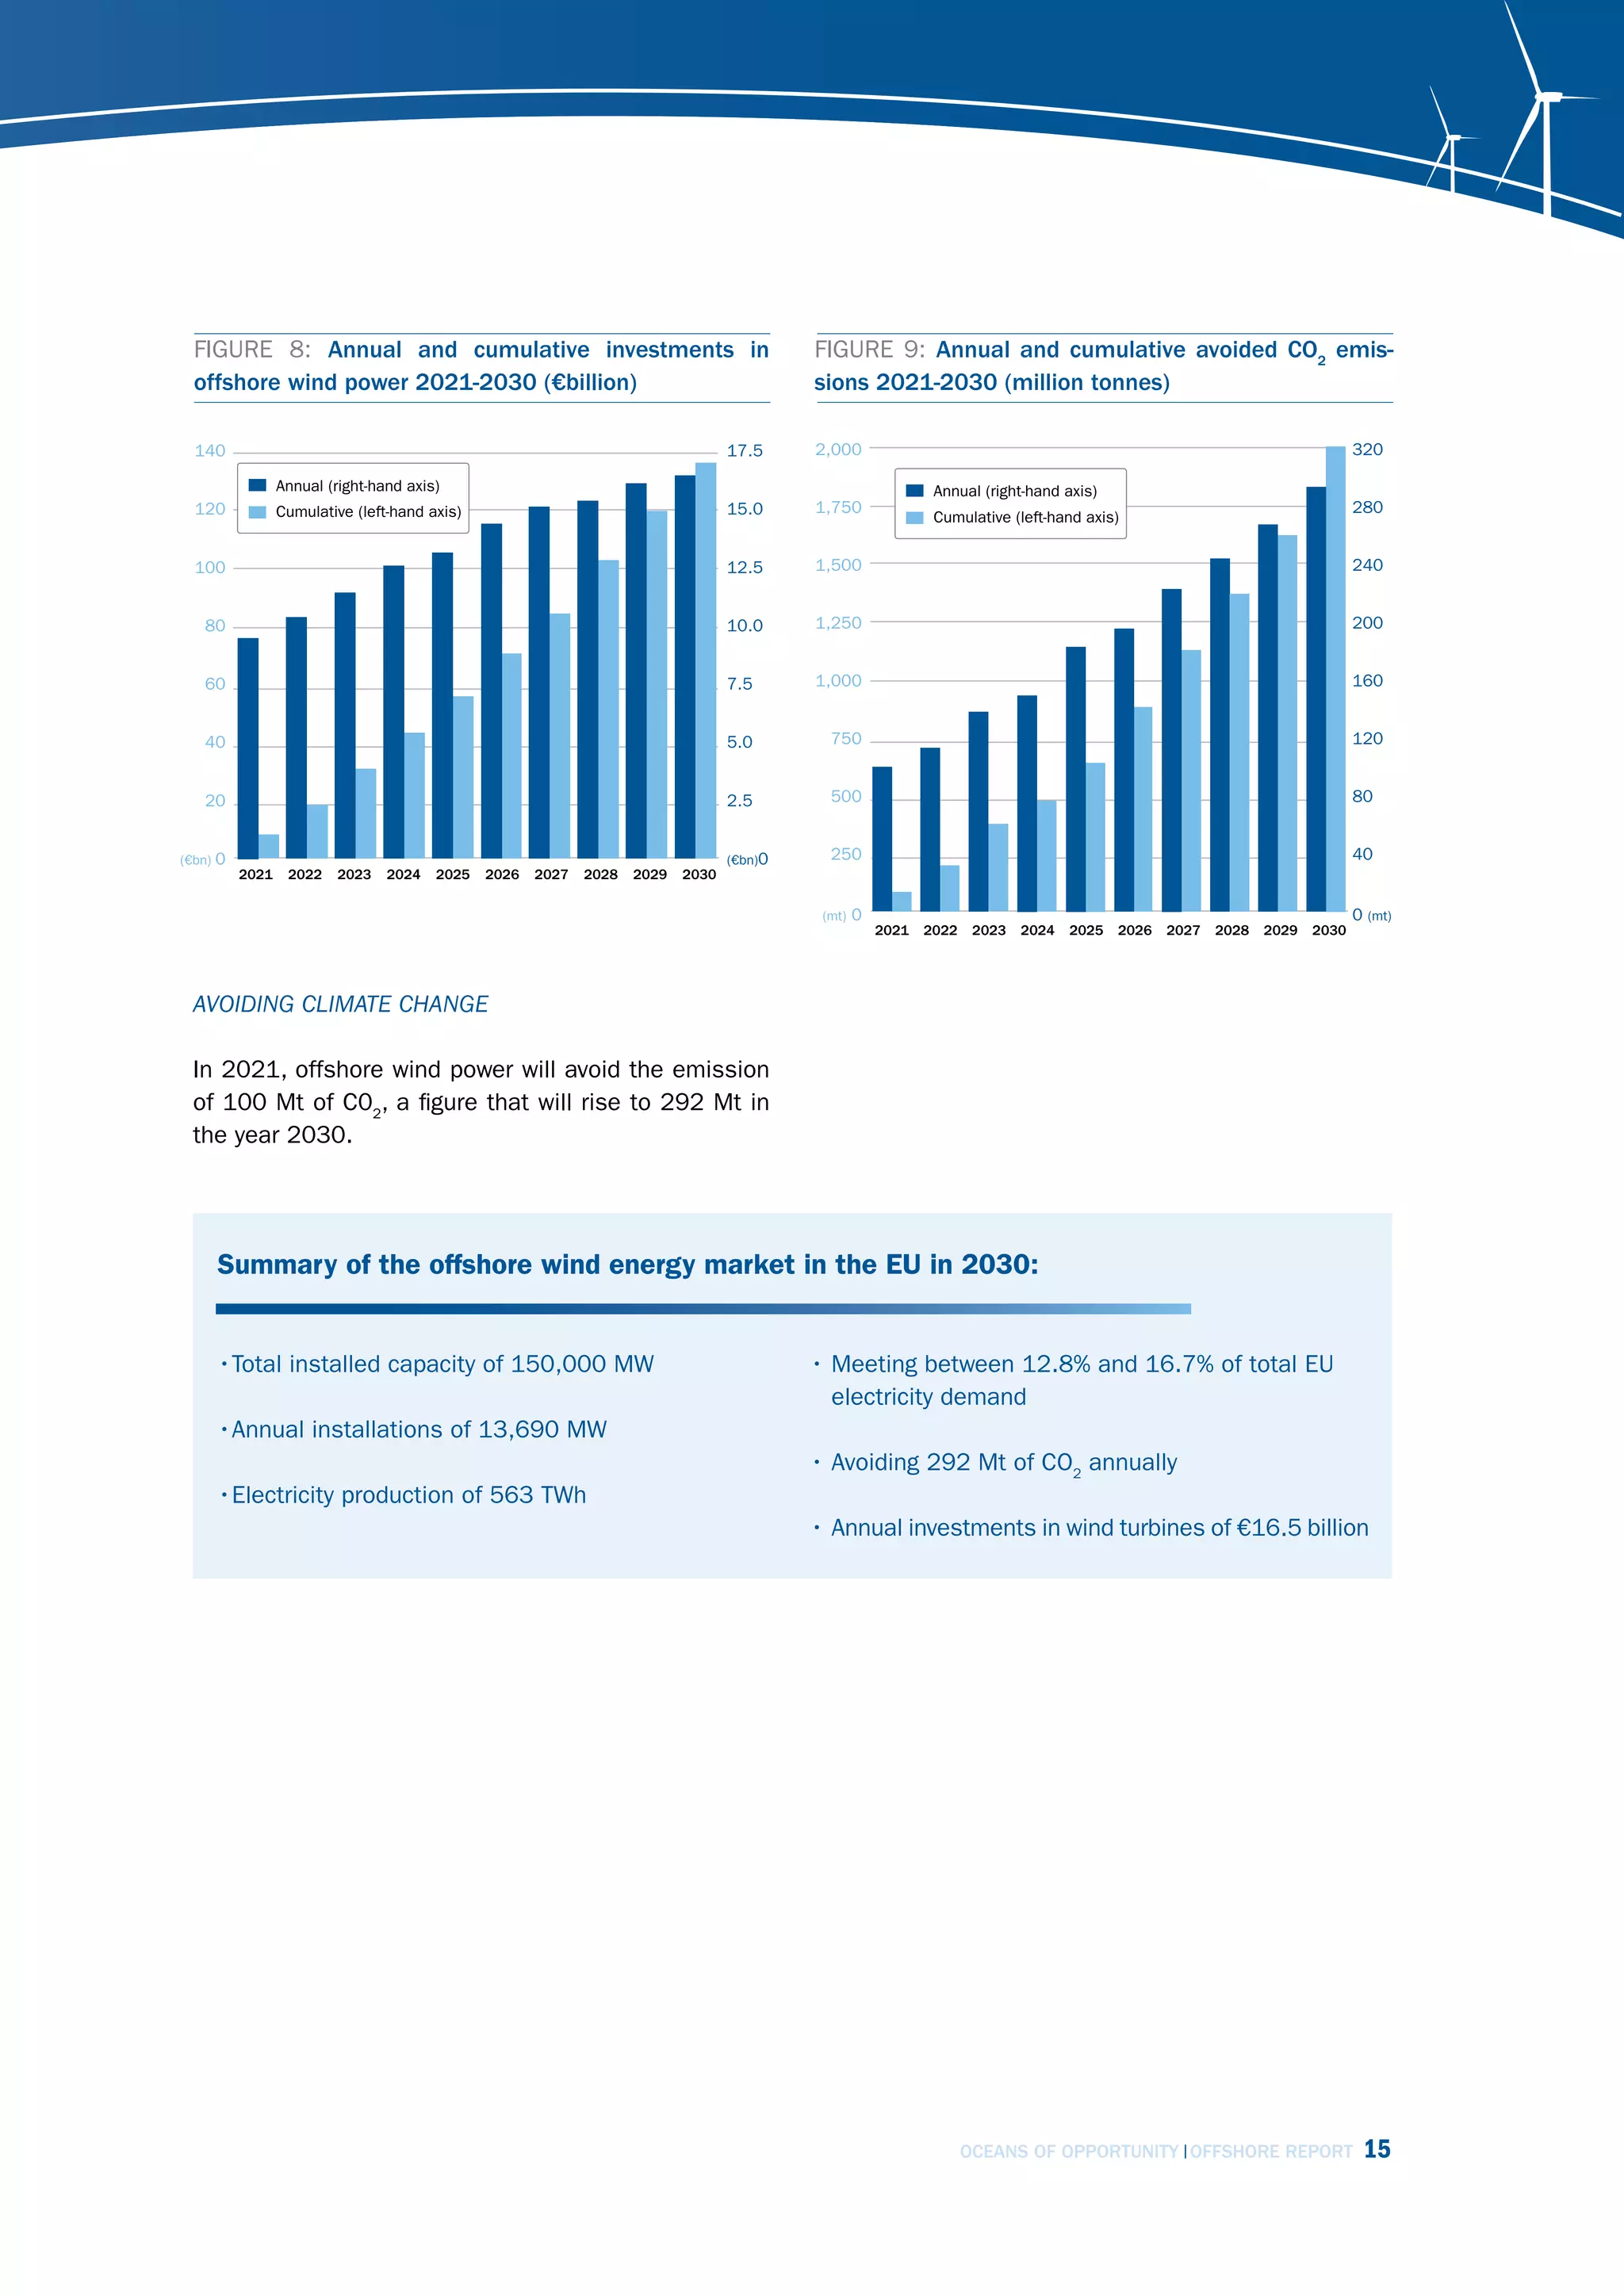
The document discusses the potential for offshore wind power in Europe. It notes that Europe's offshore wind potential could power the continent seven times over. Currently over 100 GW of offshore wind projects are planned, which could produce 10% of the EU's electricity while avoiding 200 million tons of CO2 emissions per year. The document advocates for building an offshore grid to connect offshore wind farms and transmit wind power across borders, noting that the EU's offshore grid plans could give Europe a pan-European electricity superhighway. It argues that strong policy support is needed to realize offshore wind power's potential and build a new multi-billion euro industry that delivers green jobs and establishes Europe as a leader in offshore wind technology.


![Coded Agents – with UiPath SDK + LangGraph [Virtual Hands-on Workshop]](https://cdn.slidesharecdn.com/ss_thumbnails/codedagentsdeck-251215155422-5497c599-thumbnail.jpg?width=640&height=640&fit=bounds)


