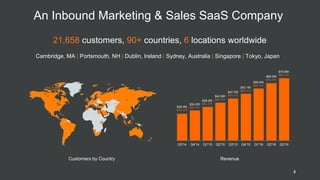
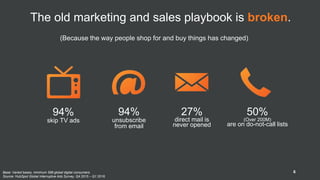
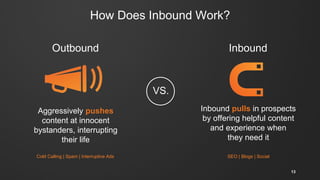
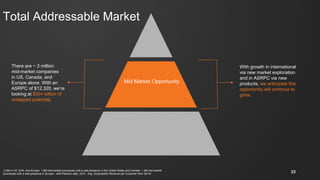
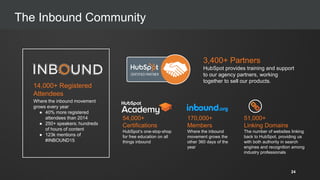
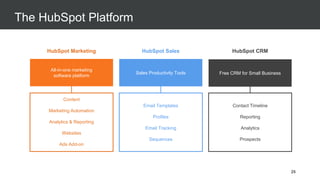
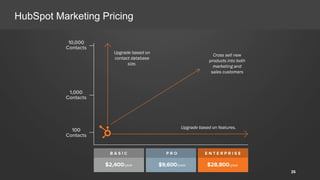
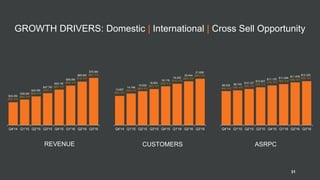
SlideShare a Scribd company logo
1 of 35
1
2
Safe Harbor
This presentation includes certain “forward-looking statements" within the meaning of the Private Securities Litigation Reform Act
of 1995, including statements concerning our cash flow and margin improvement expectations, our position to execute on our
growth strategy in the mid-market, and our ability to expand our leadership position and market opportunity for our inbound
platform. These forward-looking statements include, but are not limited to, plans, objectives, expectations and intentions and other
statements contained in this press release that are not historical facts and statements identified by words such as "expects,"
"anticipates," "intends," "plans," "believes," "seeks," "estimates" or words of similar meaning. These forward-looking statements
reflect our current views about our plans, intentions, expectations, strategies and prospects, which are based on the information
currently available to us and on assumptions we have made. Although we believe that our plans, intentions, expectations,
strategies and prospects as reflected in or suggested by those forward-looking statements are reasonable, we can give no
assurance that the plans, intentions, expectations or strategies will be attained or achieved. Furthermore, actual results may differ
materially from those described in the forward-looking statements and will be affected by a variety of risks and factors that are
beyond our control including, without limitation, our history of losses, our ability to retain existing customers and add new
customers, the continued growth of the market for an inbound platform; our ability to differentiate our platform from competing
products and technologies; our ability to manage our growth effectively to maintain our high level of service; our ability to maintain
and expand relationships with our marketing agency partners; our ability to successfully recruit and retain highly-qualified
personnel; the price volatility of our common stock, and other risks set forth under the caption "Risk Factors" in our Quarterly
Report on Form 10-Q filed on November 2, 2016 and our other SEC filings. We assume no obligation to update any forward-
looking statements contained in this document as a result of new information, future events or otherwise.
Q3'14 Q4'14 Q1'15 Q2'15 Q3'15 Q4'15 Q1'16 Q2'16 Q3'16
RevenueCustomers by Country
An Inbound Marketing & Sales SaaS Company
21,658 customers, 90+ countries, 6 locations worldwide
Cambridge, MA | Portsmouth, NH | Dublin, Ireland | Sydney, Australia | Singapore | Tokyo, Japan
$30.4M
51% Y/Y
$34.2M
53% Y/Y
$38.2M
58% Y/Y
$42.9M
58% Y/Y
$47.7M
57% Y/Y
$53.1M
56% Y/Y
$59.0M
54% Y/Y
3
$65.0M
51% Y/Y
$70.6M
48% Y/Y
Why does exist?
4
Marketing has become an arms race for attention.
5
94%
skip TV ads
94%
unsubscribe
from email
27%
direct mail is
never opened
50%
(Over 200M)
are on do-not-call lists
Base: Varied bases, minimum 598 global digital consumers
Source: HubSpot Global Interruptive Ads Survey, Q4 2015 – Q1 2016.
The old marketing and sales playbook is broken.
(Because the way people shop for and buy things has changed)
6
But today’s consumers have
the tools to fight back.
7
Skip
commercials
Screen calls Delete spam
Ignore print
Straight in
the bin
Pop-up
blockers
Blocking Out the Noise
It’s easier than ever
for customers to
block out the noise
8
So how do you reach a consumer
who doesn’t want to be bothered?
Be helpful.
9
Inbound Marketing & Sales
10
“Wait. What is inbound?”
11
Inbound is about the size of your brain,
not the width of your wallet
Helpful | Human | Personal | Transformational | Empowering | Educational
12
How Does Inbound Work?
Aggressively pushes
content at innocent
bystanders, interrupting
their life
Inbound pulls in prospects
by offering helpful content
and experience when
they need it
VS.
Outbound Inbound
SEO | Blogs | SocialCold Calling | Spam | Interruptive Ads
13
How does HubSpot do inbound?
14
Inbound Methodology
15
The Inbound Value Proposition:
Simply put, it’s about growing an asset vs. renting one.
1 2 3
Predictable Measurable Proven ROI
Icon Source: http://thenounproject.com via Gregor Cresnar 16
Did you know: More than 90% of
HubSpot’s new leads each month
come from “Old Content”?
92% Leads
from Old Posts
8% Leads from
New Posts
In other words, if HubSpot’s blogging team took
next month off,
we’d still generate 92% of leads
as if we’d continued to publish new content.
Source: Historical Blog Post Optimization Project (learn more here: http://blog.hubspot.com/marketing/historical-blog-seo-conversion-optimization)
Predictable
17
This post was written by HubSpot CEO
Brian Halligan in July 2010. In 2015, it:
● Still ranks #1 in Google searches
● Received 17,854 views
● Generated 117 leads
5 Years later, still moving the needle.
What Does an Inbound Asset Look Like?
Article ranks #1 for “inbound marketing vs outbound marketing”
18
In a digital world,
track everything
from clicks to
conversions to
revenue
Measurable
19
No matter the size of your
marketing budget, inbound
can bring you ROI.
This is the real deal.
From big marketing budget to small, a
significant number of businesses saw
higher returns from inbound marketing
than from outbound.
0%
10%
20%
30%
40%
50%
60%
$25K or less $25,001 to
$100K
$100,001 to
$500K
$500,001 to
$1M
$1M to $5M More than
$5M
We see higher ROI using inbound
marketing
We see higher ROI using outbound
marketing
42%
Inbound vs. Outbound ROI by Marketing Spend
Big budget or small – everyone gets big returns from inbound
8%
47%
52%
44%
48%
52%
14%
11%
18%
14%
18%
Proven ROI
Source: HubSpot’s 2015 State of Inbound Report; survey of approximately 4,000 respondents; majority of respondents are marketers at B2Bs; approx one-third of respondents have
an affiliation with HubSpot; approx ½ of respondents generate revenue under $1M
20
0% 10% 20% 30% 40% 50% 60% 70% 80%
0 to 25 employees
26 to 200 employees
201 or more employees
As it turns out,
ROI matters.
A lot.
Proving the ROI of
our marketing activities
Securing
enough budget
Managing
our website
Identifying the right
technologies for my needs
Training our team
Targeting content for
an international audience
Hiring top talent
Finding an
executive sponsor
42%
57%
71%
32%
32%
51%
32%
31%
31%
31%
22%
29%
23%
24%
26%
23%
23%
24%
19%
25%
22%
9%
5%
8%
Top Challenges by Company Size
Proving ROI and subsequently securing more budget are marketers’ biggest roadblocks
Source: HubSpot’s 2015 State of Inbound Report; survey of approximately 4,000 respondents; majority of respondents are marketers at B2Bs; approx one-third of respondents have an affiliation with HubSpot; approx ½ of respondents generate revenue under $1M
21
We are an inbound marketing & sales SaaS company.
Our mission is to transform how companies market and sell.
Our vision is a world where business is inbound.
22
Total Addressable Market
With growth in international
via new market exploration
and in ASRPC via new
products, we anticipate this
opportunity will continue to
grow.
Mid Market Opportunity
-3.0M is US, CAN, and Europe. 1.6M mid-market businesses with a web presence in the United States and Canada. 1.4M mid-market
businesses with a web presence in Europe. -AMI Partners data, 2014. Avg. Subscription Revenue per Customer from Q3’16
There are ~ 3 million
mid-market companies
in US, Canada, and
Europe alone. With an
ASRPC of $12,320, we’re
looking at $30+ billion of
untapped potential.
23
170,000+
Members
Where the inbound
movement grows the
other 360 days of the
year
14,000+ Registered
Attendees
Where the inbound movement
grows every year
● 40% more registered
attendees than 2014
● 250+ speakers; hundreds
of hours of content
● 123k mentions of
#INBOUND15
3,400+ Partners
HubSpot provides training and support
to our agency partners, working
together to sell our products.
54,000+
Certifications
HubSpot’s one-stop-shop
for free education on all
things inbound
51,000+
Linking Domains
The number of websites linking
back to HubSpot, providing us
with both authority in search
engines and recognition among
industry professionals
The Inbound Community
24
HubSpot Marketing
All-in-one marketing
software platform
Sales Productivity Tools Free CRM for Small Business
HubSpot CRM
Content
Marketing Automation
Analytics & Reporting
Websites
Ads Add-on
Email Templates
Profiles
Email Tracking
Sequences
Contact Timeline
Reporting
Analytics
Prospects
HubSpot Sales
The HubSpot Platform
25
HubSpot Marketing Pricing
Upgrade based on
contact database
size.
Upgrade based on features.
Cross sell new
products into both
marketing and
sales customers
26
Company Awards
● Glassdoor: #4 Workplace
● Fortune & Great Place to Work: Top Workplace for Camaraderie, Best Small &
Medium Workplace, Top Workplace for Women
● Entrepreneur: Top Company Culture
● The Boston Globe: Top Place to Work
● Boston Business Journal: Best Place to Work
Product and Service Awards
● Named a “Visionary” in Gartner’s 2015 Magic Quadrant for CRM Lead Management
● Frost & Sullivan 2015 Global Marketing Automation Software Customer Value
Leadership Award
● G2 Crowd: Best Marketing Automation Software, Best Web Content Management
Software, Named a “Leader” in the Summer 2015 Marketing Automation Grid
● GetApp’s 2016 Q3 report: Named #1 Marketing Automation Software, Content
Marketing App
What do these accolades mean? In combination with HubSpot’s close
proximity to Boston’s top-tier schools, we attract top talent.
HubSpot, in the words of others.
27
Customer Case Study: VeriFirst Background Screening
• Low organic traffic
• Poor web presence
• Multiple point solutions
• Inefficient sales funnel
• Poor lead nurturing
• Poor S&M alignment
• Slow sales onboarding
Problem Solution Tools
• Blog
• Sites
• SEO
• Email templates
• Email tracking
• Sequences
• Contact timeline
• Prospects
• Tasks
6X
increase in
monthly customers
12X
increase in
monthly traffic
11X
increase in monthly
contacts generated
Three Year
Results:
Source: Customer data; Note: “Three Year Results” compare the 6-month trailing averages of visits, contacts, and customers in August 2012 to the same values in May 2016.
28
HubSpot, in short…
Growth opportunity with multiple drivers
- Large, diversified and expanding global addressable market
- Drive new customer growth, cross sell existing products and grow internationally
Efficient and scalable customer acquisition model
- We expect margin improvement will drive sustained positive operating cash flow throughout
‘16 and break-even free cash flow in 1H17
29
Financial Review
30
GROWTH DRIVERS: Domestic | International | Cross Sell Opportunity
REVENUE CUSTOMERS ASRPC
31
Q4'14 Q1'15 Q2'15 Q3'15 Q4'15 Q1'16 Q2'16 Q3'16
$34.2M
53% Y/Y
$38.2M
58% Y/Y
$42.9M
58% Y/Y
$47.7M
57% Y
$53.1M
56% Y/Y
$59.0M
54% Y/Y
$65.0M
51% Y/Y
$70.6M
48% Y/Y
Q4'14 Q1'15 Q2'15 Q3'15 Q4'15 Q1'16 Q2'16 Q3'16
13,607
35% Y/Y
14,746
35% Y/Y
15,839
36% Y/Y
16,854
35% Y/Y
18,116
33% Y/Y
19,322
31% Y/Y
20,444
29% Y/Y
21,658
29% Y/Y
Q4'14 Q1'15 Q2'15 Q3'15 Q4'15 Q1'16 Q2'16 Q3'16
$9,530
14% Y/Y
$9,740
15% Y/Y
$10,127
15% Y/Y
$10,607
16% Y/Y
$11,135
17% Y/Y
$11,494
18% Y/Y
$11,978
18% Y/Y
$12,320
16% Y/Y
Steady Progress in Gross and Operating Margin Trajectory
32All percentages for historical period are non-GAAP and exclude expenses associated with stock based compensation and amortization of acquired intangibles. Please refer to the end of this presentation for a reconciliation of GAAP to non-GAAP figures.
*This removes the impact of Inbound in 2015.
Q1'14 Q2'14 Q3'14 Q4'14 Q1'15 Q2'15 Q3'15 Q4'15 Q1'16 Q2'16 Q3'16
Operating Margin (Non-GAAP) Gross Margin (Non-GAAP)
~9 point
operating margin
improvement*
-34.3% -26.0% -31.8% -20.7% -16.4% -13.2% -18.3% -8.3% -6.1% -3.9% -1.8%
68.9% 70.0% 70.1% 71.9% 73.5% 74.8% 74.7% 75.1% 77.0% 77.6% 78.4%
Key Financial Metrics
Key Financial
Metrics
(% of Revenue)
2011 2012 2013 2014 2015 Q1’16 Q2’16 Q3’16
Gross Margin 61% 70% 65% 70% 75% 77% 78% 78%
R&D 27% 19% 18% 17% 14% 14% 14% 14%
S&M 82% 66% 67% 63% 58% 56% 55% 53%
G&A 21% 16% 19% 18% 16% 14% 13% 13%
Operating (Loss)
/ Income %
(69%) (31%) (39%) (28%) (14%) (6%) (4%) (2%)
*CFFO (44%) (11%) (26%) (11%) (0%) 5% 13% 7%
All percentages for historical period are non-GAAP (other than CFFO) and exclude expenses associated with stock based compensation
and amortization of acquired intangibles. Please refer to the end of this presentation for a reconciliation of GAAP to non-GAAP figures.
33
Thank you from HubSpot!
34
GAAP to Non-GAAP Reconciliation
35
HubSpot, Inc.
GAAP to Non-GAAP Reconciliation
$ '000s
% of
Revenues $ '000s
% of
Revenues $ '000s
% of
Revenues $ '000s
% of
Revenues $ '000s
% of
Revenues $ '000s
% of
Revenues $ '000s
% of
Revenues $ '000s
% of
Revenues
Cost of Revenue
Subscription 4,964 17% 9,689 19% 18,745 24% 23,655 20% 32,271 18% 8,910 15% 9,985 15% 10,655 15%
Stock-based compensation (16) 0% (27) 0% (50) 0% (128) 0% (341) 0% (94) 0% (131) 0% (139) 0%
Amortization of acquired intangibles (130) 0% (224) 0% (359) 0% (118) 0% (70) 0% (18) 0% (13) 0% (13) 0%
Non-GAAP subscription 4,818 17% 9,438 18% 18,336 24% 23,409 20% 31,860 18% 8,798 15% 9,841 15% 10,503 15%
Professional services and other 6,368 22% 6,004 12% 8,759 11% 11,425 10% 15,652 9% 5,061 9% 5,210 8% 5,157 7%
Stock-based compensation (131) 0% (100) 0% (211) 0% (498) 0% (1,216) -1% (324) -1% (477) -1% (438) -1%
Amortization of acquired intangibles - 0% - 0% - 0% - 0% - 0% - 0% - 0% - 0%
Non-GAAP professional services and other 6,237 22% 5,904 11% 8,548 11% 10,927 9% 14,436 8% 4,737 8% 4,733 7% 4,719 7%
Gross Profit
Gross Profit 17,221 60% 35,911 70% 50,130 65% 80,796 70% 134,020 74% 44,989 76% 49,779 77% 54,777 78%
Stock-based compensation 147 1% 127 0% 261 0% 626 1% 1,557 1% 418 1% 608 1% 577 1%
Amortization of acquired intangibles 130 0% 224 0% 359 0% 118 0% 70 0% 18 0% 13 0% 13 0%
Non-GAAP gross profit 17,498 61% 36,262 70% 50,750 65% 81,540 70% 135,647 75% 45,425 77% 50,400 78% 55,367 78%
Operating Expenses
Research and development 10,031 35% 10,585 21% 15,018 19% 25,638 22% 32,457 18% 9,804 17% 11,278 17% 12,100 17%
Stock-based compensation (2,341) -8% (739) -1% (691) -1% (6,190) -5% (6,327) -3% (1,758) -3% (2,272) -3% (2,341) -3%
Amortization of acquired intangibles - 0% - 0% - 0% - 0% - 0% - 0% - 0% - 0%
Non-GAAP research and development 7,690 27% 9,846 19% 14,327 18% 19,448 17% 26,130 14% 8,046 14% 9,006 14% 9,759 14%
Sales and marketing 24,088 84% 34,949 68% 53,158 68% 78,809 68% 112,629 62% 35,198 60% 39,140 60% 41,193 58%
Stock-based compensation (647) -2% (691) -1% (1,194) -2% (5,596) -5% (7,658) -4% (2,427) -4% (3,469) -5% (3,473) -5%
Amortization of acquired intangibles - 0% - 0% - 0% (20) 0% (26) 0% (6) 0% (7) 0% (7) 0%
Non-GAAP sales and marketing 23,441 82% 34,258 66% 51,964 67% 73,193 63% 104,945 58% 32,765 56% 35,664 55% 37,713 53%
General and administrative 7,517 26% 9,117 18% 16,204 21% 24,958 22% 35,408 19% 9,848 17% 10,391 16% 11,435 16%
Stock-based compensation (1,484) -5% (958) -2% (1,318) -2% (3,946) -3% (5,766) -3% (1,628) -3% (2,126) -3% (2,304) -3%
Amortization of acquired intangibles - 0% - 0% - 0% - 0% - 0% - 0% - 0% - 0%
Non-GAAP general and administrative 6,033 21% 8,159 16% 14,886 19% 21,012 18% 29,642 16% 8,220 14% 8,265 13% 9,131 13%
Loss from Operations
Loss from operations (24,415) -86% (18,740) -36% (34,250) -44% (48,609) -42% (46,474) -26% (9,861) -17% (11,030) -17% (9,951) -14%
Stock-based compensation 4,619 16% 2,515 5% 3,464 4% 16,358 14% 21,308 12% 6,231 11% 8,475 13% 8,695 12%
Amortization of acquired intangibles 130 0% 224 0% 359 0% 138 0% 96 0% 24 0% 20 0% 20 0%
Non-GAAP loss from operations (19,666) -69% (16,001) -31% (30,427) -39% (32,113) -28% (25,070) -14% (3,606) -6% (2,535) -4% (1,236) -2%
2015
Three Months Ended
June 30, 2016
Three Months Ended
September 30, 20162014
Year ended December 31,
2011 2012 2013
Three Months Ended
March 31, 2016

More Related Content

What's hot

Hubs ir deck q1'18 final
Hubs ir deck q1'18 finalHubs ir deck q1'18 final
Hubs ir deck q1'18 finalIR_HubSpot
 
HubSpot Investor Marketing Deck 4q15
HubSpot Investor Marketing Deck 4q15HubSpot Investor Marketing Deck 4q15
HubSpot Investor Marketing Deck 4q15IR_HubSpot
 
Shopify investor deck 05042016
Shopify investor deck 05042016 Shopify investor deck 05042016
Shopify investor deck 05042016 shopifyInvestors
 
Marketing 2016 final
Marketing 2016 finalMarketing 2016 final
Marketing 2016 finalmastaff
 
Shopify investor deck 02172016
Shopify investor deck 02172016Shopify investor deck 02172016
Shopify investor deck 02172016shopifyInvestors
 
Shopify Investor Deck 08032016
Shopify Investor Deck 08032016 Shopify Investor Deck 08032016
Shopify Investor Deck 08032016 shopifyInvestors
 
SaaS Valuation Drivers
SaaS Valuation DriversSaaS Valuation Drivers
SaaS Valuation DriversMichael Fritz
 
Shopify q1 2017 investor deck
Shopify q1 2017 investor deckShopify q1 2017 investor deck
Shopify q1 2017 investor deckshopifyInvestors
 
Shopify Investor Deck - August 2016
Shopify Investor Deck - August 2016Shopify Investor Deck - August 2016
Shopify Investor Deck - August 2016shopifyInvestors
 
Ir featured content slides nov 2015
Ir featured content slides nov 2015Ir featured content slides nov 2015
Ir featured content slides nov 2015shopifyInvestors
 

What's hot (20)

Hubs ir deck q1'18 final
Hubs ir deck q1'18 finalHubs ir deck q1'18 final
Hubs ir deck q1'18 final
 
Q1 2017 investor deck
Q1 2017 investor deck Q1 2017 investor deck
Q1 2017 investor deck
 
HubSpot Investor Marketing Deck 4q15
HubSpot Investor Marketing Deck 4q15HubSpot Investor Marketing Deck 4q15
HubSpot Investor Marketing Deck 4q15
 
Shopify investor deck 05042016
Shopify investor deck 05042016 Shopify investor deck 05042016
Shopify investor deck 05042016
 
Marketing 2016 final
Marketing 2016 finalMarketing 2016 final
Marketing 2016 final
 
Shopify investor deck 02172016
Shopify investor deck 02172016Shopify investor deck 02172016
Shopify investor deck 02172016
 
Ir website 06152015
Ir website 06152015Ir website 06152015
Ir website 06152015
 
Investor deck q2 2017
Investor deck q2 2017Investor deck q2 2017
Investor deck q2 2017
 
Investor deck q2 2018
Investor deck q2 2018Investor deck q2 2018
Investor deck q2 2018
 
Investor deck q1 2018
Investor deck q1 2018Investor deck q1 2018
Investor deck q1 2018
 
Shopify Investor Deck 08032016
Shopify Investor Deck 08032016 Shopify Investor Deck 08032016
Shopify Investor Deck 08032016
 
SaaS Valuation Drivers
SaaS Valuation DriversSaaS Valuation Drivers
SaaS Valuation Drivers
 
Investor deck q4 2017
Investor deck q4 2017Investor deck q4 2017
Investor deck q4 2017
 
Q4 2016 investor deck pdf
Q4 2016 investor deck pdfQ4 2016 investor deck pdf
Q4 2016 investor deck pdf
 
Shopify q1 2017 investor deck
Shopify q1 2017 investor deckShopify q1 2017 investor deck
Shopify q1 2017 investor deck
 
Shopify Investor Deck - August 2016
Shopify Investor Deck - August 2016Shopify Investor Deck - August 2016
Shopify Investor Deck - August 2016
 
Ir featured content slides nov 2015
Ir featured content slides nov 2015Ir featured content slides nov 2015
Ir featured content slides nov 2015
 
Investor deck q2 2017
Investor deck q2 2017Investor deck q2 2017
Investor deck q2 2017
 
Q4 2016 investor deck
Q4 2016 investor deckQ4 2016 investor deck
Q4 2016 investor deck
 
Q1 2017 investor deck
Q1 2017 investor deckQ1 2017 investor deck
Q1 2017 investor deck
 

Viewers also liked

E Commerce Analytics Demandware
E Commerce Analytics DemandwareE Commerce Analytics Demandware
E Commerce Analytics Demandwareloripelletier
 
GoDaddy Overview November 2016
GoDaddy Overview November 2016GoDaddy Overview November 2016
GoDaddy Overview November 2016godaddyir
 
Html5 the future of browsers
Html5 the future of browsersHtml5 the future of browsers
Html5 the future of browsersJatin Dabas
 
Socialmedia wereldwaterdag 100323
Socialmedia wereldwaterdag 100323Socialmedia wereldwaterdag 100323
Socialmedia wereldwaterdag 100323Else Boutkan
 
A peek inside the Jury @ Cannes Lions Festival of Creativity
A peek inside the Jury @ Cannes Lions Festival of CreativityA peek inside the Jury @ Cannes Lions Festival of Creativity
A peek inside the Jury @ Cannes Lions Festival of CreativityBen Shipley
 
Kuifje verliest voor het eerst geld
Kuifje verliest voor het eerst geldKuifje verliest voor het eerst geld
Kuifje verliest voor het eerst geldThierry Debels
 
The Joys of Employee Engagement and Why You Should Start Now
The Joys of Employee Engagement and Why You Should Start NowThe Joys of Employee Engagement and Why You Should Start Now
The Joys of Employee Engagement and Why You Should Start NowGlassdoor
 
Living and working in denmark standard - 2014
Living and working in denmark   standard - 2014Living and working in denmark   standard - 2014
Living and working in denmark standard - 2014Eures Canarias
 
Státní znaky české republiky - vlajky.eu
Státní znaky české republiky - vlajky.euStátní znaky české republiky - vlajky.eu
Státní znaky české republiky - vlajky.euVlajky.EU s.r.o.
 
Content for Business Past, Present & Future
Content for Business Past, Present & FutureContent for Business Past, Present & Future
Content for Business Past, Present & FutureLeanne Ross
 
Tri Net Wp 10 Principles Hc Plan (2)
Tri Net Wp 10 Principles Hc Plan (2)Tri Net Wp 10 Principles Hc Plan (2)
Tri Net Wp 10 Principles Hc Plan (2)Tim Weyland
 
Taking Social To the Next Level: Find & Build A Community That Cares
Taking Social To the Next Level: Find & Build A Community That CaresTaking Social To the Next Level: Find & Build A Community That Cares
Taking Social To the Next Level: Find & Build A Community That CaresJennifer Lopez
 
Kindbruid van amper 14 jaar aangekomen in België
Kindbruid van amper 14 jaar aangekomen in BelgiëKindbruid van amper 14 jaar aangekomen in België
Kindbruid van amper 14 jaar aangekomen in BelgiëThierry Debels
 
How to Make Splurges Sensible
How to Make Splurges SensibleHow to Make Splurges Sensible
How to Make Splurges SensibleFood Insight
 

Viewers also liked (17)

Dreamforce 2016 Investor Day
Dreamforce 2016 Investor DayDreamforce 2016 Investor Day
Dreamforce 2016 Investor Day
 
E Commerce Analytics Demandware
E Commerce Analytics DemandwareE Commerce Analytics Demandware
E Commerce Analytics Demandware
 
GoDaddy Overview November 2016
GoDaddy Overview November 2016GoDaddy Overview November 2016
GoDaddy Overview November 2016
 
Html5 the future of browsers
Html5 the future of browsersHtml5 the future of browsers
Html5 the future of browsers
 
Socialmedia wereldwaterdag 100323
Socialmedia wereldwaterdag 100323Socialmedia wereldwaterdag 100323
Socialmedia wereldwaterdag 100323
 
A peek inside the Jury @ Cannes Lions Festival of Creativity
A peek inside the Jury @ Cannes Lions Festival of CreativityA peek inside the Jury @ Cannes Lions Festival of Creativity
A peek inside the Jury @ Cannes Lions Festival of Creativity
 
Kuifje verliest voor het eerst geld
Kuifje verliest voor het eerst geldKuifje verliest voor het eerst geld
Kuifje verliest voor het eerst geld
 
The Joys of Employee Engagement and Why You Should Start Now
The Joys of Employee Engagement and Why You Should Start NowThe Joys of Employee Engagement and Why You Should Start Now
The Joys of Employee Engagement and Why You Should Start Now
 
Living and working in denmark standard - 2014
Living and working in denmark   standard - 2014Living and working in denmark   standard - 2014
Living and working in denmark standard - 2014
 
Social media strategy Enfield
Social media strategy Enfield Social media strategy Enfield
Social media strategy Enfield
 
Státní znaky české republiky - vlajky.eu
Státní znaky české republiky - vlajky.euStátní znaky české republiky - vlajky.eu
Státní znaky české republiky - vlajky.eu
 
PROPIEDAD INTELECTUAL EN COLOMBIA.
PROPIEDAD INTELECTUAL EN COLOMBIA.PROPIEDAD INTELECTUAL EN COLOMBIA.
PROPIEDAD INTELECTUAL EN COLOMBIA.
 
Content for Business Past, Present & Future
Content for Business Past, Present & FutureContent for Business Past, Present & Future
Content for Business Past, Present & Future
 
Tri Net Wp 10 Principles Hc Plan (2)
Tri Net Wp 10 Principles Hc Plan (2)Tri Net Wp 10 Principles Hc Plan (2)
Tri Net Wp 10 Principles Hc Plan (2)
 
Taking Social To the Next Level: Find & Build A Community That Cares
Taking Social To the Next Level: Find & Build A Community That CaresTaking Social To the Next Level: Find & Build A Community That Cares
Taking Social To the Next Level: Find & Build A Community That Cares
 
Kindbruid van amper 14 jaar aangekomen in België
Kindbruid van amper 14 jaar aangekomen in BelgiëKindbruid van amper 14 jaar aangekomen in België
Kindbruid van amper 14 jaar aangekomen in België
 
How to Make Splurges Sensible
How to Make Splurges SensibleHow to Make Splurges Sensible
How to Make Splurges Sensible
 

Similar to Ir deck 3 q16 v3

Ir deck 2 q 16 final 9.29.2016
Ir deck 2 q 16 final 9.29.2016Ir deck 2 q 16 final 9.29.2016
Ir deck 2 q 16 final 9.29.2016IR_HubSpot
 
Ir deck 5 21-16 final q1
Ir deck 5 21-16 final q1Ir deck 5 21-16 final q1
Ir deck 5 21-16 final q1IR_HubSpot
 
From Startup to IPO: Lessons from the pricing trenches - Brad Coffey of HubSpot
 From Startup to IPO: Lessons from the pricing trenches - Brad Coffey of HubSpot From Startup to IPO: Lessons from the pricing trenches - Brad Coffey of HubSpot
From Startup to IPO: Lessons from the pricing trenches - Brad Coffey of HubSpotPrice Intelligently
 
Hubs ir deck q417 final
Hubs ir deck q417 finalHubs ir deck q417 final
Hubs ir deck q417 finalIR_HubSpot
 
hubspot - Quarterly Investor Presentation Q423.pdf
hubspot - Quarterly Investor Presentation Q423.pdfhubspot - Quarterly Investor Presentation Q423.pdf
hubspot - Quarterly Investor Presentation Q423.pdfFrank Bruno
 
Webinar: How Salesforce.com drives B2B marketing ROI with LinkedIn Sponsored ...
Webinar: How Salesforce.com drives B2B marketing ROI with LinkedIn Sponsored ...Webinar: How Salesforce.com drives B2B marketing ROI with LinkedIn Sponsored ...
Webinar: How Salesforce.com drives B2B marketing ROI with LinkedIn Sponsored ...LinkedIn
 
HubSpot State of Inbound 2014
HubSpot State of Inbound 2014HubSpot State of Inbound 2014
HubSpot State of Inbound 2014Dan St. Peter
 
State of Inbound 2014
State of Inbound 2014State of Inbound 2014
State of Inbound 2014Juan Tintore
 
CRM Strategies for Accelerating B2B Pipeline Growth
CRM Strategies for Accelerating B2B Pipeline GrowthCRM Strategies for Accelerating B2B Pipeline Growth
CRM Strategies for Accelerating B2B Pipeline GrowthSalesforce Marketing Cloud
 
Overcoming the Top 3 SMB Challenges with Marketing Automation
Overcoming the Top 3 SMB Challenges with Marketing AutomationOvercoming the Top 3 SMB Challenges with Marketing Automation
Overcoming the Top 3 SMB Challenges with Marketing AutomationMediacurrent
 
Business operations consultant marketing plan
Business operations consultant marketing planBusiness operations consultant marketing plan
Business operations consultant marketing planzubeditufail
 
KM Strategic Results and Case Studies
KM Strategic Results and Case StudiesKM Strategic Results and Case Studies
KM Strategic Results and Case StudiesKirsten Meyer
 
The Problems at Small Marketing Agencies & How to Fix Them
The Problems at Small Marketing Agencies & How to Fix ThemThe Problems at Small Marketing Agencies & How to Fix Them
The Problems at Small Marketing Agencies & How to Fix ThemPeter Caputa
 
Generating leads with Inbound Marketing
Generating leads with Inbound MarketingGenerating leads with Inbound Marketing
Generating leads with Inbound MarketingAndrew Shaw
 
3 Keys to Measuring Marketing and Sales Success
3 Keys to Measuring Marketing and Sales Success3 Keys to Measuring Marketing and Sales Success
3 Keys to Measuring Marketing and Sales SuccessPardot
 
The 2017 State of B2B Digital Marketing Report
The 2017 State of B2B Digital Marketing ReportThe 2017 State of B2B Digital Marketing Report
The 2017 State of B2B Digital Marketing ReportDemandWave
 
Close More Deals with Effective Lead Scoring
Close More Deals with Effective Lead ScoringClose More Deals with Effective Lead Scoring
Close More Deals with Effective Lead ScoringMarketo
 

Similar to Ir deck 3 q16 v3 (20)

Ir deck 2 q 16 final 9.29.2016
Ir deck 2 q 16 final 9.29.2016Ir deck 2 q 16 final 9.29.2016
Ir deck 2 q 16 final 9.29.2016
 
Ir deck 5 21-16 final q1
Ir deck 5 21-16 final q1Ir deck 5 21-16 final q1
Ir deck 5 21-16 final q1
 
From Startup to IPO: Lessons from the pricing trenches - Brad Coffey of HubSpot
 From Startup to IPO: Lessons from the pricing trenches - Brad Coffey of HubSpot From Startup to IPO: Lessons from the pricing trenches - Brad Coffey of HubSpot
From Startup to IPO: Lessons from the pricing trenches - Brad Coffey of HubSpot
 
Hubs ir deck q417 final
Hubs ir deck q417 finalHubs ir deck q417 final
Hubs ir deck q417 final
 
hubspot - Quarterly Investor Presentation Q423.pdf
hubspot - Quarterly Investor Presentation Q423.pdfhubspot - Quarterly Investor Presentation Q423.pdf
hubspot - Quarterly Investor Presentation Q423.pdf
 
Webinar: How Salesforce.com drives B2B marketing ROI with LinkedIn Sponsored ...
Webinar: How Salesforce.com drives B2B marketing ROI with LinkedIn Sponsored ...Webinar: How Salesforce.com drives B2B marketing ROI with LinkedIn Sponsored ...
Webinar: How Salesforce.com drives B2B marketing ROI with LinkedIn Sponsored ...
 
HubSpot 2017 State of Inbound Report
HubSpot 2017 State of Inbound ReportHubSpot 2017 State of Inbound Report
HubSpot 2017 State of Inbound Report
 
Galileo - Inbound Marketing Approach
Galileo - Inbound Marketing ApproachGalileo - Inbound Marketing Approach
Galileo - Inbound Marketing Approach
 
HubSpot State of Inbound 2014
HubSpot State of Inbound 2014HubSpot State of Inbound 2014
HubSpot State of Inbound 2014
 
State of Inbound 2014
State of Inbound 2014State of Inbound 2014
State of Inbound 2014
 
CRM Strategies for Accelerating B2B Pipeline Growth
CRM Strategies for Accelerating B2B Pipeline GrowthCRM Strategies for Accelerating B2B Pipeline Growth
CRM Strategies for Accelerating B2B Pipeline Growth
 
Overcoming the Top 3 SMB Challenges with Marketing Automation
Overcoming the Top 3 SMB Challenges with Marketing AutomationOvercoming the Top 3 SMB Challenges with Marketing Automation
Overcoming the Top 3 SMB Challenges with Marketing Automation
 
Pardot Upgrade Paths
Pardot Upgrade PathsPardot Upgrade Paths
Pardot Upgrade Paths
 
Business operations consultant marketing plan
Business operations consultant marketing planBusiness operations consultant marketing plan
Business operations consultant marketing plan
 
KM Strategic Results and Case Studies
KM Strategic Results and Case StudiesKM Strategic Results and Case Studies
KM Strategic Results and Case Studies
 
The Problems at Small Marketing Agencies & How to Fix Them
The Problems at Small Marketing Agencies & How to Fix ThemThe Problems at Small Marketing Agencies & How to Fix Them
The Problems at Small Marketing Agencies & How to Fix Them
 
Generating leads with Inbound Marketing
Generating leads with Inbound MarketingGenerating leads with Inbound Marketing
Generating leads with Inbound Marketing
 
3 Keys to Measuring Marketing and Sales Success
3 Keys to Measuring Marketing and Sales Success3 Keys to Measuring Marketing and Sales Success
3 Keys to Measuring Marketing and Sales Success
 
The 2017 State of B2B Digital Marketing Report
The 2017 State of B2B Digital Marketing ReportThe 2017 State of B2B Digital Marketing Report
The 2017 State of B2B Digital Marketing Report
 
Close More Deals with Effective Lead Scoring
Close More Deals with Effective Lead ScoringClose More Deals with Effective Lead Scoring
Close More Deals with Effective Lead Scoring
 

Recently uploaded

VIP 7001035870 Find & Meet Hyderabad Call Girls Shamirpet high-profile Call Girl
VIP 7001035870 Find & Meet Hyderabad Call Girls Shamirpet high-profile Call GirlVIP 7001035870 Find & Meet Hyderabad Call Girls Shamirpet high-profile Call Girl
VIP 7001035870 Find & Meet Hyderabad Call Girls Shamirpet high-profile Call Girladitipandeya
 
Short-, Mid-, and Long-term gxxoals.pptx
Short-, Mid-, and Long-term gxxoals.pptxShort-, Mid-, and Long-term gxxoals.pptx
Short-, Mid-, and Long-term gxxoals.pptxHenryBriggs2
 
Nicola Mining Inc. Corporate Presentation April 2024
Nicola Mining Inc. Corporate Presentation April 2024Nicola Mining Inc. Corporate Presentation April 2024
Nicola Mining Inc. Corporate Presentation April 2024nicola_mining
 
Teck Investor Presentation, April 24, 2024
Teck Investor Presentation, April 24, 2024Teck Investor Presentation, April 24, 2024
Teck Investor Presentation, April 24, 2024TeckResourcesLtd
 
Collective Mining | Corporate Presentation - April 2024
Collective Mining | Corporate Presentation - April 2024Collective Mining | Corporate Presentation - April 2024
Collective Mining | Corporate Presentation - April 2024CollectiveMining1
 
Call Girl Kolkata Sia 🤌 8250192130 🚀 Vip Call Girls Kolkata
Call Girl Kolkata Sia 🤌  8250192130 🚀 Vip Call Girls KolkataCall Girl Kolkata Sia 🤌  8250192130 🚀 Vip Call Girls Kolkata
Call Girl Kolkata Sia 🤌 8250192130 🚀 Vip Call Girls Kolkataanamikaraghav4
 
VIP Kolkata Call Girls Bidhannagar 8250192130 Available With Room
VIP Kolkata Call Girls Bidhannagar 8250192130 Available With RoomVIP Kolkata Call Girls Bidhannagar 8250192130 Available With Room
VIP Kolkata Call Girls Bidhannagar 8250192130 Available With Roomrran7532
 
CALL ON ➥8923113531 🔝Call Girls Fazullaganj Lucknow best sexual service
CALL ON ➥8923113531 🔝Call Girls Fazullaganj Lucknow best sexual serviceCALL ON ➥8923113531 🔝Call Girls Fazullaganj Lucknow best sexual service
CALL ON ➥8923113531 🔝Call Girls Fazullaganj Lucknow best sexual serviceanilsa9823
 
VIP Amritsar Call Girl 7001035870 Enjoy Call Girls With Our Escorts
VIP Amritsar Call Girl 7001035870 Enjoy Call Girls With Our EscortsVIP Amritsar Call Girl 7001035870 Enjoy Call Girls With Our Escorts
VIP Amritsar Call Girl 7001035870 Enjoy Call Girls With Our Escortssonatiwari757
 
Osisko Gold Royalties Ltd - Corporate Presentation, April 23, 2024
Osisko Gold Royalties Ltd - Corporate Presentation, April 23, 2024Osisko Gold Royalties Ltd - Corporate Presentation, April 23, 2024
Osisko Gold Royalties Ltd - Corporate Presentation, April 23, 2024Osisko Gold Royalties Ltd
 
VIP Call Girl Amritsar 7001035870 Enjoy Call Girls With Our Escorts
VIP Call Girl Amritsar 7001035870 Enjoy Call Girls With Our EscortsVIP Call Girl Amritsar 7001035870 Enjoy Call Girls With Our Escorts
VIP Call Girl Amritsar 7001035870 Enjoy Call Girls With Our Escortssonatiwari757
 
Q3 FY24 Earnings Conference Call Presentation
Q3 FY24 Earnings Conference Call PresentationQ3 FY24 Earnings Conference Call Presentation
Q3 FY24 Earnings Conference Call PresentationSysco_Investors
 

Recently uploaded (20)

Rohini Sector 15 Call Girls Delhi 9999965857 @Sabina Saikh No Advance
Rohini Sector 15 Call Girls Delhi 9999965857 @Sabina Saikh No AdvanceRohini Sector 15 Call Girls Delhi 9999965857 @Sabina Saikh No Advance
Rohini Sector 15 Call Girls Delhi 9999965857 @Sabina Saikh No Advance
 
Call Girls In Vasant Kunj 📱 9999965857 🤩 Delhi 🫦 HOT AND SEXY VVIP 🍎 SERVICE
Call Girls In Vasant Kunj 📱  9999965857  🤩 Delhi 🫦 HOT AND SEXY VVIP 🍎 SERVICECall Girls In Vasant Kunj 📱  9999965857  🤩 Delhi 🫦 HOT AND SEXY VVIP 🍎 SERVICE
Call Girls In Vasant Kunj 📱 9999965857 🤩 Delhi 🫦 HOT AND SEXY VVIP 🍎 SERVICE
 
VIP 7001035870 Find & Meet Hyderabad Call Girls Shamirpet high-profile Call Girl
VIP 7001035870 Find & Meet Hyderabad Call Girls Shamirpet high-profile Call GirlVIP 7001035870 Find & Meet Hyderabad Call Girls Shamirpet high-profile Call Girl
VIP 7001035870 Find & Meet Hyderabad Call Girls Shamirpet high-profile Call Girl
 
Short-, Mid-, and Long-term gxxoals.pptx
Short-, Mid-, and Long-term gxxoals.pptxShort-, Mid-, and Long-term gxxoals.pptx
Short-, Mid-, and Long-term gxxoals.pptx
 
Nicola Mining Inc. Corporate Presentation April 2024
Nicola Mining Inc. Corporate Presentation April 2024Nicola Mining Inc. Corporate Presentation April 2024
Nicola Mining Inc. Corporate Presentation April 2024
 
Teck Investor Presentation, April 24, 2024
Teck Investor Presentation, April 24, 2024Teck Investor Presentation, April 24, 2024
Teck Investor Presentation, April 24, 2024
 
Collective Mining | Corporate Presentation - April 2024
Collective Mining | Corporate Presentation - April 2024Collective Mining | Corporate Presentation - April 2024
Collective Mining | Corporate Presentation - April 2024
 
Rohini Sector 17 Call Girls Delhi 9999965857 @Sabina Saikh No Advance
Rohini Sector 17 Call Girls Delhi 9999965857 @Sabina Saikh No AdvanceRohini Sector 17 Call Girls Delhi 9999965857 @Sabina Saikh No Advance
Rohini Sector 17 Call Girls Delhi 9999965857 @Sabina Saikh No Advance
 
Call Girl Kolkata Sia 🤌 8250192130 🚀 Vip Call Girls Kolkata
Call Girl Kolkata Sia 🤌  8250192130 🚀 Vip Call Girls KolkataCall Girl Kolkata Sia 🤌  8250192130 🚀 Vip Call Girls Kolkata
Call Girl Kolkata Sia 🤌 8250192130 🚀 Vip Call Girls Kolkata
 
VIP Kolkata Call Girls Bidhannagar 8250192130 Available With Room
VIP Kolkata Call Girls Bidhannagar 8250192130 Available With RoomVIP Kolkata Call Girls Bidhannagar 8250192130 Available With Room
VIP Kolkata Call Girls Bidhannagar 8250192130 Available With Room
 
Call Girls 🫤 Mukherjee Nagar ➡️ 9999965857 ➡️ Delhi 🫦 Russian Escorts FULL ...
Call Girls 🫤 Mukherjee Nagar ➡️ 9999965857  ➡️ Delhi 🫦  Russian Escorts FULL ...Call Girls 🫤 Mukherjee Nagar ➡️ 9999965857  ➡️ Delhi 🫦  Russian Escorts FULL ...
Call Girls 🫤 Mukherjee Nagar ➡️ 9999965857 ➡️ Delhi 🫦 Russian Escorts FULL ...
 
Model Call Girl in Uttam Nagar Delhi reach out to us at 🔝9953056974🔝
Model Call Girl in Uttam Nagar Delhi reach out to us at 🔝9953056974🔝Model Call Girl in Uttam Nagar Delhi reach out to us at 🔝9953056974🔝
Model Call Girl in Uttam Nagar Delhi reach out to us at 🔝9953056974🔝
 
CALL ON ➥8923113531 🔝Call Girls Fazullaganj Lucknow best sexual service
CALL ON ➥8923113531 🔝Call Girls Fazullaganj Lucknow best sexual serviceCALL ON ➥8923113531 🔝Call Girls Fazullaganj Lucknow best sexual service
CALL ON ➥8923113531 🔝Call Girls Fazullaganj Lucknow best sexual service
 
VIP Amritsar Call Girl 7001035870 Enjoy Call Girls With Our Escorts
VIP Amritsar Call Girl 7001035870 Enjoy Call Girls With Our EscortsVIP Amritsar Call Girl 7001035870 Enjoy Call Girls With Our Escorts
VIP Amritsar Call Girl 7001035870 Enjoy Call Girls With Our Escorts
 
Russian Call Girls Rohini Sector 22 💓 Delhi 9999965857 @Sabina Modi VVIP MODE...
Russian Call Girls Rohini Sector 22 💓 Delhi 9999965857 @Sabina Modi VVIP MODE...Russian Call Girls Rohini Sector 22 💓 Delhi 9999965857 @Sabina Modi VVIP MODE...
Russian Call Girls Rohini Sector 22 💓 Delhi 9999965857 @Sabina Modi VVIP MODE...
 
Osisko Gold Royalties Ltd - Corporate Presentation, April 23, 2024
Osisko Gold Royalties Ltd - Corporate Presentation, April 23, 2024Osisko Gold Royalties Ltd - Corporate Presentation, April 23, 2024
Osisko Gold Royalties Ltd - Corporate Presentation, April 23, 2024
 
VIP Call Girl Amritsar 7001035870 Enjoy Call Girls With Our Escorts
VIP Call Girl Amritsar 7001035870 Enjoy Call Girls With Our EscortsVIP Call Girl Amritsar 7001035870 Enjoy Call Girls With Our Escorts
VIP Call Girl Amritsar 7001035870 Enjoy Call Girls With Our Escorts
 
Q3 FY24 Earnings Conference Call Presentation
Q3 FY24 Earnings Conference Call PresentationQ3 FY24 Earnings Conference Call Presentation
Q3 FY24 Earnings Conference Call Presentation
 
@9999965857 🫦 Sexy Desi Call Girls Karol Bagh 💓 High Profile Escorts Delhi 🫶
@9999965857 🫦 Sexy Desi Call Girls Karol Bagh 💓 High Profile Escorts Delhi 🫶@9999965857 🫦 Sexy Desi Call Girls Karol Bagh 💓 High Profile Escorts Delhi 🫶
@9999965857 🫦 Sexy Desi Call Girls Karol Bagh 💓 High Profile Escorts Delhi 🫶
 
Vip Call Girls Vasant Kunj ➡️ Delhi ➡️ 9999965857 No Advance 24HRS Live
Vip Call Girls Vasant Kunj ➡️ Delhi ➡️ 9999965857 No Advance 24HRS LiveVip Call Girls Vasant Kunj ➡️ Delhi ➡️ 9999965857 No Advance 24HRS Live
Vip Call Girls Vasant Kunj ➡️ Delhi ➡️ 9999965857 No Advance 24HRS Live
 

Ir deck 3 q16 v3

  • 1. 1
  • 2. 2 Safe Harbor This presentation includes certain “forward-looking statements" within the meaning of the Private Securities Litigation Reform Act of 1995, including statements concerning our cash flow and margin improvement expectations, our position to execute on our growth strategy in the mid-market, and our ability to expand our leadership position and market opportunity for our inbound platform. These forward-looking statements include, but are not limited to, plans, objectives, expectations and intentions and other statements contained in this press release that are not historical facts and statements identified by words such as "expects," "anticipates," "intends," "plans," "believes," "seeks," "estimates" or words of similar meaning. These forward-looking statements reflect our current views about our plans, intentions, expectations, strategies and prospects, which are based on the information currently available to us and on assumptions we have made. Although we believe that our plans, intentions, expectations, strategies and prospects as reflected in or suggested by those forward-looking statements are reasonable, we can give no assurance that the plans, intentions, expectations or strategies will be attained or achieved. Furthermore, actual results may differ materially from those described in the forward-looking statements and will be affected by a variety of risks and factors that are beyond our control including, without limitation, our history of losses, our ability to retain existing customers and add new customers, the continued growth of the market for an inbound platform; our ability to differentiate our platform from competing products and technologies; our ability to manage our growth effectively to maintain our high level of service; our ability to maintain and expand relationships with our marketing agency partners; our ability to successfully recruit and retain highly-qualified personnel; the price volatility of our common stock, and other risks set forth under the caption "Risk Factors" in our Quarterly Report on Form 10-Q filed on November 2, 2016 and our other SEC filings. We assume no obligation to update any forward- looking statements contained in this document as a result of new information, future events or otherwise.
  • 3. Q3'14 Q4'14 Q1'15 Q2'15 Q3'15 Q4'15 Q1'16 Q2'16 Q3'16 RevenueCustomers by Country An Inbound Marketing & Sales SaaS Company 21,658 customers, 90+ countries, 6 locations worldwide Cambridge, MA | Portsmouth, NH | Dublin, Ireland | Sydney, Australia | Singapore | Tokyo, Japan $30.4M 51% Y/Y $34.2M 53% Y/Y $38.2M 58% Y/Y $42.9M 58% Y/Y $47.7M 57% Y/Y $53.1M 56% Y/Y $59.0M 54% Y/Y 3 $65.0M 51% Y/Y $70.6M 48% Y/Y
  • 5. Marketing has become an arms race for attention. 5
  • 6. 94% skip TV ads 94% unsubscribe from email 27% direct mail is never opened 50% (Over 200M) are on do-not-call lists Base: Varied bases, minimum 598 global digital consumers Source: HubSpot Global Interruptive Ads Survey, Q4 2015 – Q1 2016. The old marketing and sales playbook is broken. (Because the way people shop for and buy things has changed) 6
  • 7. But today’s consumers have the tools to fight back. 7
  • 8. Skip commercials Screen calls Delete spam Ignore print Straight in the bin Pop-up blockers Blocking Out the Noise It’s easier than ever for customers to block out the noise 8
  • 9. So how do you reach a consumer who doesn’t want to be bothered? Be helpful. 9
  • 11. “Wait. What is inbound?” 11
  • 12. Inbound is about the size of your brain, not the width of your wallet Helpful | Human | Personal | Transformational | Empowering | Educational 12
  • 13. How Does Inbound Work? Aggressively pushes content at innocent bystanders, interrupting their life Inbound pulls in prospects by offering helpful content and experience when they need it VS. Outbound Inbound SEO | Blogs | SocialCold Calling | Spam | Interruptive Ads 13
  • 14. How does HubSpot do inbound? 14
  • 16. The Inbound Value Proposition: Simply put, it’s about growing an asset vs. renting one. 1 2 3 Predictable Measurable Proven ROI Icon Source: http://thenounproject.com via Gregor Cresnar 16
  • 17. Did you know: More than 90% of HubSpot’s new leads each month come from “Old Content”? 92% Leads from Old Posts 8% Leads from New Posts In other words, if HubSpot’s blogging team took next month off, we’d still generate 92% of leads as if we’d continued to publish new content. Source: Historical Blog Post Optimization Project (learn more here: http://blog.hubspot.com/marketing/historical-blog-seo-conversion-optimization) Predictable 17
  • 18. This post was written by HubSpot CEO Brian Halligan in July 2010. In 2015, it: ● Still ranks #1 in Google searches ● Received 17,854 views ● Generated 117 leads 5 Years later, still moving the needle. What Does an Inbound Asset Look Like? Article ranks #1 for “inbound marketing vs outbound marketing” 18
  • 19. In a digital world, track everything from clicks to conversions to revenue Measurable 19
  • 20. No matter the size of your marketing budget, inbound can bring you ROI. This is the real deal. From big marketing budget to small, a significant number of businesses saw higher returns from inbound marketing than from outbound. 0% 10% 20% 30% 40% 50% 60% $25K or less $25,001 to $100K $100,001 to $500K $500,001 to $1M $1M to $5M More than $5M We see higher ROI using inbound marketing We see higher ROI using outbound marketing 42% Inbound vs. Outbound ROI by Marketing Spend Big budget or small – everyone gets big returns from inbound 8% 47% 52% 44% 48% 52% 14% 11% 18% 14% 18% Proven ROI Source: HubSpot’s 2015 State of Inbound Report; survey of approximately 4,000 respondents; majority of respondents are marketers at B2Bs; approx one-third of respondents have an affiliation with HubSpot; approx ½ of respondents generate revenue under $1M 20
  • 21. 0% 10% 20% 30% 40% 50% 60% 70% 80% 0 to 25 employees 26 to 200 employees 201 or more employees As it turns out, ROI matters. A lot. Proving the ROI of our marketing activities Securing enough budget Managing our website Identifying the right technologies for my needs Training our team Targeting content for an international audience Hiring top talent Finding an executive sponsor 42% 57% 71% 32% 32% 51% 32% 31% 31% 31% 22% 29% 23% 24% 26% 23% 23% 24% 19% 25% 22% 9% 5% 8% Top Challenges by Company Size Proving ROI and subsequently securing more budget are marketers’ biggest roadblocks Source: HubSpot’s 2015 State of Inbound Report; survey of approximately 4,000 respondents; majority of respondents are marketers at B2Bs; approx one-third of respondents have an affiliation with HubSpot; approx ½ of respondents generate revenue under $1M 21
  • 22. We are an inbound marketing & sales SaaS company. Our mission is to transform how companies market and sell. Our vision is a world where business is inbound. 22
  • 23. Total Addressable Market With growth in international via new market exploration and in ASRPC via new products, we anticipate this opportunity will continue to grow. Mid Market Opportunity -3.0M is US, CAN, and Europe. 1.6M mid-market businesses with a web presence in the United States and Canada. 1.4M mid-market businesses with a web presence in Europe. -AMI Partners data, 2014. Avg. Subscription Revenue per Customer from Q3’16 There are ~ 3 million mid-market companies in US, Canada, and Europe alone. With an ASRPC of $12,320, we’re looking at $30+ billion of untapped potential. 23
  • 24. 170,000+ Members Where the inbound movement grows the other 360 days of the year 14,000+ Registered Attendees Where the inbound movement grows every year ● 40% more registered attendees than 2014 ● 250+ speakers; hundreds of hours of content ● 123k mentions of #INBOUND15 3,400+ Partners HubSpot provides training and support to our agency partners, working together to sell our products. 54,000+ Certifications HubSpot’s one-stop-shop for free education on all things inbound 51,000+ Linking Domains The number of websites linking back to HubSpot, providing us with both authority in search engines and recognition among industry professionals The Inbound Community 24
  • 25. HubSpot Marketing All-in-one marketing software platform Sales Productivity Tools Free CRM for Small Business HubSpot CRM Content Marketing Automation Analytics & Reporting Websites Ads Add-on Email Templates Profiles Email Tracking Sequences Contact Timeline Reporting Analytics Prospects HubSpot Sales The HubSpot Platform 25
  • 26. HubSpot Marketing Pricing Upgrade based on contact database size. Upgrade based on features. Cross sell new products into both marketing and sales customers 26
  • 27. Company Awards ● Glassdoor: #4 Workplace ● Fortune & Great Place to Work: Top Workplace for Camaraderie, Best Small & Medium Workplace, Top Workplace for Women ● Entrepreneur: Top Company Culture ● The Boston Globe: Top Place to Work ● Boston Business Journal: Best Place to Work Product and Service Awards ● Named a “Visionary” in Gartner’s 2015 Magic Quadrant for CRM Lead Management ● Frost & Sullivan 2015 Global Marketing Automation Software Customer Value Leadership Award ● G2 Crowd: Best Marketing Automation Software, Best Web Content Management Software, Named a “Leader” in the Summer 2015 Marketing Automation Grid ● GetApp’s 2016 Q3 report: Named #1 Marketing Automation Software, Content Marketing App What do these accolades mean? In combination with HubSpot’s close proximity to Boston’s top-tier schools, we attract top talent. HubSpot, in the words of others. 27
  • 28. Customer Case Study: VeriFirst Background Screening • Low organic traffic • Poor web presence • Multiple point solutions • Inefficient sales funnel • Poor lead nurturing • Poor S&M alignment • Slow sales onboarding Problem Solution Tools • Blog • Sites • SEO • Email templates • Email tracking • Sequences • Contact timeline • Prospects • Tasks 6X increase in monthly customers 12X increase in monthly traffic 11X increase in monthly contacts generated Three Year Results: Source: Customer data; Note: “Three Year Results” compare the 6-month trailing averages of visits, contacts, and customers in August 2012 to the same values in May 2016. 28
  • 29. HubSpot, in short… Growth opportunity with multiple drivers - Large, diversified and expanding global addressable market - Drive new customer growth, cross sell existing products and grow internationally Efficient and scalable customer acquisition model - We expect margin improvement will drive sustained positive operating cash flow throughout ‘16 and break-even free cash flow in 1H17 29
  • 31. GROWTH DRIVERS: Domestic | International | Cross Sell Opportunity REVENUE CUSTOMERS ASRPC 31 Q4'14 Q1'15 Q2'15 Q3'15 Q4'15 Q1'16 Q2'16 Q3'16 $34.2M 53% Y/Y $38.2M 58% Y/Y $42.9M 58% Y/Y $47.7M 57% Y $53.1M 56% Y/Y $59.0M 54% Y/Y $65.0M 51% Y/Y $70.6M 48% Y/Y Q4'14 Q1'15 Q2'15 Q3'15 Q4'15 Q1'16 Q2'16 Q3'16 13,607 35% Y/Y 14,746 35% Y/Y 15,839 36% Y/Y 16,854 35% Y/Y 18,116 33% Y/Y 19,322 31% Y/Y 20,444 29% Y/Y 21,658 29% Y/Y Q4'14 Q1'15 Q2'15 Q3'15 Q4'15 Q1'16 Q2'16 Q3'16 $9,530 14% Y/Y $9,740 15% Y/Y $10,127 15% Y/Y $10,607 16% Y/Y $11,135 17% Y/Y $11,494 18% Y/Y $11,978 18% Y/Y $12,320 16% Y/Y
  • 32. Steady Progress in Gross and Operating Margin Trajectory 32All percentages for historical period are non-GAAP and exclude expenses associated with stock based compensation and amortization of acquired intangibles. Please refer to the end of this presentation for a reconciliation of GAAP to non-GAAP figures. *This removes the impact of Inbound in 2015. Q1'14 Q2'14 Q3'14 Q4'14 Q1'15 Q2'15 Q3'15 Q4'15 Q1'16 Q2'16 Q3'16 Operating Margin (Non-GAAP) Gross Margin (Non-GAAP) ~9 point operating margin improvement* -34.3% -26.0% -31.8% -20.7% -16.4% -13.2% -18.3% -8.3% -6.1% -3.9% -1.8% 68.9% 70.0% 70.1% 71.9% 73.5% 74.8% 74.7% 75.1% 77.0% 77.6% 78.4%
  • 33. Key Financial Metrics Key Financial Metrics (% of Revenue) 2011 2012 2013 2014 2015 Q1’16 Q2’16 Q3’16 Gross Margin 61% 70% 65% 70% 75% 77% 78% 78% R&D 27% 19% 18% 17% 14% 14% 14% 14% S&M 82% 66% 67% 63% 58% 56% 55% 53% G&A 21% 16% 19% 18% 16% 14% 13% 13% Operating (Loss) / Income % (69%) (31%) (39%) (28%) (14%) (6%) (4%) (2%) *CFFO (44%) (11%) (26%) (11%) (0%) 5% 13% 7% All percentages for historical period are non-GAAP (other than CFFO) and exclude expenses associated with stock based compensation and amortization of acquired intangibles. Please refer to the end of this presentation for a reconciliation of GAAP to non-GAAP figures. 33
  • 34. Thank you from HubSpot! 34
  • 35. GAAP to Non-GAAP Reconciliation 35 HubSpot, Inc. GAAP to Non-GAAP Reconciliation $ '000s % of Revenues $ '000s % of Revenues $ '000s % of Revenues $ '000s % of Revenues $ '000s % of Revenues $ '000s % of Revenues $ '000s % of Revenues $ '000s % of Revenues Cost of Revenue Subscription 4,964 17% 9,689 19% 18,745 24% 23,655 20% 32,271 18% 8,910 15% 9,985 15% 10,655 15% Stock-based compensation (16) 0% (27) 0% (50) 0% (128) 0% (341) 0% (94) 0% (131) 0% (139) 0% Amortization of acquired intangibles (130) 0% (224) 0% (359) 0% (118) 0% (70) 0% (18) 0% (13) 0% (13) 0% Non-GAAP subscription 4,818 17% 9,438 18% 18,336 24% 23,409 20% 31,860 18% 8,798 15% 9,841 15% 10,503 15% Professional services and other 6,368 22% 6,004 12% 8,759 11% 11,425 10% 15,652 9% 5,061 9% 5,210 8% 5,157 7% Stock-based compensation (131) 0% (100) 0% (211) 0% (498) 0% (1,216) -1% (324) -1% (477) -1% (438) -1% Amortization of acquired intangibles - 0% - 0% - 0% - 0% - 0% - 0% - 0% - 0% Non-GAAP professional services and other 6,237 22% 5,904 11% 8,548 11% 10,927 9% 14,436 8% 4,737 8% 4,733 7% 4,719 7% Gross Profit Gross Profit 17,221 60% 35,911 70% 50,130 65% 80,796 70% 134,020 74% 44,989 76% 49,779 77% 54,777 78% Stock-based compensation 147 1% 127 0% 261 0% 626 1% 1,557 1% 418 1% 608 1% 577 1% Amortization of acquired intangibles 130 0% 224 0% 359 0% 118 0% 70 0% 18 0% 13 0% 13 0% Non-GAAP gross profit 17,498 61% 36,262 70% 50,750 65% 81,540 70% 135,647 75% 45,425 77% 50,400 78% 55,367 78% Operating Expenses Research and development 10,031 35% 10,585 21% 15,018 19% 25,638 22% 32,457 18% 9,804 17% 11,278 17% 12,100 17% Stock-based compensation (2,341) -8% (739) -1% (691) -1% (6,190) -5% (6,327) -3% (1,758) -3% (2,272) -3% (2,341) -3% Amortization of acquired intangibles - 0% - 0% - 0% - 0% - 0% - 0% - 0% - 0% Non-GAAP research and development 7,690 27% 9,846 19% 14,327 18% 19,448 17% 26,130 14% 8,046 14% 9,006 14% 9,759 14% Sales and marketing 24,088 84% 34,949 68% 53,158 68% 78,809 68% 112,629 62% 35,198 60% 39,140 60% 41,193 58% Stock-based compensation (647) -2% (691) -1% (1,194) -2% (5,596) -5% (7,658) -4% (2,427) -4% (3,469) -5% (3,473) -5% Amortization of acquired intangibles - 0% - 0% - 0% (20) 0% (26) 0% (6) 0% (7) 0% (7) 0% Non-GAAP sales and marketing 23,441 82% 34,258 66% 51,964 67% 73,193 63% 104,945 58% 32,765 56% 35,664 55% 37,713 53% General and administrative 7,517 26% 9,117 18% 16,204 21% 24,958 22% 35,408 19% 9,848 17% 10,391 16% 11,435 16% Stock-based compensation (1,484) -5% (958) -2% (1,318) -2% (3,946) -3% (5,766) -3% (1,628) -3% (2,126) -3% (2,304) -3% Amortization of acquired intangibles - 0% - 0% - 0% - 0% - 0% - 0% - 0% - 0% Non-GAAP general and administrative 6,033 21% 8,159 16% 14,886 19% 21,012 18% 29,642 16% 8,220 14% 8,265 13% 9,131 13% Loss from Operations Loss from operations (24,415) -86% (18,740) -36% (34,250) -44% (48,609) -42% (46,474) -26% (9,861) -17% (11,030) -17% (9,951) -14% Stock-based compensation 4,619 16% 2,515 5% 3,464 4% 16,358 14% 21,308 12% 6,231 11% 8,475 13% 8,695 12% Amortization of acquired intangibles 130 0% 224 0% 359 0% 138 0% 96 0% 24 0% 20 0% 20 0% Non-GAAP loss from operations (19,666) -69% (16,001) -31% (30,427) -39% (32,113) -28% (25,070) -14% (3,606) -6% (2,535) -4% (1,236) -2% 2015 Three Months Ended June 30, 2016 Three Months Ended September 30, 20162014 Year ended December 31, 2011 2012 2013 Three Months Ended March 31, 2016