SlideShare a Scribd company logo
1 of 40
Download to read offline
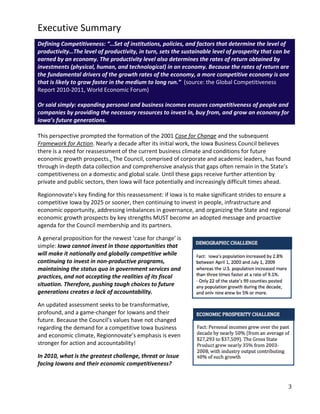
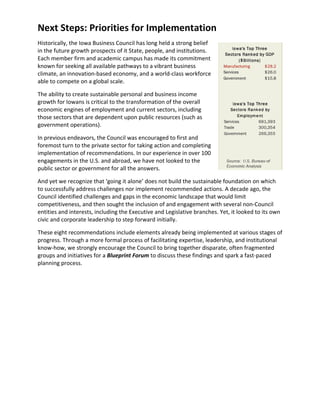
Winter
                                                                   10


 A Competitiveness Blueprint:
 Iowa 2025
Assessing Iowa’s Historical, Current, and Future Economic
Prosperity and Growth Through Benchmarking, Trends Analysis,
and Fact-Based Scenario Setting


                            A Report to
Table of Contents


Executive Summary                               3


Looking Back                                    7


A Renewed Sense of Urgency                      9


Where Iowa Currently Stands                     12


Competitive Advantages & Clusters               17


Goals and Recommendations                       23


Next Steps and Priorities                       26


End Notes and Referenced Materials              28


Draft Competitiveness Indicators                30


                                                     2
Executive Summary
Defining Competitiveness: “…Set of institutions, policies, and factors that determine the level of
productivity…The level of productivity, in turn, sets the sustainable level of prosperity that can be
earned by an economy. The productivity level also determines the rates of return obtained by
investments (physical, human, and technological) in an economy. Because the rates of return are
the fundamental drivers of the growth rates of the economy, a more competitive economy is one
that is likely to grow faster in the medium to long run.” (source: the Global Competitiveness
Report 2010-2011, World Economic Forum)

Or said simply: expanding personal and business incomes ensures competitiveness of people and
companies by providing the necessary resources to invest in, buy from, and grow an economy for
Iowa’s future generations.

This perspective prompted the formation of the 2001 Case for Change and the subsequent
Framework for Action. Nearly a decade after its initial work, the Iowa Business Council believes
there is a need for reassessment of the current business climate and conditions for future
economic growth prospects.. The Council, comprised of corporate and academic leaders, has found
through in-depth data collection and comprehensive analysis that gaps often remain in the State’s
competitiveness on a domestic and global scale. Until these gaps receive further attention by
private and public sectors, then Iowa will face potentially and increasingly difficult times ahead.

Regionnovate’s key finding for this reassessment: if Iowa is to make significant strides to ensure a
competitive Iowa by 2025 or sooner, then continuing to invest in people, infrastructure and
economic opportunity, addressing imbalances in governance, and organizing the State and regional
economic growth prospects by key strengths MUST become an adopted message and proactive
agenda for the Council membership and its partners.

A general proposition for the newest ‘case for change’ is
simple: Iowa cannot invest in those opportunities that
will make it nationally and globally competitive while
continuing to invest in non-productive programs,
maintaining the status quo in government services and
practices, and not accepting the realities of its fiscal
situation. Therefore, pushing tough choices to future
generations creates a lack of accountability.

An updated assessment seeks to be transformative,
profound, and a game-changer for Iowans and their
future. Because the Council’s values have not changed
regarding the demand for a competitive Iowa business
and economic climate, Regionnovate’s emphasis is even
stronger for action and accountability!

In 2010, what is the greatest challenge, threat or issue
facing Iowans and their economic competitiveness?


                                                                                                    3
The answer: ensuring opportunities for growth of their incomes, based on the strength of their
skills, access to critical infrastructure, a sustainable quality of life, and a hospitable climate for
businesses to flourish. However, on-going issues in education, workforce, economic development,
and governance of citizen resources challenge these aspirations

To address these barriers and opportunities, Regionnovate proposes a Blueprint for Iowa 2025.
We encourage, through the Iowa Business Council’s long-standing mission, to advocate for Iowa’s
economic competitiveness by reducing barriers and limitations, as well as leveraging the State’s
unique assets. In the past, through public discourse and debate, the Council has sought to catalyze
solutions for Iowans and their future prosperity. This Blueprint for Iowa 2025 continues these
traditions and values that the Council has advanced over the years.

Our Assignment and Task: The Underpinnings of The Blueprint
Regionnovate LLC was retained by the Iowa Business Council and worked with the Deputies
Committee over the past nine months to define critical elements for assessing the historical,
current, and future economic prospects. Based on the work conducted by Richard Seline nearly a
decade ago for the Council in its
endeavors on the Case for
Change, Framework for Action,
and the CEO Summit at the
University of Northern Iowa, the
Deputies sought an external,
neutral third-party review of
Iowa’s current and future
                                        2001 Framework for Action: Facilitation Guide (Achieving Results)
business climate for growth.

Our methodology included:

    •   Capture and assessment of all previous reports on Iowa’s economic, demographic, fiscal,
        policy-related, and regional industry sector investments, programs, and initiatives, including
        determination of progress based on recommendations from each report

    •   Capture and assessment of best practices, benchmarked programs, and competitor state
        approaches to economic development, fiscal and financial policies, and general business
        climate initiatives

    •   High level analysis of Iowa’s current industry clusters as well as growth-oriented innovation
        strategies in support of new product, service and intellectual property development across
        academic and corporate interests

    •   Identification of alternative economic prosperity scenarios for Iowa based on current and
        emerging trends and forecasts, thereby informing a SWOT (strengths-weaknesses-
        opportunities-threat) assessment of competitive advantages as well as barriers, limitations,
        and challenges


                                                                                                            4
•   On-going communications with the Deputies and a small working group of the CEOs from
       the Council so as to gain vital insights, subject matter expertise on the ground in Iowa, and
       leadership expectations for advancing recommendations

Driving Iowa Forward: Purpose of the Blueprint
“ The purpose of evaluating Iowa’s competitive posture is to re-visit questions posed in 2001 and
from similar efforts, update progress in those areas of concern, and introduce any new issues that
warrant immediate consideration. The desired outcome is to offer a blue print for policymakers
that identifies those economic and workforce development challenges the State needs to address
now. And to identify initiatives and projects that IBC would consider to implement, catalyze,
and/or encourage alignment of existing endeavors.” (Charge to the Deputies & Regionnovate)

The Iowa Business Council has continued to support several initiatives that mitigate identified
weaknesses or leverage competitive advantages in pursuit of excellence in commerce, workforce
development, and education. It is imperative for Iowa to proactively address issues that promote a
strong, vigorous, and welcoming business climate while developing a skilled and diverse workforce.
Therefore, in the Council’s long tradition of stimulating and advocating public discussion on the
State’s economic growth and competitiveness, Regionnovate has conducted an updated Case for
Change 2001 through a Blueprint for Iowa 2025.

Focus of the Blueprint:
Regionnovate’s fact-finding and analysis was guided by the identification of answers to the
following two Critical Questions on Iowa’s Future, leading to prioritized recommendations for
action:

What must be done now to maintain positive growth trends in Iowa five, ten, twenty years down
the road? And how do concerned and engaged Iowans, make sure their state’s economy
continues to compete and thrive in the national and global marketplace?

The Blueprint for Iowa 2025 seeks to focus attention on a set of opportunities, challenges and the
necessary recommended actions that acknowledge where Iowa has been, where it is currently, and
where it must given attention in the future to be a competitive economic engine for all Iowans.

As highlighted to the right, ‘Challenge’ boxes are
included throughout the Blueprint so as to call
attention to the underlying facts for discussion and
debate. Simply, the facts speak for themselves –
and provide vital insight to addressing these
questions consistently and objectively.

Regionnovate has proposed and drafted an initial
Competitiveness Index (or the makings of a
scorecard) that identifies certain indicators – based on over 700 metrics found globally - deemed to
be significant and determinative in gauging an economy’s progress, identifying areas that need
attention or reassessment, and a means of celebrating successful implementation. We have


                                                                                                       5
provided draft recommendations for the Council’s consideration and eventual decision on where to
place its resources (time, reputation, monies, and thought-leadership).

One critical and overarching recommendation for Council consideration is to host, through its long-
standing role as a convener and facilitator, a Blueprint Forum on Iowa 2025 to discuss and
prioritize the findings, goals, recommendations and possible performance measures suggested
through this assessment.

The current initiatives, roundtables, working groups, and advisory councils examining options and
implementing solutions on any number of challenges has not been convened on a statewide basis;
if efficient use of time and resources are to be allotted to resolving Iowa’s weaknesses and
exploiting its advantages, now is the time to bring together several common threads for
concurrence on goals, objectives, and most importantly accountability for implementation through
agreement on the indicators and metrics requiring attention. The following sample inventory of
initiatives and programs include Council representation and resources invested from corporate
sponsorship and individual philanthropic gifts.


We further recognize that there are several important and significant initiatives and projects
underway at the local levels throughout Iowa; with the adoption of a regional approach as
described in following sections, there is an opportunity to connect the entire range of interests and
participants across the State into a more strategic discussion about assets, investments, and
outcomes.


                                                                                                    6
Looking Back on The Case for Change in 2001
In 2001, the Council completed a significant agenda around the ‘Case for Change’ suggesting that unique
challenges and opportunities existed in public and private sectors that could limit or propel the economy
and climate for competitiveness. As noted, the 2001 agenda sought to identify only a handful of actions for
which the Council – the business community, academic leadership and partners – could effectively
champion and implement.

The initial Case for Change provided a fact-based assessment of Iowa’s economic situation in light of
comparison with other states and communities. It recognized where strengths created an advantage and
where shortcomings could eventually have a negative impact on job-formation and expansion of company
growth. Over the course of six months, culminating in a half-day forum with nearly 70 leaders from across
the State, a Framework for Action was developed around five specific challenges on which small working
groups or Action Teams shaped implementation plans and initiatives. Appropriately the Council sought to
engage the best minds in the public and private sectors to define solutions, many of which continue to have
an impact on and benefit the State’s economic competitiveness.


The immediate effect of the Framework was the role of the Council as a catalyst for results-oriented goals.
The secondary recommendations and potential goals emerged over the decade with additional results. The
so-called ‘ripple effect’ has included a broader agenda in areas of government efficiency using private

                                                                                                          7
sector practices, improved education results for current and future generations, and betterment of
employees and citizens lives through a focus on life sciences, health-care, and wellness.
Lessons Learned from Prior Efforts
The Council seeks to examine results from and the
possible renewal of the successful process from the
2001-2002 Case for Change and the Framework for
Action by assessing both progress and continued
threats to Iowa’s relative growth. What
Regionnovate has determined - though the ‘needle’
has moved a bit - is that certain issues have only
worsened since our last review nearly ten years ago
(e.g. college graduation rates and educational fulfillment is a key example).

At the same time, we must encourage the continuation – and even the expansion – of successful
initiatives and programs begun over the past decade; Council members and partners have
expended time and energies year after year – and now is not the time to neither diminish nor
                                         divert attention. If anything, a renewed sense of urgency
                                         has been outlined on the following pages that should
                                         cause the Council to re-engage previous patterns of
                                         convening, convincing, and connecting with others of like
                                         mind about the State’s lack of or unique advantages in
                                         competitiveness for growth.


                                                                                                 8
A New Sense of Urgency for the Next Decade
Through the lens of external rankings and internal indicators, the underlying data speak for a new
sense of urgency – and a renewed commitment to focus attention, resources, and leadership from
all Iowa sectors to ensure national and global competitiveness in light of numerous unfolding
scenarios. For instance, Iowans have long known that many of communities are declining in
population while other U.S. and international cities and regions are expanding and accelerating
through industry clusters, retention of students and entrepreneurs, spin-offs, and corporate
market-share growth.

However we have identified the ‘Iowa quandary’ – on one hand specific Iowa communities are
recognized in popular rankings for successfully chartering economic growth through the past
decade and the recent recession, and on the other hand some rankings suggest that Iowa has a
negative business tax climate, is difficult for doing business, and may have other fiscal and financial
clouds on the horizon. These competing rankings and perspectives suggest that the Council must
view the sense of urgency based on the facts, not perceptions nor external rankings. Through an
index or scorecard, only Iowans can frame what matters most to Iowans!

Our analysis and findings suggest that the sense of urgency facing Iowans in 2010-11 includes:

State and local expenditures for debt and fiscal challenges outstrips resources needed for new
investments, more focused allocations and investments in
activities that would produce growth. Since several Iowa
locations have had negative population growth year on year,
and as populations have shrunk, so have the revenues of
these jurisdictions. The use of bonds and other debt financing
has put a number of government institutions in a precarious
position as these locations show limited signs of re-
generating their taxable revenue base unless new strategies
are adopted for attracting additional industries, sectors,
and/or value-added processes.

Over the past decade, a majority of federal expenditures in Iowa have increasingly become transfer
related payments in social services and health benefits, not for growth oriented activities that build
                                        incomes, enhance assets and infrastructure for attracting
                                        companies and investors to the State, nor expand capital
                                        necessary for entrepreneurs and businesses. These
                                        imbalances in allocated resources limit vital investments for
                                        supporting and expanding Iowa’s clusters and innovative
                                        capacities.

                                        Since the Knowledge Economy is centered on educational
prowess, research facilities and equipment, and the resulting commercialization process, the
retention of students and in turn innovators resulting from the academic setting has moderately
increased but not kept pace with national trends. We have found in benchmarking other states and
regions that industry sponsored research, targeted federal grants and contracts, and leveraged
philanthropic investments in Iowa’s higher education is at a critical point for maintaining a

                                                                                                      9
competitive advantage. While some states have created unique initiatives to connect the academic
campuses to industry, entrepreneur, and innovation-based economic development, Iowa is only
just now examining this course of action.

Iowa’s population gap and lack of diversity has become a detriment to the future workforce supply
forecast of demand as well as overall business planning that require a constant access to a steady
pool of skills, including top science, technical talent. In reviewing many of the Council’s member
websites and communications tools, ‘diversity’ has
been an adopted corporate mission, and yet there is
no clear public sector strategy to address this
unique and critical challenge

Finally the two-year old recession, and in turn the
current recovery, is causing consolidation and
retrenchment of firms from abroad as well as within
the United States. A number of corporations are re-
examining where to concentrate their operations
and centralize their manufacturing processes.
Therefore whether Iowa is a choice location is up for grabs.

We believe that these and similar challenges have sparked renewed urgency for the Council’s
attention and response, as well as engagement with partners throughout the State viewing the
urgency with the same concern.

Change Will Continue To Impact Iowa: Highlighting Trends and Forecasts
A decade ago, the Council’s Case for Change suggested ‘change’ is a constant that Iowans must
accept and embrace rather than fear. Today’s uncertainty in private and public revenue generation
requires attention to leveraging resources and efficiencies in times of a permanent economic and
society ‘turbulence’; therefore aligning growth prospects with a stable and sustainable business
climate is critical.

                                          While Iowa have made strides in adopting and
                                          implementing industry cluster development, the best
                                          minds and brains do not have to be located in Iowa to
                                          ‘win’ economically nor professionally; therefore Iowa
                                          must consider a talent ‘development and recruitment’
                                          strategy as key to global competitiveness.

                                          Because of ‘disruptive’ technological and manufacturing
                                          advancements, Iowa’s industries and sectors will require
greater differentiation of markets and services in the future to maintain competitiveness; therefore
increasing global networks and regional relationships among Iowans is vital to move ideas,
products, and solutions into Iowa’s companies, communities, and institutions.

Thus, coordinated actions among sectors, institutions, organizations, and government necessitate
stronger, sustainable partnerships for the public and private sector; therefore data collection,

                                                                                                 10
analysis, and knowledge sharing is paramount to anticipating scenarios rather than reacting to
circumstances. Removing barriers and ending stovepipes – especially across departments,
agencies, and programs as well as with the private sector – is now critical.

The evolution in the mindset that the Iowa Business Council sparked nearly a decade ago requires a
recommitment to ‘change’ for purposes of maintaining good work towards and to fine-tuning the
delivery of economic, workforce, research, commercialization, and innovation capacity among
institutions, industries, investors, and innovators. Those states and regions that have progressed in
the evolution of their economic strategies did so based on the civic, business, and academic
leadership driving an agenda on specific steps and initiatives, and of course performance and
accountability for results.


Constantly monitoring the economic landscape and consistently modifying plans as appropriate to
meet and exceed competitor states and nations is no longer an option for Iowa. In light of the on-
going economic turbulence facing the Nation and in turn Iowa, reassessing how the near-term
economic development infrastructure, strategies, policies, and operations meet the test of the
global competitive marketplace is now vital to successfully implementing the Blueprint’s goals and
recommendations.


                                                                                                  11
Where Iowa Currently Stands: A Frank Overview of
Today’s Iowa
We recognize and honor Iowa’s agricultural
heritage and strength, but to assure its long-term
prosperity and impact it must continue to adapt
through value-added innovation, thereby serving
the health, well-being, energy needs of Iowa
citizens and the Nation as a whole. The State is
fortunate that agriculture has provided some
stability during this most recent recession, but
overall it cannot solely rely on a commodity
product-base in a highly competitive global marketplace.

Another Iowa quandary is the State’s very young versus aging population – polar extremes –
coupled with a lack of diversity that limits the future supply of the workforce, while in turn tapping
public services at an alarming rate. This convergence of population and demographic challenges
has increased demand on government resources and services, and therefore significantly impacted
demands for new revenue generation. And reliance upon federal offsets can no longer be counted
in the State’s fiscal scenario.

                                                In turn, Iowa’s highly regarded work ethic,
                                                nationally-recognized training programs, and on-
                                                going commitment to skills development could be
                                                diminished by ending or reducing resources for
                                                continuous improvement of employees and the
                                                next generation of the workforce.

The emergence of highly concentrated commercial
centers and urban cores while maintaining
continuity of services, programs and investments in
rural communities has reached an imbalance that
necessitates a more cooperative regional approach
and delivery. Iowa is late to the game as contrasted
with other states that have adopted their own
responses, while at the same time the federal government has increasingly focused on large-scale
resource distribution through regionalism. Regionalism is not the ending of county government or
changing political jurisdictions; however it is the recognition that boundaries are artificial to the
movement of goods, people, ideas, and transactions that rely on assets found in proximity to each
other.

When assessing Iowa’s capacity to commercialize and innovate from its inherent knowledge and
know-how, we are concerned with the limited utilization of the academic asset-base. The unique
academic and corporate research and development of ideas, products, services needing access to
more global markets and investors has not been addressed in a more aggressive strategy by state

                                                                                                   12
and local economic development interests. The world comes to Iowa to participate in the Food
Prize programs and events, and yet in turn there is little evidence of a more organized outreach to
the world to promote Iowa’s economic and technological capabilities and knowledge. Iowa’s
corporate base of domestic and international networks are an advantage that has not been tapped
to its fullest.

                                           Finally, over the past decade, Iowans have sought to
                                           organize, plan, and create solutions to several threats to
                                           their economic prosperity through increased civic
                                           engagement and public-private partnerships. However, in
                                           their exuberance to address past and current challenges,
                                           the State has become fragmented with many agendas,
                                           missions, and ultimately competing goals. Such
                                           fragmentation has often led to miscommunications or lack
of clarity about the end-point for the vital work and investment in long-term recommendations.

Simply, the metrics and accountability for results may have become lost in the ‘doing’ – and
therefore a review of progress and assessing tactics is necessary to achieve even greater success.
Since several Council members are often called upon to lead, drive, invest, and sponsor the work of
these various agendas, the Council could be a convening body for assessing the ‘doing’ with the
results and outcomes.

A Situational Analysis of Iowa’s Current Landscape and Economic Scenario
Based on our analysis and assessment, we prioritized the key themes requiring on-going attention
and measurement. In hindsight, the issues and
challenges raised ten years ago led to ambitious and
transformational actions. Ten years later, the
‘fundamentals’ still remain as unfinished business; for
too long structural, operational, and economical
impediments have Iowa placed as ‘stuck in the
middle’ and with only incremental progress.

To be sure, there is a resiliency that has allowed Iowa
to not falter as significantly as others. Real estate,
housing, financial, and retail sectors have seen better days, but have not plummeted, as is the case
in Michigan, Wisconsin, and Illinois. Iowa is blessed as has been noted with an agricultural sector
that is buoyed by global markets and new uses such as energy, organics, and consumer packaging.
And academic institutions have increased funding for research, facilities, and equipment that
allows them to attract competitive faculty and students to the State.

With these data-points as a baseline for the Council’s examination of the current and future
competitiveness environment, a set of metrics and indicators were presented and discussed with
the Deputies of the Council. We first sought to define where Iowa leads, competes, and/or lags as
contrasted with other states and nations.


                                                                                                  13
The challenge is to identify where Iowa must improve as well as sustain competitive scenarios. The
Council and its partners want to ensure that competitive advantages do not slip against external
forces of global competitors, new technologies and
disruptive innovations, nor missed opportunities to
attract or recruit participants in the supplier chains to
Iowa. Increasingly, there are red flags that have
emerged – warnings on the horizon about negative
trends for the fundamentals in Iowa’s fiscal, financial,
business, governmental, and organizational practices
and policies.

There is no replacement for assessing performance
and having the honest, frank conversation about challenges, gaps, and in some cases politically
                                       difficult crossroads. Through Council hosted and/or
                                       sponsored forums, there has been agreement in the past
                                       with concurrence on ‘highest common denominators’ on
                                       which to coordinate resources, thinking, and
                                       implementation tactics.

                                       For instance, the Council introduced and the State
                                       responded to the suggestion from the Framework for
                                       Action that a six-sigma approach to reviewing practices and
                                       policies within departments and agencies. The creation the

                                                                                                  14
LEAN Collaborative is a successful approach to public-
private partnership; by bringing the best practices of
business reorganization to the day-to-day planning and
budgeting of government services leverages knowledge
and real-world, tested expertise. We have found that
those states with competitiveness strategies continue and
even expand programs such as LEAN during times of
economic and fiscal turbulence.

We commend the Iowa public sector for the adoption of
LEAN, and encourage the use of a scorecard or
competitiveness index (as noted further in this report) as a continuation down the path of
coordination and collaboration among management and staff. To some degree, large organizations
often fail to remember the original service intent or even review their mission statement to ensure
successful implementation. If the indicators and performance are not improving, then continuing to
do the same thing over and over again deserves to be questioned.

Due to the budget and financial challenges at the regional, county, and local levels, adoption of
similar metrics of performance as well as the role of the LEAN Collaborative throughout the State is
encouraged. Several states have formed similar endeavors recently – Indiana, Virginia, Colorado to
name a few but none are as sophisticated as Iowa’s LEAN initiative!

By way of example of an expanded scenario for LEAN-type activities, Iowa State University in its
recent reorganization of extension programs will more efficiently and effectively deliver services
across multiple counties. These bold moves to address improving service delivery while maintaining
a handle on budgets and expenditures during fiscal challenges must become the norm for Iowans.

In our benchmarking exercise of best practices, the emergence of regionalism is another ‘norm’
appearing throughout the Nation. Defined as a seamless geography whereby economic activities,
transactions, people, and resources flow easily across borders and boundaries, the federal
government views regions as a preferred mechanism for delivering grants and contracts. Over the
past four years of two different White House Administrations, a number of national competitions
have been held that
require ‘regional’
responses (surrounding
commercial centers) to
large-scale funding of
workforce, scientific,
infrastructure, housing,
and economic
development initiatives. It
is expected that Congress
will continue to support
consolidation of programs
by regions.


                                                                                                 15
The current perspective of ‘regionalism’ affords
multiple counties and communities to leverage each
other’s assets, institutions, infrastructure, talent
pool, and operations to the mutual benefit of
citizens and companies alike. Increasingly, federal
agencies and programs are encouraging
combinations of grants and delivery among
transportation, infrastructure, housing, and
economic development.


                                                       16
From Clusters of Industry to Clusters of Knowledge: Iowa’s
Competitive Advantages
Ten years ago, the Council encouraged state and academic partners to adopt an industry cluster
model based on the work of Harvard University’s Michael Porter and team that had examined
robust economies around the United States. Currently the Financial Sector Cluster in Iowa has
successfully attracted and built a value-chain of companies, suppliers, and talent to serve the needs
of the national consumer and commercial insurance sector. Obviously the agricultural sector has
continued to evolve its cluster profile, while the life sciences and biotech industry has slowly
emerged to a lesser degree.

Clusters, using the Harvard model,
are aggregations of employment
and wage concentrations within
certain geography. The formation
of clusters assumes that some
elements of the economic
outcomes will stay local while a
majority of the goods and services
are exported. Advanced
Manufacturing tends to serve the
needs of national and global
markets – and as such sees
increased value from accessing new
markets in China, South America,
and Europe. Therefore, a thriving
and competitive cluster is marked
by the increasing and sustainable market-share derived from exporting beyond the local
geography. This is one factor for re-examining Iowa’s approach to economic development: we want
to know what percentage of national and global market-share should be captured in Iowa’s clusters
as a result of a healthy, competitive business climate.

                                               However, over the past few years, we have
                                               assessed cluster development at a level that
                                               focuses on occupations, skills, and competencies
                                               since industries have begun to converge through
                                               crossover technologies, crafts, and production. For
                                               instance, in benchmarking Iowa’s agriculture
                                               cluster, we examined the Northwest U.S.
                                               (Washington State, Oregon, Idaho, Northern
                                               California) and the Upstate New York clusters. In
                                               both instances we found skills once only identified
in one cluster were now ensuring competitiveness in other sectors (e.g. Rochester’s skills in optics
and imaging were now being used in food inspection, food security).


                                                                                                  17
In some locations, expertise in chemical manufacturing and production are now directly benefiting
pharmaceutical and biologic developments. Historically the importance of rum and whiskey
fermentation and production directly resulted in future clusters in Puerto Rico and Ireland for their
global pharmaceutical economies. More recently, Southern California and Denver’s strengths in
aerospace (and advanced materials) have directly attributed to design and manufacturing in solar
and wind alternative energy clusters. Greater Kansas City and to some degree the State of Kansas
as a whole hosts nearly 40% of the global market-share in animal research, testing and product
development that led to the attraction of a recent $500mm federal laboratory and the recruitment
of several global corporate expansions.

Therefore, Iowa must
                                  Underpinnings of Regional Competitive Knowledge Models
consider broadening its
focus on clusters to include
                                                                                                                  KNOW WHAT: Tacit existing
linking critical elements of                                                                                      and emerging formal
                                                                                                                  education, understanding, and
‘know-what, know-how,                                                      KNOW
                                                                                          KNOW
                                                                                          WHAT                    experiential learning
and know-whom’ that
                                                                           WHOM
                                 KNOW WHOM: Networks of
                                 relationships in and beyond the
emerge from an integrated,       region; sometimes informal quick-
                                                                                        KNOW
                                                                                         HOW
                                 paced arrangements, sometimes                                                KNOW HOW: Application of tacit knowledge
multi-disciplinary and           formal partnerships of distinct                                              that combines existing approaches AND
networked economy. The           capabilities and teams of know
                                 what and how combined
                                                                                                              most importantly new innovations to address
                                                                                                              emerging challenges, solutions, and markets
successful adoption of
Industry Clusters based on                        Innovation Intermediaries:
the Council’s work a decade                           - Link competencies, weave capabilities
                                                      - Align threads of target economic opportunities
ago requires a more in-                               - Strengthen, hasten collaborations
depth assessment and                                  - Build towards critical mass of people, expertise, resources, market
                                                        builders
upgrading of economic                                 - Gauge absorption of demand by regional eco-system
                                                      - Create and promote performance metrics, connectivity, and results
strategic planning. The
implications for Iowa’s
future economic                 Source: New Economy Strategies, LLC

development delivery are:

   •   Greater coordination between the State’s workforce, higher education, economic
       development and transportation leadership, management, and strategic planning efforts in
       an executive branch-driven office similar to an ‘Iowa Jobs Cabinet’

   •   Interactions between business and academic human resource demands and the supply-
       chains for certifications, degrees, skills upgrade, and similar progress in a workforce
       continuum of activities and investments

   •   Increased focus on recruitment and retention of students, faculty, researchers, technical
       talent, and a diverse workforce that is benchmarked against global standards of
       competency

   •   Formation of networks across the State’s regional assets, institutions, and business/industry
       interests to monitor on-going resource requirements and investments based on knowledge
       accumulation – and then where knowledge can be applied towards new markets and
       opportunities from scientific, technological, engineering, and manufacturing expertise.


                                                                                                                                                    18
Based on our review of current investments by academic, government and corporate Iowan
interests against the backdrop of global trends and forecasts, we have identified five unique
Clusters of Knowledge for consideration:

   1. Advanced Niche Manufacturing: Industrial Design and Production of Products of ‘One -
      specialized customer demanded products will increasingly be produced in small batches
      through digital design, and manufactured in ‘clean factory shop-floors’ that connect to 24x7
      distribution and logistics systems. At the same time, as existing product generations pass
      warranty stages and manufacturers no longer support repairs, specialized global inventories
      will seek niche manufacturers.

   2. Bioenergy, Wind, and Other
      Alternative Forms Applied to
      Public and Private Sector
      Infrastructure and Spaces – from
      LEED certified facilities and smart
      grids, the opportunity to produce
      an array of energy from localized
      sources will create co-generation
      scenarios at or adjacent to end-
      user spaces (manufacturing,
      production, housing, hospitality,
      waste and sewage plants, etc.),
      thereby shaping the role of
      energy in the economy and
      society.

   3. Medical Devices in Response to Aging and Human Revitalization (Nutrition, Neural Sciences,
      Motion) – as goes the rural aging scenario of Iowa so goes the larger ‘baby-boomer’
      population facing increased threat of stroke, Alzheimer’s, and other related brain-function
      diseases that can be addressed through innovations in medical devices. Using Iowa’s
      strengths in manufacturing, addressing the demands for prevention and wellness, and
      linking clinical trials to unique populations, there are several scenarios for turning the State
      into a national node of scientific devices for human revitalization.

   4. Information-Engineering: Analytics, Artificial Intelligence, Robotics – the infusion of smart
      technologies into operations and maintenance of major corporate divisions and product
      development teams has been matched by the advances in information architecture and
      engineering. High through put computing, cloud storage, and just-in-time inventory are
      finding near-term demands for cost reduction and efficiency in a globally competitive
      marketplace whereby foreign imports and products constantly threaten the U.S. Coupling
      information-engineering with logistics and distribution strengthens the opportunities in
      advanced niche manufacturing and specific markets in alternative energy and medical
      devices.

   5. 21st Century Global Consumers: Connecting Market Intelligence and Digital Technologies
      with Every-Day Challenges and New Delivery Systems - the on-going demand for


                                                                                                      19
information has increased the need for more relevant use of “tools” that improve the
       outcomes from newly acquired knowledge and its application to every-day activities such as
       government regulation and fee payments, entrepreneurs and procurement by public and
       private sector buyers, commuters and transportation systems, teacher- student curricula
       and content development to name a few examples. These scenarios are not new; yet
       mobile/wireless platforms are changing the delivery and speed of adoption. And the
       adoption of such tools responds to demands for greater efficiency at lower costs to the
       consumer, patient, taxpayer, and/or citizen alike.


These five unique Iowa clusters
of knowledge leverage existing
skills and investments, but also
require a purposeful decision by
the economic and workforce
‘communities of interest’ to
determine if and how the State
will compete in the years
ahead. As an example, the
State of Alabama determined
that its core economic
‘competency’ (know-how) was
Modeling and Simulation
Technologies, impacting four
traditional clusters of activity
across private and public sector investments. By acknowledging its core competencies, states and
regions build the communications and global ‘brand.’

If Iowa is to be a ‘go-to-location for future expansion or even consolidation of industry investment,
there must be a sense of understanding and promoting its core competencies – the unique Iowan
competitive advantage. While the Council is not nor should be seeking to choose where resources
are applied by others, it could assist in shaping economic competitiveness by linking internal
corporate market intelligence, long-range planning, and needs for labor and infrastructure with
these trends and forecasts. Competitor states and nations have not picked ‘winners and losers,’ but
have determined where the best returns on investment will result from targeted resource
allocation by linking competencies, knowledge of markets, and product and service development to
a stable business climate.

Our guidance based on best practices in the U.S. is to seek greater alliance between skills,
competencies, and talent development with growth industries, sectors, clusters, and global
competitiveness.


                                                                                                  20
Goals and Recommendations: Addressing Challenges Through
Benchmarking and Best Practices
Upon identifying where Iowa could compete (or at least participate in the global competitive economy
through trends and forecasts that lead to the five Targets of Opportunity), Regionnovate conducted a set of
scenario-setting exercises with the Deputies Working Group of the Council. We in turn conducted
benchmarking of comparative market development and best practices from around the Nation, leading to a
number of options examined and external rankings discussed so as to prioritize where time, resources, and
the State’s business, academic and public leadership could have best results around no more than five
goals.


Based on competitor states and regions across the U.S. and a handful abroad, the following goals were
encouraged for further debate and discussion over the months ahead. These goals could be the subject of
an Iowa Blueprint (and Competitiveness) Forum and the work of Action Teams responding to the need for
more alignment and coordination among interests.

Goal No. 1 – Go To Location for Business Relocation, Expansion, Consolidation and Innovative Startups
Critical because Iowa must expand its business engines for employment and investment by communicating
and branding the State as a location of choice

Potential Tactics: Targeted Sector Value Chain Recruitment; Leverage Clusters of Knowledge across
Interdisciplinary Capabilities of Industry and University; Incentivize Early-Stage Capital Formation for
Investment in New Products and Ideas– all new ways of approaching economic rebuilding and sustainability

What is Required: Encouraging the Governor-elect to transform state and regional economic development
strategies and tactics by assessing the current State delivery of economic development while at the same
time exploiting the work of the private and academic sectors in the Iowa Innovation Council’s vital efforts
to date

Goal No. 2 – Globally Competitive Regionally focused Commercial Centers or Hubs of Economic Activity
Critical because concentrations of economic productivity are increasingly organized by regions not by
individual counties nor cities

Potential Tactics: Create Regional Centers of Innovation and Competitiveness that combine all of Iowa’s
counties and communities into seamless regional operating models


Institutions, Industry Councils, and regional workforce and service delivery representatives to define21
What is Required: Coordination of Executive and Legislative Branch with Chambers of Commerce, Academic

proximate demands and needs into more efficient operating models
Goal No. 3 – A Diverse Workforce and Population with Global Industry Readiness as its Core
Critical because the more diverse a workforce and population, the more productive the outcomes,
relationships, and networks:

How We Could Get There: Recruitment for Global Excellence; Build Partnerships with Targeted
Population Home Countries; Increase Foreign Language Requirements;

What is Required: Linking the State’s workforce, economic, and education agency data and program
planning units in an Iowa Jobs Cabinet

Goal No. 4 – Highly Regarded Efficiency in the Delivery of Government Administration, Services,
Operations, Facilities, and Information
Critical because excessive government employment and spending on non-productive delivery waste
precious resources, limits innovation, and ultimately devalues entrepreneurial behavior

How We Could Get There: Adopt Regional Planning and Shared Service Program Competitions for Public
and Private Sector Partnerships

What is Required: formalize the Iowa LEAN Collaborative to include county and local governments
through a Commission structure that holds annual competitions in key elements of governance, thereby
receiving support through technical assistance and program resources towards long-term
implementation from savings.

Goal No. 5 – A National Leader in Pre K-20 Education and Training – Focusing on Youth and Student
Competitiveness
Critical because Iowa’s slow slide in critical STEM scores and graduation rates for college foretell an
emerging gap in meeting the future demands for talent and workforce

How We Could Get There: Form the Iowa Skills Continuum among Education, Workforce, and Economic
Development Agencies, Programs and Service Providers with a special emphasis on mentoring, tutoring,
interning, and launching of capabilities, ideas, and knowledge

What is Required: Leverage the Iowa Business-Education Roundtable’s existing framework, as well as the
current efforts the EPSCOR and STEM coalitions across the State

______________________________________
With these goals as milestones along the road to a competitive Iowa, the following recommendations for
large-scale actions (or Big Ideas) could transform the economic competitive landscape for this and future
generations of Iowans. By then linking these recommendations with specific Implementation Plans
through the Action Teams as well as a report card, or competitiveness index, we believe the Council will
have catalyzed breakthroughs in a number of challenges already identified throughout the Blueprint.

On the next three pages, we have outlined several critical challenges facing Iowa, made initial
recommendations for consideration, and in turn have provided best practices from benchmarked states
and regions. These are starting points for consideration by the Council’s membership and affiliated
partners, institutions, and organizations.


                                                                                                          22
Current Challenge                               Recommendation                                         Benchmark Case Study

Education: the ability of Iowa              Unite under a statewide banner on Pre-K through 20     “Oregon Business Education Compact’ seeks to connect
businesses to succeed in the                by formalizing the Iowa Business-Education             classroom and workforce with hands-on innovative
competitive world marketplace depends       Roundtable in partnership with the Governor and        learning experiences for students and teachers, while
on the constant upgrade of skills and       Legislature                                            creating and leading working partnerships with business
                                                                                                   and education, as well as advocating for quality education
knowledge of its workforce
                                                                                                   in the State.

Health and Well-Being: a primary            Explore a more formal Employer-Employee Health         Healthier WY’ is a statewide wellness campaign in its third
indicator of the well-being of a state is   and Wellness Campaign by supporting the work and       year focused on incentivizing members of the State
the health of its people by diminishing     implementation of the Iowa Wellness Council and        Employee/Retirement funds along with similar
impacts from disease, illness, and long-    the Health Care Collaborative                          government employees at the local levels to participate in
                                                                                                   discounts, rewards, contests, and online tools for
term care effecting productivity and
                                                                                                   reducing a nearly 300% jump in health care costs for
costs
                                                                                                   public employees. Arizona’s First Things First campaign
                                                                                                   focused on early childhood health and education through
                                                                                                   cross-system coordination of federal, state, local roles
                                                                                                   and responsibilities with a public metrics report due each
                                                                                                   year.

Tomorrow’s Workforce: A growing,            Re-emphasize the recruitment, attraction, and          Minneapolis-St.Paul has hosted for twenty-two years its
skilled, and culturally varied population   retention of a new generation of Iowans for securing   annual ‘Diversity and Inclusion Forum’ in partnership with
enhances Iowa’s business case for           a talent pool around stable careers and economic       national and state associations, and major corporate
growth and global competitiveness           opportunities                                          human resource and diversity officers in Minnesota. In
                                                                                                   turn, the Forum has sparked a statewide agency initiative
                                                                                                   for recruitment and attraction of diverse workforce
                                                                                                   talent.

Economic Growth & Opportunity: the          Review the current model of statewide economic         Texas, Kentucky, Pennsylvania, Ohio have adopted
collective input of industry and            development delivery and improved coordination         regional centers (“RCICs, Centers of Excellence, Ben
commerce along with the earning ability     and collaboration across agencies, programs,           Franklin Centers, Edison Centers, respectively) of
of the state’s workforce gauge Iowa’s       regional interests, and most importantly data          commercialization, innovation, and economic
                                            collection, business intelligence, and market          development by leveraging existing programs and
overall vitality
                                            competitiveness monitoring                             operational infrastructure through competitive grants and
                                                                                                   contracts aligned with specific metrics of performance.
Georgia, Utah, Arizona, and Washington State have
                                                                                                   created online databases of researchers, papers, patents,
                                           Catalyze, in conjunction with the Innovation Council,   innovations, and resources for new products and services.
                                           the Iowa ‘Community of Innovators and Global            New Zealand and Great Britain have sponsored, through
                                           Knowledge Network’ through a digital portal and         national economic development organizations and the
                                           resource toolkit by expanding the current IBC-          private sector global, networks of alumni, experienced
                                           sparked Entrepreneur Portal on the IDED website         executives from their respective countries, and over
                                                                                                   22,000 and 7,800 respectively profiles of interest in
                                                                                                   corporate and market opportunities.

Infrastructure: Investment in              Advocate for continuous improvement,                    North Carolina’s ‘Statewide Connectivity Strategy’ is a
transportation, energy, and                upgrade, and coordination of public sector              comprehensive technology infrastructure road map
technological infrastructure has far-      investment in Iowa’s infrastructure tied to             created by the Office of the Governor and Controller, the
reaching effects on Iowa’s economy,        commercial centers, industry sectors, academia,         university and community college systems, local
                                                                                                   government, and partnerships among local telephone and
competitiveness in the world               and growth-oriented opportunities
                                                                                                   IT providers. Georgia’s Statewide Energy Plan focuses on
marketplace, and the quality of life in
                                                                                                   energy reliability, supply-demand, education, incentives,
our communities                                                                                    and economic development with annual tracking and
                                                                                                   specific statewide and regional metrics.

Fiscal Policy: Promoting accountability,   Restore the IBC-inspired LEAN Enterprise Office         Indiana’s MySmartGov.org represents several years of
efficiency, and long-term stability in     within the Governor’s Department of                     work by the Commission for Local Government Reform
State and Local finances and budgeting     Management, and leverage the current Iowa               seeking among other objectives to reduce small scale
fosters a sound environment for            Lean Collaborative by expanding across state,           service duplication, restructure school districts, and
                                                                                                   realign government operations. Similar endeavors can be
economic growth                            county, and local public sector offices for
                                                                                                   found in New Jersey’s Joint Legislative Committee on
                                           ensuring efficiency and effectiveness of
                                                                                                   Government Consolidation and Shared Services (and its
                                           government spending, budgeting, and resource            Local Unit Alignment, Reorganization, and Consolidation
                                           allocation                                              Commission), Ohio’s Commission on Local Government
                                                                                                   Reform and Collaboration, and NY Local Government
                                                                                                   Efficiency and Competitiveness.


                                                                                                                                                 24
Government Operations and Services:      Assess and benchmark successful ‘regionalism      California has led the Nation with its Economic Leadership
the administration of government         models’ for workforce, economic development,      Network formed by public-private partnerships in
systems enables commerce to operate      and business service delivery to determine what   regionally-focused economic development, cluster and
and compete seamlessly and effectively   has worked among commercial centers in other      worker driven collaborations, and alignment of statewide
                                                                                           infrastructure to cluster demands. In turn, the States of
across multiple programs and             states and nations
                                                                                           Georgia, North Carolina, Tennessee and Mississippi have
geographies, thereby minimizing delay
                                                                                           instituted ‘Rural Communities’ initiatives to focus
and duplication                                                                            planning grants and implementation technical assistance
                                                                                           on improving the economic futures of rural counties and
                                                                                           cities. The work of these states has been driven by
                                                                                           ‘vitality index’ reports on poverty, clusters, multi-
                                                                                           jurisdictional savings, and mindset for cooperation across
                                                                                           boundaries.


                                                                                                                                          25
Next Steps: Priorities for Implementation
Historically, the Iowa Business Council has long held a strong belief
in the future growth prospects of it State, people, and institutions.
Each member firm and academic campus has made its commitment
known for seeking all available pathways to a vibrant business
climate, an innovation-based economy, and a world-class workforce
able to compete on a global scale.

The ability to create sustainable personal and business income
growth for Iowans is critical to the transformation of the overall
economic engines of employment and current sectors, including
those sectors that are dependent upon public resources (such as
government operations).

In previous endeavors, the Council was encouraged to first and
foremost turn to the private sector for taking action and completing
implementation of recommendations. In our experience in over 100
engagements in the U.S. and abroad, we have not looked to the
public sector or government for all the answers.

And yet we recognize that ‘going it alone’ does not build the sustainable foundation on which
to successfully address challenges nor implement recommended actions. A decade ago, the
Council identified challenges and gaps in the economic landscape that would limit
competitiveness, and then sought the inclusion of and engagement with several non-Council
entities and interests, including the Executive and Legislative branches. Yet, it looked to its own
civic and corporate leadership to step forward initially.

These eight recommendations include elements already being implemented at various stages of
progress. Through a more formal process of facilitating expertise, leadership, and institutional
know-how, we strongly encourage the Council to bring together disparate, often fragmented
groups and initiatives for a Blueprint Forum to discuss these findings and spark a fast-paced
planning process.
In the previous Framework for Action, a set of ‘Hot Teams’ was empowered to design
immediate plans, metrics, and organize the champions and resources for execution so as to
ensure progress. In this manner we believe driving results will have a greater chance by
concurrence on the metrics and performance necessary among all interests by the Council’s
leadership through
convening action-
oriented teams
and catalyzing
accountability for
performance. The
adjacent schematic
represents a
Blueprint pathway
forward.


                                                                                            27
Endnotes and Referenced Materials
I. Challenges
Demographic Challenge, page 3: Iowa Workforce Development, Iowa State Data Center, U.S. Census
Bureau, Population Division, 2008-2010; Iowa Population Reports, Components of County
Population Changes, 2000-2009

Economic Prosperity Challenge, page 3: Iowa Workforce Development, Iowa State Data Center,
2008-2009

Economic Prosperity Challenge, page 5: Iowa Workforce Development, Iowa State Data Center, 2010

College Graduation Challenge, page 7: Iowa Department of Education, U.S. Department of
Education, National Assessment of Educational Progress annual survey, 2008-2009

College Graduation Challenge: page 7: Iowa Department of Education, U.S. Department of
Education, National Assessment of Educational Progress annual survey, 2000-2009; ACT College and
Career Readiness Report, 2009-2010

Fiscal Challenge, page 8: Outstanding Debt by Security Type, Entity, and Purpose for Iowa State and
Local Government 2006-2009, Office of the State Treasurer, Reports Legislative Services Agency

Fiscal Challenge, page 8: Recovery.Gov (U.S.), State ARRA Expenditure Reports; State and Local
Expenditure reports, Iowa Legislative Services Agency, Fiscal Services Division (2007-2010)

Economic Prosperity Challenge, page 9: Statewide Projections 2006-2016, Labor Market and
Economic Research Bureau, Iowa Workforce Development; Iowa Manufacturing Report, Iowa State
University Extension Program, April 2010.

Economic Prosperity Challenge, page 9: Statewide Projections 2006-2016, Labor Market and
Economic Research Bureau, Iowa Workforce Development

Market Access Challenge, page 11: U.S. Census Bureau, Foreign Trade Division; Iowa State Data
Center, Report on Top 25 Commodities Based on 2009 Dollar Value, 2009

Demographic Challenge, page 11: U.S. Census Bureau, Population Division; Iowa State Data Center,
2003-2010

Economic Centers Challenge, page 11: U.S. Census Bureau, Population Division; Iowa State Data
Center, Report on Population Estimates and Numerical Changes for Iowa’s Incorporated Places by
County, 2000-2008

Pre K through 12 System Challenge, page 12: Iowa Department of Education; U.S. Department of
Education, National Assessment of Educational Progress annual survey, 2008-2009

Fiscal Challenge, page 12: Surrounding State Tax Rate Comparison, Federation of Tax Administrators,
Office of the State Treasurer

Governance Challenge, page 13: Legislative Services Agency, Fiscal Services Division; Iowa State Data
Center; Iowa Workforce Department


                                                                                                  28
Fiscal Challenge, page 13: Outstanding Debt reports (Office of the Treasurer); U.S. Census Bureau,
Population Division reports; Iowa Workforce Department

Infrastructure Challenge, page 14: “Iowa Infrastructure Spending, FY 2010,” Iowa Legislative
Services Agency, Fiscal Services Division

Demographic Challenge, page 14: U.S. Census Bureau, Population Division; Iowa State Data Center,
2000-2009; Iowa State University Center for Industrial Research and Services

Economic Prosperity Challenge, page 15: U.S. Census Bureau, Foreign Trade Division; Iowa State
Data Center, Agricultural Exports, 2000-2009

II. Charts & Graphics
“From Commitment to Action”, page 4; reference: Framework for Action, 2001, Iowa Business
Council Summit, Facilitation Guide (“Achieving Results”), Richard Seline, New Economy Strategies,
LLC.

“Evolution of the Role of Economic Development Strategies,” page 10; reference: “Clusters of
Knowledge and Competency,” briefing paper, Richard Seline, New Economy Strategies, LLC. 2007

“Clusters and Competitiveness, Houston Oil and Gas Products and Services Cluster,” page 15;
reference: Harvard University, Institute for Strategy and Competitiveness, Dr. Michael Porter,
“Cluster Report for the Greater Houston Partnership, 1999”

“Underpinnings of Regional Competitive Knowledge Models,” page 16; reference: New Economy
Strategies LLC., Richard Seline, 2008

“Collaboration Among Clusters,” page 17; reference: Richard Seline, 2003

“The Knowledge Economy – Clusters of Competency,” page 18; reference: “Clusters of Knowledge
and Competitiveness Road Map for the State of Alabama,” Alabama Economic Development
Partnership, 2005-2006, New Economy Strategies, LLC.


III. Additional Referenced Materials
Over 140 reports, white papers, analytical briefings, and data-set sources were reviewed by
Regionnovate LLC for the production of the Blueprint. This source material included approximately
35 reports conducted at the national level inclusive of ranking and benchmarking Iowa to peer
states regionally and nationally. At the outset of the engagement, Regionnovate reviewed the past
five years of reports prepared by in-state institutions and organizations as well as items contracted
by the Departments of Workforce and Economic Development. An internal web-based ‘knowledge
sharing space’ was created for the Iowa Business Council Deputies and membership to review the
entire collection of information used to form the basis of findings and recommendations in the
Blueprint. Several matrices were generated to form the Challenges ‘text boxes’ and for purposes of
space, only a fraction of the data-points were used herein. A copy of these matrices and overall
collection highlights is posted on the Council’s website for review.


                                                                                                     29
APPENDIX
Intention and Impact for Measuring Performance and
Accountability: A Competitiveness Index, Scorecard and/or
Dashboard
The work of the Iowa Business Council in making its ‘Case for Change’ in 2001 signaled the interest in
identifying a handful of challenges and opportunities on which the collective business community could
have an impact. Through an exhaustive process of data analysis and assessment, the Council formed
action teams around prioritized goals based on a day-long summit held at the University of Northern
Iowa and attended by over 75 business, academic, entrepreneurial, and civic organization leaders. In
reviewing its work from nearly a decade ago, Regionnovate has sought to determine if ‘the needle has
moved’ on a number of critical indicators – and what remains to be done by the private sector, in
partnership with the public sector and economic development interests, as well as what could be
encouraged as possible action steps for mitigating negative trends and/or establishing new frameworks
for leveraging Iowa’s assets and advantages.

Clearly, an initial step for reviewing where Iowa has been and where it must go as a State, an economy,
and as a global competitor for growth and prosperity requires measuring progress and performance.
Some thirty other states and hundreds of regions and communities across the Nation have used an
annual performance scorecard, report card, or index as a means of ensuring actions lead to results.
Therefore, we are suggesting, through this draft outline of a ‘Competitiveness Index’ to shine light on
successes as well as highlight where attention, leadership and investment remain.

Taking Action in Times of Turbulence
Since the beginning of the so-called 2007-2010 Great Recession, the instability of markets, economies,
and government engagement marks a new time of turbulence for Iowa and the Nation. Such
uncertainty often creates discussion and debate about more immediate issues, and leaves long-term
problems for another day. However, Iowa has been a state in transition for nearly twenty years, and as
many indicators suggest, Iowa is ‘stuck in the middle’ of the pack in certain measures that unless more
attention is given to addressing these challenges, the more it could slip further behind. All the while,
Iowa has received very positive attention in national media rankings – primarily focused on individual
cities or communities rather than the entire breadth of the State. Such bad news-good news dynamics
have been taken into account in the formation of the draft index outline.

Being Held Accountable for Immediate, Near-Time and Long-Range Results
By suggesting the creation of a Competitiveness Index, certain assumptions have been formed: not only
would the Council seek to promote the concept that ‘we act towards what we are measured’, but that
accountability is defined as taking the action and completing the implementation – even when no one is
watching. Simply, the indicators and metrics found throughout the draft Index require a collaborative
model for response and ‘ownership’ of the results among various entities, institutions, and
organizations. At the same time, the Council is encouraged to involve other end-users of the Index to


                                                                                                   30
identify their roles, responsibilities, and results-oriented strategies to ensure that the State’s
competitiveness ‘needle’ does move in the appropriate direction.
Selection of Metrics, Indicators, and the Role of Rankings
A robust discussion and debate has been held among a working committee of the Council membership
on the appropriate metrics and indicators to measure performance. We were, as could be expected,
influenced at first by well over 30+ different rankings of Iowa by external sources. The consensus has
been to observe these rankings, understand the methodology and analysis behind each ranking, and
then to determine how Iowans seek to measure themselves and on which key elements.

Rankings provide an insight to how others perceive Iowa and its economy - and in observing these
annual reports, magazine articles, and briefing materials – we find value in recognizing that external
validation or even warning about the current direction should be a part of the consideration for action
taken by end-users. However, a number of the rankings cause confusion when competing measures
suggest that Iowa is ‘great, good, or bad’ across the same themes. For instance, a number of rankings
suggest that Iowa is either a hospitable state or a very negative location for ‘Doing Business.’ After
delving into the data and information used to form these rankings, we determined that it was best to
identify metrics and indicators that – when standing alone – could provide insight as to the necessary
direction of the ‘needle’ on Iowa’s current and future competitiveness.

Finally, the metrics and indicators selected for the draft Index require a comprehensive assessment of
intended goals and progress for economic growth and prosperity. Assessing the themes across silos
should be encouraged since Fiscal Policy and Education, or Governance and Economic Growth for
example impact planning, operations, and investment by both private and public sectors.

How Other States Use Indicators, Metrics, Performance Measurement
Several of the Iowa Business Council’s peer organizations have directly or indirectly driven performance
measurement at the state and regional economies for their members and partners. For example, one of
the most extensive initiatives is in Oregon: “The Oregon Progress Board is an independent board
created by the Legislature in 1990 to monitor the state's 20-year strategic vision, Oregon Shines, and
keep it current. The 12 member panel, chaired by the Governor and made up of citizen leaders, reflects
the state's social, ethnic and political diversity.” The Progress Board, recently defunded due to severe
fiscal challenges in the State, has spawned several organizational partnerships to maintain the
performance metrics system through the public sector as well as to engage in citizen-supported
indicator reports and forums. Further, Oregon has continued to use a robust online dashboard (found
at http://benchmarks.oregon.gov/) to engage the broadest interest for its economic and governance
strategies. The long-term impact for Oregon and its regions has been cluster-focused economic
developments supported by a constantly monitoring of the health of the State’s people, infrastructure,
and business environment.

Similarly, the Michigan Turnaround Plan was driven by the business community seeking to prevent the
State’s fiscal and employment challenges causing further damage to the long-term prospects of
company growth and retention. An exhaustive assessment of the business-case issues facing the private
sector was coupled with a number of metrics on the top critical factors negatively impacting
employment as well as benchmarks against competitor states with similar profiles in manufacturing,
operations, and innovation capacities. The Turnaround Plan is considered the pivotal document used
during the 2010 election cycle, and has been broadly distributed to legislators, local elected officials,
economic organizations and chambers of commerce. The Plan’s metrics are driving fiscal policy-making.

                                                                                                   31
Useful Tips for Reviewing the Draft Competitiveness Index
Regionnovate suggests that an Iowa Index should present metrics as ‘Then’ (2001/2002) and
‘Now’ (2009/2010 or latest data availability). Projections for future years should be noted in
descriptions of ‘Impact on Iowa’ since information on trends and forecasting can provide useful
insights for near-term planning. By linking the past and current with future trends, the
powerfulness of the action, response, solution created can be determined over a period of
time. Many of the challenges found in the Blueprint cannot, of course, be changed overnight.

By assessing progress over a ten-year period, the Council and interested parties should take
into account a number of ‘environmental’ scenarios that have impacted the Nation as a whole
and Iowa specifically. For instance, while the current recession has devastated several mid-
western regions and communities, Iowa has been resilient to significant drops in housing and
real estate sectors. While no one could predict the unfortunate losses due to weather and
flooding for many of Iowa’s cities and towns, current rebuilding offers unique opportunities to
fix infrastructure and facilities with new technologies and systems as well as find boundary-
crossing solutions for multiple communities affected by these disasters. And in doing such
rebuilding, an opportunity exist to align outcomes and impacts with clear measures of how
operations and infrastructure assist the business climate and competitiveness.

Other so-called ‘assessing impact through scenario setting’ for Iowa must include the results of
the short-term funding of programs through the federal Recovery Act, national security or
terrorists threats, and disruptive technologies and services that shift sometimes daily through
innovation. Therefore, in using the Index, the uncertainty – the turbulence – of our times
should provide perspective that these are mileposts for consideration rather than hard-and-fast
‘rules’ that cannot be adjusted over time. The indicators outlined on the following pages align
with the findings, goals, recommendations noted in prior sections, providing aspirational end-
points for measuring success or reminding Iowans of remaining work to be done.

One final perspective on a draft competitiveness index centers on the types of actions that are
being measured. The tougher measurements are often those that seek to impact mindset,
culture, transformation, and response to change. We know that measuring academic
performance and related test results is a clear demonstration of progress in STEM instruction,
however parental involvement in supporting graduation from high school, community college,
or a four year university are vital to the prospects for addressing this challenge in Iowa.

We know that measuring the number of public sector employees at the state and local levels
describes employment patterns in government services, and yet measuring the willingness and
related incentives to find innovative means of program delivery signals adaptation to budget
reductions. Simply, a competitiveness index can ‘keep score’ in certain ways but also requires
measuring so-called soft-skills that are just as if not more important to the Blueprint goals.
These alternative metrics require further discussion to ensure implementation of
recommendations are sustainable well into the future based on accountability and purposeful
decisions to change performance results.

                                                                                              32
Economic Growth & Opportunity Indices
Goal: The ‘go to’ location for business relocation, expansion, consolidation, and innovative startups

Metric: Overall Gross State Product
What Does It Mean: The accumulation of data on what drives an economy is comprised of several factors
including employment, wages, investments, assets, and revenues/sales.
What is the Impact on Iowa: Our underpinning sector – Agriculture – has provided an important buffer for
declines in other sectors. Yet, by concentrating on industry clusters as an economic development
strategy, we have been able to attract and expand the Financial Services and Information Technology
sectors. Such diversification is vital to long-term prospects.

Metric: Non-Agriculture Employment Growth
What Does It Mean: A portfolio of industries, firms, and businesses as well as non-profit, academic, and
government employment secures an economy through the turbulent times. However, if the mix of
sectors is not fully balanced or there is not enough growth in incomes, revenues, sales, then external
forces can ‘control’ the fortunes of a state.
What is the Impact on Iowa: Through the work of the Innovation Council and the prior work of the Iowa
Business Council around industry clusters, new opportunities for employment are being discovered. All
the while opportunities for retrenchment of existing corporations from China and abroad back to the U.S.
are on the rise. Making Iowa a location choice is now critical for future growth.

Metric: Manufacturing as a Percentage of Gross State Product
What Does It Mean: Manufacturing is a mainstay occupation for a growth-oriented economy, and as
global competitive has led to the off shoring of these jobs, retention in Iowa becomes vital
What is the Impact on Iowa: Since agricultural occupations are often counted as a part of the
manufacturing supply chain, without these jobs, Iowa’s economy would have been harder hit in the
recession. In turn, the lack of new manufacturing occupation opportunities signals challenges.

Metric: High-Tech Employment and Wages Per Population
What Does It Mean: With the transition of industry sectors and clusters towards more technology-
intensive employment, any state that is lagging behind national or global trends could slip further
What is the Impact on Iowa: Unless the pipeline is created with more technically-skilled graduates and/or
the attraction of new citizens with such skills, Iowa will not be considered as location for expansion,
relocation, or even internal growth of future industries

Metric: Access to Investment Financing and Business Incubation
What Does It Mean: The attraction of external risk capital as well as that created among in-state groups
coupled with services, facilities, and operations to support new enterprises is a competitive advantage
What is the Impact on Iowa: While academic R&D funding has risen, existing industries continue to
innovate, and fiscal policies are in place, Iowa continues to lag behind in its capacity to launch new
products, services, and technologies from entrepreneurs


                                                                                                  33
Education Indices
Goal: A national leader in Pre K through 16 education, readiness, scientific application of Iowans

Metric: Science, Math and Reading Scores – 4th versus 8th grade
What Does It Mean: Progress in retaining achievement for critical learning
What is the Impact on Iowa: With little or no movement over a ten-year period, Iowa has not
achieved a standard of excellence required for competing on a global level

Metric: State Spending per Pupil
What Does It Mean: Year-to-Year investment in educational progress. Requires breakout of spending
on infrastructure, personnel, materials, and other elements impacting scores, student retention, and
long-term value of current instruction
What is the Impact on Iowa: Correlation between score indicators and expenditures often informs the
progress of classroom instruction

Metric: Educational Attainment by Population Over 25
What Does It Mean: Significant drop-off from High School rates to the number of students continuing
their education in a two- or four-year setting
What is the Impact on Iowa: There must be a concerted effort for informing, engaging, and
encouraging parents and students towards obtaining college certification and degrees as a long-term
economic value

Metric: Total Funding (including Research) on Higher Education Campuses
What Does It Mean: Through peer-reviewed grants, sponsored research programs, philanthropic gifts,
and other funding mechanisms, universities provide the brainpower for the Knowledge Economy from
faculty and students as well as regional engagement with the private sector
What is the Impact on Iowa: Such significant increases in funding – especially federal grants and
contracts – to Iowa’s institutions has assured a pipeline of ideas, technologies, and brains for
commercialization and solving grand challenges facing Iowans such as health and wellness, energy,
and technology adaptation for older industries.


                                                                                                     34
Demographics and Diversity Indices
Goal: The preferred destination for a diverse workforce and population with global industry
marketability as its core

Metric: Net Migration to Iowa
What Does It Mean: Increases in population choosing the State as a place to live, learn, and earn
indicate perception of opportunities found here rather than other locations
What is the Impact on Iowa: A low net migration in correlation to a low birth rate signals future
challenges in workforce supply, potential increases in labor cost, and a less ‘global’ appreciation for
cultures, languages, and markets

Metric: Age of Population by Demographic Group
What Does It Mean: Over the past ten years, Iowa has become a ‘bar-bell’ state – Younger on one-
end, Older on the other – with average to below average growth in the middle
What is the Impact on Iowa: Cost of services for these two disparate age groups will only increase in
health care, education, social service expenditures

Metric: Percentage of Students Learning a Foreign Language
What Does It Mean: As globalization of markets continues, those states and communities with
programs focused on international learning including foreign language components tied to Asia, South
America, and Europe are viewed as competitive
What is the Impact on Iowa: Given the number of domestic and global firms based in Iowa, the need
for highly-skilled students with foreign language proficiency will directly impact the growth of
markets, new product sales, and expansion of exported goods

Metric: Investment in Diversity Programs by Public and Private Sector Sources
What Does It Mean: Participation in diversity programs at the corporate and government levels
assures the necessary actions are being taken to identify, provide for, and connect with populations
across age, nationality, experience levels.
What is the Impact on Iowa: A number of Iowa corporations already have highly-regarded diversity
initiatives tied to human resource officers and senior executives with responsibility for workforce and
skills development. By acknowledging the level of resources committed to such programs gives
credence to the value and sustainability of openness.


                                                                                                      35
Health and Well-being Indices
Goal: One of the healthiest states and people in the Nation

Metric: Obesity Rate of Children Age 10-17
What Does It Mean: Predicator of long-term health challenges for future generations as less healthy
citizens influence cost of Medicare, other public and private insurance, employment and productivity, and
indirectly housing and transportation costs
What is the Impact on Iowa: With a corresponding young population comes the need to focus on long-term
health and well being so as to prevent future illnesses and diseases in both urban and rural Iowa. Current
hypertension, heart, and cancer related illnesses in older populations correspond to obesity rates of
generations borne in the 1950s-1970s.

Metric: State Overall Health Expenditures Per Capita
What Does It Mean: The public expenditures on health care have jumped in some states nearly four fold
according to the Pew Charitable Trust and the Robert Wood Johnson Foundation. Those locations with
strategic health programs for prevention, immunization, awareness and training have also seen
corresponding improvements and benefits to their citizenry including reductions in smoking, transmitted
diseases, and obesity related illness.
What is the Impact on Iowa: Proportional increases in health expenditures without side-by-side recognition
of immediate and long-term impacts, where such expenditures could be better targeted, and otherwise the
lack of a future strategy against trends leaves Iowa vulnerable.

Metric: State Expenditures on Medicaid
What Does It Mean: Medicaid as a federal program for under-served populations requiring health and
social services continues to increase across the Nation, and as such is putting increased pressure on state
budgets
What is the Impact on Iowa: Based on the expansion of health care for all citizens, and the increase demand
for certain coverage to younger as well as elderly citizens, Iowa is expected have 25% jump in Medicaid
expenditures this year, and a steady increase of 15-18% annually thereafter

Metric: Percentage of Children Living in Poverty
What Does It Mean: With changes in demographics and economic opportunity, the number of children
facing financial challenges at or below poverty foretells future demands on services in health care,
education remediation, crime, and other public services.
What is the Impact on Iowa: Though the State has an unemployment rate below the national average, any
increase will extend the impact on children living in poverty. Expanding employment opportunities for
parents is a direct influence on reductions in poverty.

Metric: Percentage of Citizens Covered by Private Health Insurance
What Does It Mean: Availability and utilization of private health care insurance leads to healthier families,
modernized services and facilities, and long-term well-being through preventative medicine, exercise, and
related health benefits that lower costs over time
What is the Impact on Iowa: The offering of health-care benefits to employees and their families continues
to be a positive aspect of human resource recruitment and attraction given the increases in health care
costs.

                                                                                                     36
Infrastructure and Transportation Indices
Goal: The home of globally competitive commercial centers leveraging Iowa’s public infrastructure
in transportation, energy, information, and research.

Metric: State Investment in Infrastructure as Percentage of Debt
What Does It Mean: On what areas of spending a state utilizes its debt – especially in new versus
maintenance/repair of infrastructure and transportation - signals the modernization of key assets for
competitiveness in the movement of goods, people, and ideas
What is the Impact on Iowa: Where the State determines to place is investment of debt as well as
formula funded federal grants and contracts strengthens commercial centers of economic activity by
the long-term needs for infrastructure. In turn, patterns of public sector infrastructure investment
often impact general real estate, housing, education, retail/trade, and operation decision-making for
site location.

Metric: Access to Airports/Airline Services for Business Travel Connections
What Does It Mean: As air travel becomes linked to increased domestic and international markets, a
state needs airports that are well connected to airlines serving those emerging centers of commerce
What is the Impact on Iowa: the ability to prove to a shrinking number of airlines serving Iowa that it
can sustain the demand for seats going to specific markets and regions is critical to both

Metric: Projected New Miles of Highway/Roads by Population Density
What Does It Mean: Where a state or region plans, constructs and maintains its infrastructure relative
to population demand corresponds to the transportation needs of employees, employers,
commuters, and education providers of the K-16 system as well adult learners.
What is the Impact on Iowa: Forming a long-range planning process for transportation based on
commercial centers and the growth along key corridors will impact financing of new highways and
roads in concert with housing development, education institutions, warehousing, and retail demand.

Metric: Broadband Infrastructure and Utilization
What Does It Mean: Increased traffic on the Internet for business, education, government services,
and civic networks responds to the needs of 24x7 economies, globalization, and the
attraction/retention of students seeking robust digital communities
What is the Impact on Iowa: Based on Iowa’s lag-time to deploy broadband networks, WIFI, and other
information architectures designed to foster business-to-business, citizen-to-government, and
community-to-community of interests puts the State behind the curve for technology adaptation and
competitiveness.


                                                                                                  37
Fiscal Policy Indices
Goal: A public sector grounded in, and annually compliant with, principles of sound budgeting,
resource allocation, and impact on the competitive business climate

Metric: Budget Deficit as a Percent of Tax Revenue
What Does It Mean: The gap between revenues generated (through taxes, fees, other charges), and
expenditures on services, infrastructure, debt payments signals the need for reductions in the
imbalance by efficiency strategies, new revenue sources, alternative delivery models, and/or program
elimination.
What is the Impact on Iowa: Though Iowa has a tax policy that covers a broad range of industries,
businesses, and professional services, increases in Medicare and Local Expenditure Support acerbate
the resolution of the gap. And the end of short-term funding from the federal Recovery Act and
Disaster Relief Programs provides additional concern.

Metric: State and Local Debt Levels
What Does It Mean: National trends show that County and Municipal Debt has risen over the past
decade – often in locations where populations are in decline and revenue generation from the private
sector has been reduced. Therefore, bond servicing and financing of local government is under
increased scrutiny for default or renegotiations.
What is the Impact on Iowa: The value of increased debt service against marginal at best growth in
revenue generation by local governments throughout Iowa is a warning sign on future state
expenditures required to subsidize new growth in certain locations and steady declines in other
communities.

Metric: State, Local Taxes Per Capita
What Does It Mean: The tax burden on citizens and businesses against their incomes and revenues
indicates whether government expenditures are in alignment with sustainable resources on which to
continue to tap for service delivery at the same historical levels.
What is the Impact on Iowa: State tax policy – including credits to spur investment and industry sector
growth – are considered by some external assessments to be appropriate while other reports judge
Iowa at the bottom for its tax climate.

Metric: Counties with Decline in Population AND Increase in Debt
What Does It Mean: Indicates the borrowing pattern of a local government to maintain service levels
or respond to increased demands for certain services for a population that is declining in its capacity
to produce
What is the Impact on Iowa: Productivity by agricultural sources in many counties remains the highest
source of revenues as does transfer payments from federal and state programs directly to citizens. As
noted in the Demographic and Diversity section, the correlation between population growth and fiscal
policy are immutable and clear.


                                                                                                 38
Iowa Competitiveness Blueprint 2025 1

More Related Content

Similar to Iowa Competitiveness Blueprint 2025 1

IDB-9- Corporate Results Framework
IDB-9- Corporate Results FrameworkIDB-9- Corporate Results Framework
IDB-9- Corporate Results FrameworkMarco Velarde
 
Actionable Financial Analysis: Insights for Nonprofit Leaders
Actionable Financial Analysis: Insights for Nonprofit LeadersActionable Financial Analysis: Insights for Nonprofit Leaders
Actionable Financial Analysis: Insights for Nonprofit LeadersGuideStar
 
Economic Success Presentation to the Northern Virginia Building Industry Asso...
Economic Success Presentation to the Northern Virginia Building Industry Asso...Economic Success Presentation to the Northern Virginia Building Industry Asso...
Economic Success Presentation to the Northern Virginia Building Industry Asso...Fairfax County
 
Atlas The Truth About Job Fairies - IEDC 2014
Atlas The Truth About Job Fairies - IEDC 2014Atlas The Truth About Job Fairies - IEDC 2014
Atlas The Truth About Job Fairies - IEDC 2014Atlas Integrated
 
Resume Wightman - Modified - June 1, 2016
Resume Wightman - Modified - June 1, 2016Resume Wightman - Modified - June 1, 2016
Resume Wightman - Modified - June 1, 2016John Wightman
 
Measuring social impact with Social return on investment (SROI) at Cogite
Measuring social impact with Social return on investment (SROI) at Cogite Measuring social impact with Social return on investment (SROI) at Cogite
Measuring social impact with Social return on investment (SROI) at Cogite Cogite coworking space
 
DGXLiquidityFinancial Health2012-122013-122014-122015-122016-1220.docx
DGXLiquidityFinancial Health2012-122013-122014-122015-122016-1220.docxDGXLiquidityFinancial Health2012-122013-122014-122015-122016-1220.docx
DGXLiquidityFinancial Health2012-122013-122014-122015-122016-1220.docxmecklenburgstrelitzh
 
IDB-9- Operational Performance and Budget
IDB-9- Operational Performance and BudgetIDB-9- Operational Performance and Budget
IDB-9- Operational Performance and BudgetMarco Velarde
 
Putting High Performance Economic Development into Practice
Putting High Performance Economic Development into PracticePutting High Performance Economic Development into Practice
Putting High Performance Economic Development into PracticeAtlas Integrated
 
Rich Smolen Resume
Rich Smolen ResumeRich Smolen Resume
Rich Smolen ResumeRich Smolen
 
Management Reporting and Innovation - IPA Conference 2015
Management Reporting and Innovation - IPA Conference 2015Management Reporting and Innovation - IPA Conference 2015
Management Reporting and Innovation - IPA Conference 2015Chris Catto
 
EDD Leadership Lab: Reaching New Heights
EDD Leadership Lab: Reaching New Heights EDD Leadership Lab: Reaching New Heights
EDD Leadership Lab: Reaching New Heights nado-web
 
Las cruces first planning sessions
Las cruces first planning sessionsLas cruces first planning sessions
Las cruces first planning sessionsJWL Associates
 
Board roles in meeting financial challenges
Board roles in meeting financial challengesBoard roles in meeting financial challenges
Board roles in meeting financial challengesEllen Chaffee
 
Ravi Dawar Resume 251115
Ravi Dawar Resume 251115Ravi Dawar Resume 251115
Ravi Dawar Resume 251115Ravi Dawar
 
Integrated Reporting At Vancity (Nov 2010)
Integrated Reporting At Vancity (Nov 2010)Integrated Reporting At Vancity (Nov 2010)
Integrated Reporting At Vancity (Nov 2010)Joawest
 

Similar to Iowa Competitiveness Blueprint 2025 1 (20)

IDB-9- Corporate Results Framework
IDB-9- Corporate Results FrameworkIDB-9- Corporate Results Framework
IDB-9- Corporate Results Framework
 
Actionable Financial Analysis: Insights for Nonprofit Leaders
Actionable Financial Analysis: Insights for Nonprofit LeadersActionable Financial Analysis: Insights for Nonprofit Leaders
Actionable Financial Analysis: Insights for Nonprofit Leaders
 
What Makes Institutional Strengthening Work: NOPE’s Experience
What Makes Institutional Strengthening Work: NOPE’s ExperienceWhat Makes Institutional Strengthening Work: NOPE’s Experience
What Makes Institutional Strengthening Work: NOPE’s Experience
 
Economic Success Presentation to the Northern Virginia Building Industry Asso...
Economic Success Presentation to the Northern Virginia Building Industry Asso...Economic Success Presentation to the Northern Virginia Building Industry Asso...
Economic Success Presentation to the Northern Virginia Building Industry Asso...
 
Atlas The Truth About Job Fairies - IEDC 2014
Atlas The Truth About Job Fairies - IEDC 2014Atlas The Truth About Job Fairies - IEDC 2014
Atlas The Truth About Job Fairies - IEDC 2014
 
Resume Wightman - Modified - June 1, 2016
Resume Wightman - Modified - June 1, 2016Resume Wightman - Modified - June 1, 2016
Resume Wightman - Modified - June 1, 2016
 
Measuring social impact with Social return on investment (SROI) at Cogite
Measuring social impact with Social return on investment (SROI) at Cogite Measuring social impact with Social return on investment (SROI) at Cogite
Measuring social impact with Social return on investment (SROI) at Cogite
 
DGXLiquidityFinancial Health2012-122013-122014-122015-122016-1220.docx
DGXLiquidityFinancial Health2012-122013-122014-122015-122016-1220.docxDGXLiquidityFinancial Health2012-122013-122014-122015-122016-1220.docx
DGXLiquidityFinancial Health2012-122013-122014-122015-122016-1220.docx
 
IDB-9- Operational Performance and Budget
IDB-9- Operational Performance and BudgetIDB-9- Operational Performance and Budget
IDB-9- Operational Performance and Budget
 
10 06-03 veb annual spring bod meeting
10 06-03 veb annual spring bod meeting10 06-03 veb annual spring bod meeting
10 06-03 veb annual spring bod meeting
 
2005 to 2015 kauai ceds plan
2005 to 2015 kauai ceds plan2005 to 2015 kauai ceds plan
2005 to 2015 kauai ceds plan
 
Putting High Performance Economic Development into Practice
Putting High Performance Economic Development into PracticePutting High Performance Economic Development into Practice
Putting High Performance Economic Development into Practice
 
Rich Smolen Resume
Rich Smolen ResumeRich Smolen Resume
Rich Smolen Resume
 
Knowledge and Capacity Development
Knowledge and Capacity DevelopmentKnowledge and Capacity Development
Knowledge and Capacity Development
 
Management Reporting and Innovation - IPA Conference 2015
Management Reporting and Innovation - IPA Conference 2015Management Reporting and Innovation - IPA Conference 2015
Management Reporting and Innovation - IPA Conference 2015
 
EDD Leadership Lab: Reaching New Heights
EDD Leadership Lab: Reaching New Heights EDD Leadership Lab: Reaching New Heights
EDD Leadership Lab: Reaching New Heights
 
Las cruces first planning sessions
Las cruces first planning sessionsLas cruces first planning sessions
Las cruces first planning sessions
 
Board roles in meeting financial challenges
Board roles in meeting financial challengesBoard roles in meeting financial challenges
Board roles in meeting financial challenges
 
Ravi Dawar Resume 251115
Ravi Dawar Resume 251115Ravi Dawar Resume 251115
Ravi Dawar Resume 251115
 
Integrated Reporting At Vancity (Nov 2010)
Integrated Reporting At Vancity (Nov 2010)Integrated Reporting At Vancity (Nov 2010)
Integrated Reporting At Vancity (Nov 2010)
 

More from AccelerateH2O

Paris Texas Presentation Richard Seline
Paris Texas Presentation  Richard SelineParis Texas Presentation  Richard Seline
Paris Texas Presentation Richard SelineAccelerateH2O
 
Paris texas presentation richard seline
Paris texas presentation  richard selineParis texas presentation  richard seline
Paris texas presentation richard selineAccelerateH2O
 
Youth & Student Initiative
Youth & Student InitiativeYouth & Student Initiative
Youth & Student InitiativeAccelerateH2O
 
Speak Innovatively Newsletter
Speak Innovatively NewsletterSpeak Innovatively Newsletter
Speak Innovatively NewsletterAccelerateH2O
 
R Seline University Regional Engagement Activities
R Seline University Regional Engagement ActivitiesR Seline University Regional Engagement Activities
R Seline University Regional Engagement ActivitiesAccelerateH2O
 
21st Century Academic Enterprises & Innovation
21st Century Academic Enterprises & Innovation21st Century Academic Enterprises & Innovation
21st Century Academic Enterprises & InnovationAccelerateH2O
 
Measuring Comparative Benefits Of Arra Spending
Measuring Comparative Benefits Of Arra SpendingMeasuring Comparative Benefits Of Arra Spending
Measuring Comparative Benefits Of Arra SpendingAccelerateH2O
 
Intermediaries Article
Intermediaries ArticleIntermediaries Article
Intermediaries ArticleAccelerateH2O
 
National Dashboard Handout[1]
National Dashboard Handout[1]National Dashboard Handout[1]
National Dashboard Handout[1]AccelerateH2O
 

More from AccelerateH2O (9)

Paris Texas Presentation Richard Seline
Paris Texas Presentation  Richard SelineParis Texas Presentation  Richard Seline
Paris Texas Presentation Richard Seline
 
Paris texas presentation richard seline
Paris texas presentation  richard selineParis texas presentation  richard seline
Paris texas presentation richard seline
 
Youth & Student Initiative
Youth & Student InitiativeYouth & Student Initiative
Youth & Student Initiative
 
Speak Innovatively Newsletter
Speak Innovatively NewsletterSpeak Innovatively Newsletter
Speak Innovatively Newsletter
 
R Seline University Regional Engagement Activities
R Seline University Regional Engagement ActivitiesR Seline University Regional Engagement Activities
R Seline University Regional Engagement Activities
 
21st Century Academic Enterprises & Innovation
21st Century Academic Enterprises & Innovation21st Century Academic Enterprises & Innovation
21st Century Academic Enterprises & Innovation
 
Measuring Comparative Benefits Of Arra Spending
Measuring Comparative Benefits Of Arra SpendingMeasuring Comparative Benefits Of Arra Spending
Measuring Comparative Benefits Of Arra Spending
 
Intermediaries Article
Intermediaries ArticleIntermediaries Article
Intermediaries Article
 
National Dashboard Handout[1]
National Dashboard Handout[1]National Dashboard Handout[1]
National Dashboard Handout[1]
 

Iowa Competitiveness Blueprint 2025 1

  • 1. Winter 10 A Competitiveness Blueprint: Iowa 2025 Assessing Iowa’s Historical, Current, and Future Economic Prosperity and Growth Through Benchmarking, Trends Analysis, and Fact-Based Scenario Setting A Report to
  • 2. Table of Contents Executive Summary 3 Looking Back 7 A Renewed Sense of Urgency 9 Where Iowa Currently Stands 12 Competitive Advantages & Clusters 17 Goals and Recommendations 23 Next Steps and Priorities 26 End Notes and Referenced Materials 28 Draft Competitiveness Indicators 30 2
  • 3. Executive Summary Defining Competitiveness: “…Set of institutions, policies, and factors that determine the level of productivity…The level of productivity, in turn, sets the sustainable level of prosperity that can be earned by an economy. The productivity level also determines the rates of return obtained by investments (physical, human, and technological) in an economy. Because the rates of return are the fundamental drivers of the growth rates of the economy, a more competitive economy is one that is likely to grow faster in the medium to long run.” (source: the Global Competitiveness Report 2010-2011, World Economic Forum) Or said simply: expanding personal and business incomes ensures competitiveness of people and companies by providing the necessary resources to invest in, buy from, and grow an economy for Iowa’s future generations. This perspective prompted the formation of the 2001 Case for Change and the subsequent Framework for Action. Nearly a decade after its initial work, the Iowa Business Council believes there is a need for reassessment of the current business climate and conditions for future economic growth prospects.. The Council, comprised of corporate and academic leaders, has found through in-depth data collection and comprehensive analysis that gaps often remain in the State’s competitiveness on a domestic and global scale. Until these gaps receive further attention by private and public sectors, then Iowa will face potentially and increasingly difficult times ahead. Regionnovate’s key finding for this reassessment: if Iowa is to make significant strides to ensure a competitive Iowa by 2025 or sooner, then continuing to invest in people, infrastructure and economic opportunity, addressing imbalances in governance, and organizing the State and regional economic growth prospects by key strengths MUST become an adopted message and proactive agenda for the Council membership and its partners. A general proposition for the newest ‘case for change’ is simple: Iowa cannot invest in those opportunities that will make it nationally and globally competitive while continuing to invest in non-productive programs, maintaining the status quo in government services and practices, and not accepting the realities of its fiscal situation. Therefore, pushing tough choices to future generations creates a lack of accountability. An updated assessment seeks to be transformative, profound, and a game-changer for Iowans and their future. Because the Council’s values have not changed regarding the demand for a competitive Iowa business and economic climate, Regionnovate’s emphasis is even stronger for action and accountability! In 2010, what is the greatest challenge, threat or issue facing Iowans and their economic competitiveness? 3
  • 4. The answer: ensuring opportunities for growth of their incomes, based on the strength of their skills, access to critical infrastructure, a sustainable quality of life, and a hospitable climate for businesses to flourish. However, on-going issues in education, workforce, economic development, and governance of citizen resources challenge these aspirations To address these barriers and opportunities, Regionnovate proposes a Blueprint for Iowa 2025. We encourage, through the Iowa Business Council’s long-standing mission, to advocate for Iowa’s economic competitiveness by reducing barriers and limitations, as well as leveraging the State’s unique assets. In the past, through public discourse and debate, the Council has sought to catalyze solutions for Iowans and their future prosperity. This Blueprint for Iowa 2025 continues these traditions and values that the Council has advanced over the years. Our Assignment and Task: The Underpinnings of The Blueprint Regionnovate LLC was retained by the Iowa Business Council and worked with the Deputies Committee over the past nine months to define critical elements for assessing the historical, current, and future economic prospects. Based on the work conducted by Richard Seline nearly a decade ago for the Council in its endeavors on the Case for Change, Framework for Action, and the CEO Summit at the University of Northern Iowa, the Deputies sought an external, neutral third-party review of Iowa’s current and future 2001 Framework for Action: Facilitation Guide (Achieving Results) business climate for growth. Our methodology included: • Capture and assessment of all previous reports on Iowa’s economic, demographic, fiscal, policy-related, and regional industry sector investments, programs, and initiatives, including determination of progress based on recommendations from each report • Capture and assessment of best practices, benchmarked programs, and competitor state approaches to economic development, fiscal and financial policies, and general business climate initiatives • High level analysis of Iowa’s current industry clusters as well as growth-oriented innovation strategies in support of new product, service and intellectual property development across academic and corporate interests • Identification of alternative economic prosperity scenarios for Iowa based on current and emerging trends and forecasts, thereby informing a SWOT (strengths-weaknesses- opportunities-threat) assessment of competitive advantages as well as barriers, limitations, and challenges 4
  • 5. On-going communications with the Deputies and a small working group of the CEOs from the Council so as to gain vital insights, subject matter expertise on the ground in Iowa, and leadership expectations for advancing recommendations Driving Iowa Forward: Purpose of the Blueprint “ The purpose of evaluating Iowa’s competitive posture is to re-visit questions posed in 2001 and from similar efforts, update progress in those areas of concern, and introduce any new issues that warrant immediate consideration. The desired outcome is to offer a blue print for policymakers that identifies those economic and workforce development challenges the State needs to address now. And to identify initiatives and projects that IBC would consider to implement, catalyze, and/or encourage alignment of existing endeavors.” (Charge to the Deputies & Regionnovate) The Iowa Business Council has continued to support several initiatives that mitigate identified weaknesses or leverage competitive advantages in pursuit of excellence in commerce, workforce development, and education. It is imperative for Iowa to proactively address issues that promote a strong, vigorous, and welcoming business climate while developing a skilled and diverse workforce. Therefore, in the Council’s long tradition of stimulating and advocating public discussion on the State’s economic growth and competitiveness, Regionnovate has conducted an updated Case for Change 2001 through a Blueprint for Iowa 2025. Focus of the Blueprint: Regionnovate’s fact-finding and analysis was guided by the identification of answers to the following two Critical Questions on Iowa’s Future, leading to prioritized recommendations for action: What must be done now to maintain positive growth trends in Iowa five, ten, twenty years down the road? And how do concerned and engaged Iowans, make sure their state’s economy continues to compete and thrive in the national and global marketplace? The Blueprint for Iowa 2025 seeks to focus attention on a set of opportunities, challenges and the necessary recommended actions that acknowledge where Iowa has been, where it is currently, and where it must given attention in the future to be a competitive economic engine for all Iowans. As highlighted to the right, ‘Challenge’ boxes are included throughout the Blueprint so as to call attention to the underlying facts for discussion and debate. Simply, the facts speak for themselves – and provide vital insight to addressing these questions consistently and objectively. Regionnovate has proposed and drafted an initial Competitiveness Index (or the makings of a scorecard) that identifies certain indicators – based on over 700 metrics found globally - deemed to be significant and determinative in gauging an economy’s progress, identifying areas that need attention or reassessment, and a means of celebrating successful implementation. We have 5
  • 6. provided draft recommendations for the Council’s consideration and eventual decision on where to place its resources (time, reputation, monies, and thought-leadership). One critical and overarching recommendation for Council consideration is to host, through its long- standing role as a convener and facilitator, a Blueprint Forum on Iowa 2025 to discuss and prioritize the findings, goals, recommendations and possible performance measures suggested through this assessment. The current initiatives, roundtables, working groups, and advisory councils examining options and implementing solutions on any number of challenges has not been convened on a statewide basis; if efficient use of time and resources are to be allotted to resolving Iowa’s weaknesses and exploiting its advantages, now is the time to bring together several common threads for concurrence on goals, objectives, and most importantly accountability for implementation through agreement on the indicators and metrics requiring attention. The following sample inventory of initiatives and programs include Council representation and resources invested from corporate sponsorship and individual philanthropic gifts. We further recognize that there are several important and significant initiatives and projects underway at the local levels throughout Iowa; with the adoption of a regional approach as described in following sections, there is an opportunity to connect the entire range of interests and participants across the State into a more strategic discussion about assets, investments, and outcomes. 6
  • 7. Looking Back on The Case for Change in 2001 In 2001, the Council completed a significant agenda around the ‘Case for Change’ suggesting that unique challenges and opportunities existed in public and private sectors that could limit or propel the economy and climate for competitiveness. As noted, the 2001 agenda sought to identify only a handful of actions for which the Council – the business community, academic leadership and partners – could effectively champion and implement. The initial Case for Change provided a fact-based assessment of Iowa’s economic situation in light of comparison with other states and communities. It recognized where strengths created an advantage and where shortcomings could eventually have a negative impact on job-formation and expansion of company growth. Over the course of six months, culminating in a half-day forum with nearly 70 leaders from across the State, a Framework for Action was developed around five specific challenges on which small working groups or Action Teams shaped implementation plans and initiatives. Appropriately the Council sought to engage the best minds in the public and private sectors to define solutions, many of which continue to have an impact on and benefit the State’s economic competitiveness. The immediate effect of the Framework was the role of the Council as a catalyst for results-oriented goals. The secondary recommendations and potential goals emerged over the decade with additional results. The so-called ‘ripple effect’ has included a broader agenda in areas of government efficiency using private 7 sector practices, improved education results for current and future generations, and betterment of employees and citizens lives through a focus on life sciences, health-care, and wellness.
  • 8. Lessons Learned from Prior Efforts The Council seeks to examine results from and the possible renewal of the successful process from the 2001-2002 Case for Change and the Framework for Action by assessing both progress and continued threats to Iowa’s relative growth. What Regionnovate has determined - though the ‘needle’ has moved a bit - is that certain issues have only worsened since our last review nearly ten years ago (e.g. college graduation rates and educational fulfillment is a key example). At the same time, we must encourage the continuation – and even the expansion – of successful initiatives and programs begun over the past decade; Council members and partners have expended time and energies year after year – and now is not the time to neither diminish nor divert attention. If anything, a renewed sense of urgency has been outlined on the following pages that should cause the Council to re-engage previous patterns of convening, convincing, and connecting with others of like mind about the State’s lack of or unique advantages in competitiveness for growth. 8
  • 9. A New Sense of Urgency for the Next Decade Through the lens of external rankings and internal indicators, the underlying data speak for a new sense of urgency – and a renewed commitment to focus attention, resources, and leadership from all Iowa sectors to ensure national and global competitiveness in light of numerous unfolding scenarios. For instance, Iowans have long known that many of communities are declining in population while other U.S. and international cities and regions are expanding and accelerating through industry clusters, retention of students and entrepreneurs, spin-offs, and corporate market-share growth. However we have identified the ‘Iowa quandary’ – on one hand specific Iowa communities are recognized in popular rankings for successfully chartering economic growth through the past decade and the recent recession, and on the other hand some rankings suggest that Iowa has a negative business tax climate, is difficult for doing business, and may have other fiscal and financial clouds on the horizon. These competing rankings and perspectives suggest that the Council must view the sense of urgency based on the facts, not perceptions nor external rankings. Through an index or scorecard, only Iowans can frame what matters most to Iowans! Our analysis and findings suggest that the sense of urgency facing Iowans in 2010-11 includes: State and local expenditures for debt and fiscal challenges outstrips resources needed for new investments, more focused allocations and investments in activities that would produce growth. Since several Iowa locations have had negative population growth year on year, and as populations have shrunk, so have the revenues of these jurisdictions. The use of bonds and other debt financing has put a number of government institutions in a precarious position as these locations show limited signs of re- generating their taxable revenue base unless new strategies are adopted for attracting additional industries, sectors, and/or value-added processes. Over the past decade, a majority of federal expenditures in Iowa have increasingly become transfer related payments in social services and health benefits, not for growth oriented activities that build incomes, enhance assets and infrastructure for attracting companies and investors to the State, nor expand capital necessary for entrepreneurs and businesses. These imbalances in allocated resources limit vital investments for supporting and expanding Iowa’s clusters and innovative capacities. Since the Knowledge Economy is centered on educational prowess, research facilities and equipment, and the resulting commercialization process, the retention of students and in turn innovators resulting from the academic setting has moderately increased but not kept pace with national trends. We have found in benchmarking other states and regions that industry sponsored research, targeted federal grants and contracts, and leveraged philanthropic investments in Iowa’s higher education is at a critical point for maintaining a 9
  • 10. competitive advantage. While some states have created unique initiatives to connect the academic campuses to industry, entrepreneur, and innovation-based economic development, Iowa is only just now examining this course of action. Iowa’s population gap and lack of diversity has become a detriment to the future workforce supply forecast of demand as well as overall business planning that require a constant access to a steady pool of skills, including top science, technical talent. In reviewing many of the Council’s member websites and communications tools, ‘diversity’ has been an adopted corporate mission, and yet there is no clear public sector strategy to address this unique and critical challenge Finally the two-year old recession, and in turn the current recovery, is causing consolidation and retrenchment of firms from abroad as well as within the United States. A number of corporations are re- examining where to concentrate their operations and centralize their manufacturing processes. Therefore whether Iowa is a choice location is up for grabs. We believe that these and similar challenges have sparked renewed urgency for the Council’s attention and response, as well as engagement with partners throughout the State viewing the urgency with the same concern. Change Will Continue To Impact Iowa: Highlighting Trends and Forecasts A decade ago, the Council’s Case for Change suggested ‘change’ is a constant that Iowans must accept and embrace rather than fear. Today’s uncertainty in private and public revenue generation requires attention to leveraging resources and efficiencies in times of a permanent economic and society ‘turbulence’; therefore aligning growth prospects with a stable and sustainable business climate is critical. While Iowa have made strides in adopting and implementing industry cluster development, the best minds and brains do not have to be located in Iowa to ‘win’ economically nor professionally; therefore Iowa must consider a talent ‘development and recruitment’ strategy as key to global competitiveness. Because of ‘disruptive’ technological and manufacturing advancements, Iowa’s industries and sectors will require greater differentiation of markets and services in the future to maintain competitiveness; therefore increasing global networks and regional relationships among Iowans is vital to move ideas, products, and solutions into Iowa’s companies, communities, and institutions. Thus, coordinated actions among sectors, institutions, organizations, and government necessitate stronger, sustainable partnerships for the public and private sector; therefore data collection, 10
  • 11. analysis, and knowledge sharing is paramount to anticipating scenarios rather than reacting to circumstances. Removing barriers and ending stovepipes – especially across departments, agencies, and programs as well as with the private sector – is now critical. The evolution in the mindset that the Iowa Business Council sparked nearly a decade ago requires a recommitment to ‘change’ for purposes of maintaining good work towards and to fine-tuning the delivery of economic, workforce, research, commercialization, and innovation capacity among institutions, industries, investors, and innovators. Those states and regions that have progressed in the evolution of their economic strategies did so based on the civic, business, and academic leadership driving an agenda on specific steps and initiatives, and of course performance and accountability for results. Constantly monitoring the economic landscape and consistently modifying plans as appropriate to meet and exceed competitor states and nations is no longer an option for Iowa. In light of the on- going economic turbulence facing the Nation and in turn Iowa, reassessing how the near-term economic development infrastructure, strategies, policies, and operations meet the test of the global competitive marketplace is now vital to successfully implementing the Blueprint’s goals and recommendations. 11
  • 12. Where Iowa Currently Stands: A Frank Overview of Today’s Iowa We recognize and honor Iowa’s agricultural heritage and strength, but to assure its long-term prosperity and impact it must continue to adapt through value-added innovation, thereby serving the health, well-being, energy needs of Iowa citizens and the Nation as a whole. The State is fortunate that agriculture has provided some stability during this most recent recession, but overall it cannot solely rely on a commodity product-base in a highly competitive global marketplace. Another Iowa quandary is the State’s very young versus aging population – polar extremes – coupled with a lack of diversity that limits the future supply of the workforce, while in turn tapping public services at an alarming rate. This convergence of population and demographic challenges has increased demand on government resources and services, and therefore significantly impacted demands for new revenue generation. And reliance upon federal offsets can no longer be counted in the State’s fiscal scenario. In turn, Iowa’s highly regarded work ethic, nationally-recognized training programs, and on- going commitment to skills development could be diminished by ending or reducing resources for continuous improvement of employees and the next generation of the workforce. The emergence of highly concentrated commercial centers and urban cores while maintaining continuity of services, programs and investments in rural communities has reached an imbalance that necessitates a more cooperative regional approach and delivery. Iowa is late to the game as contrasted with other states that have adopted their own responses, while at the same time the federal government has increasingly focused on large-scale resource distribution through regionalism. Regionalism is not the ending of county government or changing political jurisdictions; however it is the recognition that boundaries are artificial to the movement of goods, people, ideas, and transactions that rely on assets found in proximity to each other. When assessing Iowa’s capacity to commercialize and innovate from its inherent knowledge and know-how, we are concerned with the limited utilization of the academic asset-base. The unique academic and corporate research and development of ideas, products, services needing access to more global markets and investors has not been addressed in a more aggressive strategy by state 12
  • 13. and local economic development interests. The world comes to Iowa to participate in the Food Prize programs and events, and yet in turn there is little evidence of a more organized outreach to the world to promote Iowa’s economic and technological capabilities and knowledge. Iowa’s corporate base of domestic and international networks are an advantage that has not been tapped to its fullest. Finally, over the past decade, Iowans have sought to organize, plan, and create solutions to several threats to their economic prosperity through increased civic engagement and public-private partnerships. However, in their exuberance to address past and current challenges, the State has become fragmented with many agendas, missions, and ultimately competing goals. Such fragmentation has often led to miscommunications or lack of clarity about the end-point for the vital work and investment in long-term recommendations. Simply, the metrics and accountability for results may have become lost in the ‘doing’ – and therefore a review of progress and assessing tactics is necessary to achieve even greater success. Since several Council members are often called upon to lead, drive, invest, and sponsor the work of these various agendas, the Council could be a convening body for assessing the ‘doing’ with the results and outcomes. A Situational Analysis of Iowa’s Current Landscape and Economic Scenario Based on our analysis and assessment, we prioritized the key themes requiring on-going attention and measurement. In hindsight, the issues and challenges raised ten years ago led to ambitious and transformational actions. Ten years later, the ‘fundamentals’ still remain as unfinished business; for too long structural, operational, and economical impediments have Iowa placed as ‘stuck in the middle’ and with only incremental progress. To be sure, there is a resiliency that has allowed Iowa to not falter as significantly as others. Real estate, housing, financial, and retail sectors have seen better days, but have not plummeted, as is the case in Michigan, Wisconsin, and Illinois. Iowa is blessed as has been noted with an agricultural sector that is buoyed by global markets and new uses such as energy, organics, and consumer packaging. And academic institutions have increased funding for research, facilities, and equipment that allows them to attract competitive faculty and students to the State. With these data-points as a baseline for the Council’s examination of the current and future competitiveness environment, a set of metrics and indicators were presented and discussed with the Deputies of the Council. We first sought to define where Iowa leads, competes, and/or lags as contrasted with other states and nations. 13
  • 14. The challenge is to identify where Iowa must improve as well as sustain competitive scenarios. The Council and its partners want to ensure that competitive advantages do not slip against external forces of global competitors, new technologies and disruptive innovations, nor missed opportunities to attract or recruit participants in the supplier chains to Iowa. Increasingly, there are red flags that have emerged – warnings on the horizon about negative trends for the fundamentals in Iowa’s fiscal, financial, business, governmental, and organizational practices and policies. There is no replacement for assessing performance and having the honest, frank conversation about challenges, gaps, and in some cases politically difficult crossroads. Through Council hosted and/or sponsored forums, there has been agreement in the past with concurrence on ‘highest common denominators’ on which to coordinate resources, thinking, and implementation tactics. For instance, the Council introduced and the State responded to the suggestion from the Framework for Action that a six-sigma approach to reviewing practices and policies within departments and agencies. The creation the 14
  • 15. LEAN Collaborative is a successful approach to public- private partnership; by bringing the best practices of business reorganization to the day-to-day planning and budgeting of government services leverages knowledge and real-world, tested expertise. We have found that those states with competitiveness strategies continue and even expand programs such as LEAN during times of economic and fiscal turbulence. We commend the Iowa public sector for the adoption of LEAN, and encourage the use of a scorecard or competitiveness index (as noted further in this report) as a continuation down the path of coordination and collaboration among management and staff. To some degree, large organizations often fail to remember the original service intent or even review their mission statement to ensure successful implementation. If the indicators and performance are not improving, then continuing to do the same thing over and over again deserves to be questioned. Due to the budget and financial challenges at the regional, county, and local levels, adoption of similar metrics of performance as well as the role of the LEAN Collaborative throughout the State is encouraged. Several states have formed similar endeavors recently – Indiana, Virginia, Colorado to name a few but none are as sophisticated as Iowa’s LEAN initiative! By way of example of an expanded scenario for LEAN-type activities, Iowa State University in its recent reorganization of extension programs will more efficiently and effectively deliver services across multiple counties. These bold moves to address improving service delivery while maintaining a handle on budgets and expenditures during fiscal challenges must become the norm for Iowans. In our benchmarking exercise of best practices, the emergence of regionalism is another ‘norm’ appearing throughout the Nation. Defined as a seamless geography whereby economic activities, transactions, people, and resources flow easily across borders and boundaries, the federal government views regions as a preferred mechanism for delivering grants and contracts. Over the past four years of two different White House Administrations, a number of national competitions have been held that require ‘regional’ responses (surrounding commercial centers) to large-scale funding of workforce, scientific, infrastructure, housing, and economic development initiatives. It is expected that Congress will continue to support consolidation of programs by regions. 15
  • 16. The current perspective of ‘regionalism’ affords multiple counties and communities to leverage each other’s assets, institutions, infrastructure, talent pool, and operations to the mutual benefit of citizens and companies alike. Increasingly, federal agencies and programs are encouraging combinations of grants and delivery among transportation, infrastructure, housing, and economic development. 16
  • 17. From Clusters of Industry to Clusters of Knowledge: Iowa’s Competitive Advantages Ten years ago, the Council encouraged state and academic partners to adopt an industry cluster model based on the work of Harvard University’s Michael Porter and team that had examined robust economies around the United States. Currently the Financial Sector Cluster in Iowa has successfully attracted and built a value-chain of companies, suppliers, and talent to serve the needs of the national consumer and commercial insurance sector. Obviously the agricultural sector has continued to evolve its cluster profile, while the life sciences and biotech industry has slowly emerged to a lesser degree. Clusters, using the Harvard model, are aggregations of employment and wage concentrations within certain geography. The formation of clusters assumes that some elements of the economic outcomes will stay local while a majority of the goods and services are exported. Advanced Manufacturing tends to serve the needs of national and global markets – and as such sees increased value from accessing new markets in China, South America, and Europe. Therefore, a thriving and competitive cluster is marked by the increasing and sustainable market-share derived from exporting beyond the local geography. This is one factor for re-examining Iowa’s approach to economic development: we want to know what percentage of national and global market-share should be captured in Iowa’s clusters as a result of a healthy, competitive business climate. However, over the past few years, we have assessed cluster development at a level that focuses on occupations, skills, and competencies since industries have begun to converge through crossover technologies, crafts, and production. For instance, in benchmarking Iowa’s agriculture cluster, we examined the Northwest U.S. (Washington State, Oregon, Idaho, Northern California) and the Upstate New York clusters. In both instances we found skills once only identified in one cluster were now ensuring competitiveness in other sectors (e.g. Rochester’s skills in optics and imaging were now being used in food inspection, food security). 17
  • 18. In some locations, expertise in chemical manufacturing and production are now directly benefiting pharmaceutical and biologic developments. Historically the importance of rum and whiskey fermentation and production directly resulted in future clusters in Puerto Rico and Ireland for their global pharmaceutical economies. More recently, Southern California and Denver’s strengths in aerospace (and advanced materials) have directly attributed to design and manufacturing in solar and wind alternative energy clusters. Greater Kansas City and to some degree the State of Kansas as a whole hosts nearly 40% of the global market-share in animal research, testing and product development that led to the attraction of a recent $500mm federal laboratory and the recruitment of several global corporate expansions. Therefore, Iowa must Underpinnings of Regional Competitive Knowledge Models consider broadening its focus on clusters to include KNOW WHAT: Tacit existing linking critical elements of and emerging formal education, understanding, and ‘know-what, know-how, KNOW KNOW WHAT experiential learning and know-whom’ that WHOM KNOW WHOM: Networks of relationships in and beyond the emerge from an integrated, region; sometimes informal quick- KNOW HOW paced arrangements, sometimes KNOW HOW: Application of tacit knowledge multi-disciplinary and formal partnerships of distinct that combines existing approaches AND networked economy. The capabilities and teams of know what and how combined most importantly new innovations to address emerging challenges, solutions, and markets successful adoption of Industry Clusters based on Innovation Intermediaries: the Council’s work a decade - Link competencies, weave capabilities - Align threads of target economic opportunities ago requires a more in- - Strengthen, hasten collaborations depth assessment and - Build towards critical mass of people, expertise, resources, market builders upgrading of economic - Gauge absorption of demand by regional eco-system - Create and promote performance metrics, connectivity, and results strategic planning. The implications for Iowa’s future economic Source: New Economy Strategies, LLC development delivery are: • Greater coordination between the State’s workforce, higher education, economic development and transportation leadership, management, and strategic planning efforts in an executive branch-driven office similar to an ‘Iowa Jobs Cabinet’ • Interactions between business and academic human resource demands and the supply- chains for certifications, degrees, skills upgrade, and similar progress in a workforce continuum of activities and investments • Increased focus on recruitment and retention of students, faculty, researchers, technical talent, and a diverse workforce that is benchmarked against global standards of competency • Formation of networks across the State’s regional assets, institutions, and business/industry interests to monitor on-going resource requirements and investments based on knowledge accumulation – and then where knowledge can be applied towards new markets and opportunities from scientific, technological, engineering, and manufacturing expertise. 18
  • 19. Based on our review of current investments by academic, government and corporate Iowan interests against the backdrop of global trends and forecasts, we have identified five unique Clusters of Knowledge for consideration: 1. Advanced Niche Manufacturing: Industrial Design and Production of Products of ‘One - specialized customer demanded products will increasingly be produced in small batches through digital design, and manufactured in ‘clean factory shop-floors’ that connect to 24x7 distribution and logistics systems. At the same time, as existing product generations pass warranty stages and manufacturers no longer support repairs, specialized global inventories will seek niche manufacturers. 2. Bioenergy, Wind, and Other Alternative Forms Applied to Public and Private Sector Infrastructure and Spaces – from LEED certified facilities and smart grids, the opportunity to produce an array of energy from localized sources will create co-generation scenarios at or adjacent to end- user spaces (manufacturing, production, housing, hospitality, waste and sewage plants, etc.), thereby shaping the role of energy in the economy and society. 3. Medical Devices in Response to Aging and Human Revitalization (Nutrition, Neural Sciences, Motion) – as goes the rural aging scenario of Iowa so goes the larger ‘baby-boomer’ population facing increased threat of stroke, Alzheimer’s, and other related brain-function diseases that can be addressed through innovations in medical devices. Using Iowa’s strengths in manufacturing, addressing the demands for prevention and wellness, and linking clinical trials to unique populations, there are several scenarios for turning the State into a national node of scientific devices for human revitalization. 4. Information-Engineering: Analytics, Artificial Intelligence, Robotics – the infusion of smart technologies into operations and maintenance of major corporate divisions and product development teams has been matched by the advances in information architecture and engineering. High through put computing, cloud storage, and just-in-time inventory are finding near-term demands for cost reduction and efficiency in a globally competitive marketplace whereby foreign imports and products constantly threaten the U.S. Coupling information-engineering with logistics and distribution strengthens the opportunities in advanced niche manufacturing and specific markets in alternative energy and medical devices. 5. 21st Century Global Consumers: Connecting Market Intelligence and Digital Technologies with Every-Day Challenges and New Delivery Systems - the on-going demand for 19
  • 20. information has increased the need for more relevant use of “tools” that improve the outcomes from newly acquired knowledge and its application to every-day activities such as government regulation and fee payments, entrepreneurs and procurement by public and private sector buyers, commuters and transportation systems, teacher- student curricula and content development to name a few examples. These scenarios are not new; yet mobile/wireless platforms are changing the delivery and speed of adoption. And the adoption of such tools responds to demands for greater efficiency at lower costs to the consumer, patient, taxpayer, and/or citizen alike. These five unique Iowa clusters of knowledge leverage existing skills and investments, but also require a purposeful decision by the economic and workforce ‘communities of interest’ to determine if and how the State will compete in the years ahead. As an example, the State of Alabama determined that its core economic ‘competency’ (know-how) was Modeling and Simulation Technologies, impacting four traditional clusters of activity across private and public sector investments. By acknowledging its core competencies, states and regions build the communications and global ‘brand.’ If Iowa is to be a ‘go-to-location for future expansion or even consolidation of industry investment, there must be a sense of understanding and promoting its core competencies – the unique Iowan competitive advantage. While the Council is not nor should be seeking to choose where resources are applied by others, it could assist in shaping economic competitiveness by linking internal corporate market intelligence, long-range planning, and needs for labor and infrastructure with these trends and forecasts. Competitor states and nations have not picked ‘winners and losers,’ but have determined where the best returns on investment will result from targeted resource allocation by linking competencies, knowledge of markets, and product and service development to a stable business climate. Our guidance based on best practices in the U.S. is to seek greater alliance between skills, competencies, and talent development with growth industries, sectors, clusters, and global competitiveness. 20
  • 21. Goals and Recommendations: Addressing Challenges Through Benchmarking and Best Practices Upon identifying where Iowa could compete (or at least participate in the global competitive economy through trends and forecasts that lead to the five Targets of Opportunity), Regionnovate conducted a set of scenario-setting exercises with the Deputies Working Group of the Council. We in turn conducted benchmarking of comparative market development and best practices from around the Nation, leading to a number of options examined and external rankings discussed so as to prioritize where time, resources, and the State’s business, academic and public leadership could have best results around no more than five goals. Based on competitor states and regions across the U.S. and a handful abroad, the following goals were encouraged for further debate and discussion over the months ahead. These goals could be the subject of an Iowa Blueprint (and Competitiveness) Forum and the work of Action Teams responding to the need for more alignment and coordination among interests. Goal No. 1 – Go To Location for Business Relocation, Expansion, Consolidation and Innovative Startups Critical because Iowa must expand its business engines for employment and investment by communicating and branding the State as a location of choice Potential Tactics: Targeted Sector Value Chain Recruitment; Leverage Clusters of Knowledge across Interdisciplinary Capabilities of Industry and University; Incentivize Early-Stage Capital Formation for Investment in New Products and Ideas– all new ways of approaching economic rebuilding and sustainability What is Required: Encouraging the Governor-elect to transform state and regional economic development strategies and tactics by assessing the current State delivery of economic development while at the same time exploiting the work of the private and academic sectors in the Iowa Innovation Council’s vital efforts to date Goal No. 2 – Globally Competitive Regionally focused Commercial Centers or Hubs of Economic Activity Critical because concentrations of economic productivity are increasingly organized by regions not by individual counties nor cities Potential Tactics: Create Regional Centers of Innovation and Competitiveness that combine all of Iowa’s counties and communities into seamless regional operating models Institutions, Industry Councils, and regional workforce and service delivery representatives to define21 What is Required: Coordination of Executive and Legislative Branch with Chambers of Commerce, Academic proximate demands and needs into more efficient operating models
  • 22. Goal No. 3 – A Diverse Workforce and Population with Global Industry Readiness as its Core Critical because the more diverse a workforce and population, the more productive the outcomes, relationships, and networks: How We Could Get There: Recruitment for Global Excellence; Build Partnerships with Targeted Population Home Countries; Increase Foreign Language Requirements; What is Required: Linking the State’s workforce, economic, and education agency data and program planning units in an Iowa Jobs Cabinet Goal No. 4 – Highly Regarded Efficiency in the Delivery of Government Administration, Services, Operations, Facilities, and Information Critical because excessive government employment and spending on non-productive delivery waste precious resources, limits innovation, and ultimately devalues entrepreneurial behavior How We Could Get There: Adopt Regional Planning and Shared Service Program Competitions for Public and Private Sector Partnerships What is Required: formalize the Iowa LEAN Collaborative to include county and local governments through a Commission structure that holds annual competitions in key elements of governance, thereby receiving support through technical assistance and program resources towards long-term implementation from savings. Goal No. 5 – A National Leader in Pre K-20 Education and Training – Focusing on Youth and Student Competitiveness Critical because Iowa’s slow slide in critical STEM scores and graduation rates for college foretell an emerging gap in meeting the future demands for talent and workforce How We Could Get There: Form the Iowa Skills Continuum among Education, Workforce, and Economic Development Agencies, Programs and Service Providers with a special emphasis on mentoring, tutoring, interning, and launching of capabilities, ideas, and knowledge What is Required: Leverage the Iowa Business-Education Roundtable’s existing framework, as well as the current efforts the EPSCOR and STEM coalitions across the State ______________________________________ With these goals as milestones along the road to a competitive Iowa, the following recommendations for large-scale actions (or Big Ideas) could transform the economic competitive landscape for this and future generations of Iowans. By then linking these recommendations with specific Implementation Plans through the Action Teams as well as a report card, or competitiveness index, we believe the Council will have catalyzed breakthroughs in a number of challenges already identified throughout the Blueprint. On the next three pages, we have outlined several critical challenges facing Iowa, made initial recommendations for consideration, and in turn have provided best practices from benchmarked states and regions. These are starting points for consideration by the Council’s membership and affiliated partners, institutions, and organizations. 22
  • 23. Current Challenge Recommendation Benchmark Case Study Education: the ability of Iowa Unite under a statewide banner on Pre-K through 20 “Oregon Business Education Compact’ seeks to connect businesses to succeed in the by formalizing the Iowa Business-Education classroom and workforce with hands-on innovative competitive world marketplace depends Roundtable in partnership with the Governor and learning experiences for students and teachers, while on the constant upgrade of skills and Legislature creating and leading working partnerships with business and education, as well as advocating for quality education knowledge of its workforce in the State. Health and Well-Being: a primary Explore a more formal Employer-Employee Health Healthier WY’ is a statewide wellness campaign in its third indicator of the well-being of a state is and Wellness Campaign by supporting the work and year focused on incentivizing members of the State the health of its people by diminishing implementation of the Iowa Wellness Council and Employee/Retirement funds along with similar impacts from disease, illness, and long- the Health Care Collaborative government employees at the local levels to participate in discounts, rewards, contests, and online tools for term care effecting productivity and reducing a nearly 300% jump in health care costs for costs public employees. Arizona’s First Things First campaign focused on early childhood health and education through cross-system coordination of federal, state, local roles and responsibilities with a public metrics report due each year. Tomorrow’s Workforce: A growing, Re-emphasize the recruitment, attraction, and Minneapolis-St.Paul has hosted for twenty-two years its skilled, and culturally varied population retention of a new generation of Iowans for securing annual ‘Diversity and Inclusion Forum’ in partnership with enhances Iowa’s business case for a talent pool around stable careers and economic national and state associations, and major corporate growth and global competitiveness opportunities human resource and diversity officers in Minnesota. In turn, the Forum has sparked a statewide agency initiative for recruitment and attraction of diverse workforce talent. Economic Growth & Opportunity: the Review the current model of statewide economic Texas, Kentucky, Pennsylvania, Ohio have adopted collective input of industry and development delivery and improved coordination regional centers (“RCICs, Centers of Excellence, Ben commerce along with the earning ability and collaboration across agencies, programs, Franklin Centers, Edison Centers, respectively) of of the state’s workforce gauge Iowa’s regional interests, and most importantly data commercialization, innovation, and economic collection, business intelligence, and market development by leveraging existing programs and overall vitality competitiveness monitoring operational infrastructure through competitive grants and contracts aligned with specific metrics of performance.
  • 24. Georgia, Utah, Arizona, and Washington State have created online databases of researchers, papers, patents, Catalyze, in conjunction with the Innovation Council, innovations, and resources for new products and services. the Iowa ‘Community of Innovators and Global New Zealand and Great Britain have sponsored, through Knowledge Network’ through a digital portal and national economic development organizations and the resource toolkit by expanding the current IBC- private sector global, networks of alumni, experienced sparked Entrepreneur Portal on the IDED website executives from their respective countries, and over 22,000 and 7,800 respectively profiles of interest in corporate and market opportunities. Infrastructure: Investment in Advocate for continuous improvement, North Carolina’s ‘Statewide Connectivity Strategy’ is a transportation, energy, and upgrade, and coordination of public sector comprehensive technology infrastructure road map technological infrastructure has far- investment in Iowa’s infrastructure tied to created by the Office of the Governor and Controller, the reaching effects on Iowa’s economy, commercial centers, industry sectors, academia, university and community college systems, local government, and partnerships among local telephone and competitiveness in the world and growth-oriented opportunities IT providers. Georgia’s Statewide Energy Plan focuses on marketplace, and the quality of life in energy reliability, supply-demand, education, incentives, our communities and economic development with annual tracking and specific statewide and regional metrics. Fiscal Policy: Promoting accountability, Restore the IBC-inspired LEAN Enterprise Office Indiana’s MySmartGov.org represents several years of efficiency, and long-term stability in within the Governor’s Department of work by the Commission for Local Government Reform State and Local finances and budgeting Management, and leverage the current Iowa seeking among other objectives to reduce small scale fosters a sound environment for Lean Collaborative by expanding across state, service duplication, restructure school districts, and realign government operations. Similar endeavors can be economic growth county, and local public sector offices for found in New Jersey’s Joint Legislative Committee on ensuring efficiency and effectiveness of Government Consolidation and Shared Services (and its government spending, budgeting, and resource Local Unit Alignment, Reorganization, and Consolidation allocation Commission), Ohio’s Commission on Local Government Reform and Collaboration, and NY Local Government Efficiency and Competitiveness. 24
  • 25. Government Operations and Services: Assess and benchmark successful ‘regionalism California has led the Nation with its Economic Leadership the administration of government models’ for workforce, economic development, Network formed by public-private partnerships in systems enables commerce to operate and business service delivery to determine what regionally-focused economic development, cluster and and compete seamlessly and effectively has worked among commercial centers in other worker driven collaborations, and alignment of statewide infrastructure to cluster demands. In turn, the States of across multiple programs and states and nations Georgia, North Carolina, Tennessee and Mississippi have geographies, thereby minimizing delay instituted ‘Rural Communities’ initiatives to focus and duplication planning grants and implementation technical assistance on improving the economic futures of rural counties and cities. The work of these states has been driven by ‘vitality index’ reports on poverty, clusters, multi- jurisdictional savings, and mindset for cooperation across boundaries. 25
  • 26. Next Steps: Priorities for Implementation Historically, the Iowa Business Council has long held a strong belief in the future growth prospects of it State, people, and institutions. Each member firm and academic campus has made its commitment known for seeking all available pathways to a vibrant business climate, an innovation-based economy, and a world-class workforce able to compete on a global scale. The ability to create sustainable personal and business income growth for Iowans is critical to the transformation of the overall economic engines of employment and current sectors, including those sectors that are dependent upon public resources (such as government operations). In previous endeavors, the Council was encouraged to first and foremost turn to the private sector for taking action and completing implementation of recommendations. In our experience in over 100 engagements in the U.S. and abroad, we have not looked to the public sector or government for all the answers. And yet we recognize that ‘going it alone’ does not build the sustainable foundation on which to successfully address challenges nor implement recommended actions. A decade ago, the Council identified challenges and gaps in the economic landscape that would limit competitiveness, and then sought the inclusion of and engagement with several non-Council entities and interests, including the Executive and Legislative branches. Yet, it looked to its own civic and corporate leadership to step forward initially. These eight recommendations include elements already being implemented at various stages of progress. Through a more formal process of facilitating expertise, leadership, and institutional know-how, we strongly encourage the Council to bring together disparate, often fragmented groups and initiatives for a Blueprint Forum to discuss these findings and spark a fast-paced planning process.
  • 27. In the previous Framework for Action, a set of ‘Hot Teams’ was empowered to design immediate plans, metrics, and organize the champions and resources for execution so as to ensure progress. In this manner we believe driving results will have a greater chance by concurrence on the metrics and performance necessary among all interests by the Council’s leadership through convening action- oriented teams and catalyzing accountability for performance. The adjacent schematic represents a Blueprint pathway forward. 27
  • 28. Endnotes and Referenced Materials I. Challenges Demographic Challenge, page 3: Iowa Workforce Development, Iowa State Data Center, U.S. Census Bureau, Population Division, 2008-2010; Iowa Population Reports, Components of County Population Changes, 2000-2009 Economic Prosperity Challenge, page 3: Iowa Workforce Development, Iowa State Data Center, 2008-2009 Economic Prosperity Challenge, page 5: Iowa Workforce Development, Iowa State Data Center, 2010 College Graduation Challenge, page 7: Iowa Department of Education, U.S. Department of Education, National Assessment of Educational Progress annual survey, 2008-2009 College Graduation Challenge: page 7: Iowa Department of Education, U.S. Department of Education, National Assessment of Educational Progress annual survey, 2000-2009; ACT College and Career Readiness Report, 2009-2010 Fiscal Challenge, page 8: Outstanding Debt by Security Type, Entity, and Purpose for Iowa State and Local Government 2006-2009, Office of the State Treasurer, Reports Legislative Services Agency Fiscal Challenge, page 8: Recovery.Gov (U.S.), State ARRA Expenditure Reports; State and Local Expenditure reports, Iowa Legislative Services Agency, Fiscal Services Division (2007-2010) Economic Prosperity Challenge, page 9: Statewide Projections 2006-2016, Labor Market and Economic Research Bureau, Iowa Workforce Development; Iowa Manufacturing Report, Iowa State University Extension Program, April 2010. Economic Prosperity Challenge, page 9: Statewide Projections 2006-2016, Labor Market and Economic Research Bureau, Iowa Workforce Development Market Access Challenge, page 11: U.S. Census Bureau, Foreign Trade Division; Iowa State Data Center, Report on Top 25 Commodities Based on 2009 Dollar Value, 2009 Demographic Challenge, page 11: U.S. Census Bureau, Population Division; Iowa State Data Center, 2003-2010 Economic Centers Challenge, page 11: U.S. Census Bureau, Population Division; Iowa State Data Center, Report on Population Estimates and Numerical Changes for Iowa’s Incorporated Places by County, 2000-2008 Pre K through 12 System Challenge, page 12: Iowa Department of Education; U.S. Department of Education, National Assessment of Educational Progress annual survey, 2008-2009 Fiscal Challenge, page 12: Surrounding State Tax Rate Comparison, Federation of Tax Administrators, Office of the State Treasurer Governance Challenge, page 13: Legislative Services Agency, Fiscal Services Division; Iowa State Data Center; Iowa Workforce Department 28
  • 29. Fiscal Challenge, page 13: Outstanding Debt reports (Office of the Treasurer); U.S. Census Bureau, Population Division reports; Iowa Workforce Department Infrastructure Challenge, page 14: “Iowa Infrastructure Spending, FY 2010,” Iowa Legislative Services Agency, Fiscal Services Division Demographic Challenge, page 14: U.S. Census Bureau, Population Division; Iowa State Data Center, 2000-2009; Iowa State University Center for Industrial Research and Services Economic Prosperity Challenge, page 15: U.S. Census Bureau, Foreign Trade Division; Iowa State Data Center, Agricultural Exports, 2000-2009 II. Charts & Graphics “From Commitment to Action”, page 4; reference: Framework for Action, 2001, Iowa Business Council Summit, Facilitation Guide (“Achieving Results”), Richard Seline, New Economy Strategies, LLC. “Evolution of the Role of Economic Development Strategies,” page 10; reference: “Clusters of Knowledge and Competency,” briefing paper, Richard Seline, New Economy Strategies, LLC. 2007 “Clusters and Competitiveness, Houston Oil and Gas Products and Services Cluster,” page 15; reference: Harvard University, Institute for Strategy and Competitiveness, Dr. Michael Porter, “Cluster Report for the Greater Houston Partnership, 1999” “Underpinnings of Regional Competitive Knowledge Models,” page 16; reference: New Economy Strategies LLC., Richard Seline, 2008 “Collaboration Among Clusters,” page 17; reference: Richard Seline, 2003 “The Knowledge Economy – Clusters of Competency,” page 18; reference: “Clusters of Knowledge and Competitiveness Road Map for the State of Alabama,” Alabama Economic Development Partnership, 2005-2006, New Economy Strategies, LLC. III. Additional Referenced Materials Over 140 reports, white papers, analytical briefings, and data-set sources were reviewed by Regionnovate LLC for the production of the Blueprint. This source material included approximately 35 reports conducted at the national level inclusive of ranking and benchmarking Iowa to peer states regionally and nationally. At the outset of the engagement, Regionnovate reviewed the past five years of reports prepared by in-state institutions and organizations as well as items contracted by the Departments of Workforce and Economic Development. An internal web-based ‘knowledge sharing space’ was created for the Iowa Business Council Deputies and membership to review the entire collection of information used to form the basis of findings and recommendations in the Blueprint. Several matrices were generated to form the Challenges ‘text boxes’ and for purposes of space, only a fraction of the data-points were used herein. A copy of these matrices and overall collection highlights is posted on the Council’s website for review. 29
  • 30. APPENDIX Intention and Impact for Measuring Performance and Accountability: A Competitiveness Index, Scorecard and/or Dashboard The work of the Iowa Business Council in making its ‘Case for Change’ in 2001 signaled the interest in identifying a handful of challenges and opportunities on which the collective business community could have an impact. Through an exhaustive process of data analysis and assessment, the Council formed action teams around prioritized goals based on a day-long summit held at the University of Northern Iowa and attended by over 75 business, academic, entrepreneurial, and civic organization leaders. In reviewing its work from nearly a decade ago, Regionnovate has sought to determine if ‘the needle has moved’ on a number of critical indicators – and what remains to be done by the private sector, in partnership with the public sector and economic development interests, as well as what could be encouraged as possible action steps for mitigating negative trends and/or establishing new frameworks for leveraging Iowa’s assets and advantages. Clearly, an initial step for reviewing where Iowa has been and where it must go as a State, an economy, and as a global competitor for growth and prosperity requires measuring progress and performance. Some thirty other states and hundreds of regions and communities across the Nation have used an annual performance scorecard, report card, or index as a means of ensuring actions lead to results. Therefore, we are suggesting, through this draft outline of a ‘Competitiveness Index’ to shine light on successes as well as highlight where attention, leadership and investment remain. Taking Action in Times of Turbulence Since the beginning of the so-called 2007-2010 Great Recession, the instability of markets, economies, and government engagement marks a new time of turbulence for Iowa and the Nation. Such uncertainty often creates discussion and debate about more immediate issues, and leaves long-term problems for another day. However, Iowa has been a state in transition for nearly twenty years, and as many indicators suggest, Iowa is ‘stuck in the middle’ of the pack in certain measures that unless more attention is given to addressing these challenges, the more it could slip further behind. All the while, Iowa has received very positive attention in national media rankings – primarily focused on individual cities or communities rather than the entire breadth of the State. Such bad news-good news dynamics have been taken into account in the formation of the draft index outline. Being Held Accountable for Immediate, Near-Time and Long-Range Results By suggesting the creation of a Competitiveness Index, certain assumptions have been formed: not only would the Council seek to promote the concept that ‘we act towards what we are measured’, but that accountability is defined as taking the action and completing the implementation – even when no one is watching. Simply, the indicators and metrics found throughout the draft Index require a collaborative model for response and ‘ownership’ of the results among various entities, institutions, and organizations. At the same time, the Council is encouraged to involve other end-users of the Index to 30 identify their roles, responsibilities, and results-oriented strategies to ensure that the State’s competitiveness ‘needle’ does move in the appropriate direction.
  • 31. Selection of Metrics, Indicators, and the Role of Rankings A robust discussion and debate has been held among a working committee of the Council membership on the appropriate metrics and indicators to measure performance. We were, as could be expected, influenced at first by well over 30+ different rankings of Iowa by external sources. The consensus has been to observe these rankings, understand the methodology and analysis behind each ranking, and then to determine how Iowans seek to measure themselves and on which key elements. Rankings provide an insight to how others perceive Iowa and its economy - and in observing these annual reports, magazine articles, and briefing materials – we find value in recognizing that external validation or even warning about the current direction should be a part of the consideration for action taken by end-users. However, a number of the rankings cause confusion when competing measures suggest that Iowa is ‘great, good, or bad’ across the same themes. For instance, a number of rankings suggest that Iowa is either a hospitable state or a very negative location for ‘Doing Business.’ After delving into the data and information used to form these rankings, we determined that it was best to identify metrics and indicators that – when standing alone – could provide insight as to the necessary direction of the ‘needle’ on Iowa’s current and future competitiveness. Finally, the metrics and indicators selected for the draft Index require a comprehensive assessment of intended goals and progress for economic growth and prosperity. Assessing the themes across silos should be encouraged since Fiscal Policy and Education, or Governance and Economic Growth for example impact planning, operations, and investment by both private and public sectors. How Other States Use Indicators, Metrics, Performance Measurement Several of the Iowa Business Council’s peer organizations have directly or indirectly driven performance measurement at the state and regional economies for their members and partners. For example, one of the most extensive initiatives is in Oregon: “The Oregon Progress Board is an independent board created by the Legislature in 1990 to monitor the state's 20-year strategic vision, Oregon Shines, and keep it current. The 12 member panel, chaired by the Governor and made up of citizen leaders, reflects the state's social, ethnic and political diversity.” The Progress Board, recently defunded due to severe fiscal challenges in the State, has spawned several organizational partnerships to maintain the performance metrics system through the public sector as well as to engage in citizen-supported indicator reports and forums. Further, Oregon has continued to use a robust online dashboard (found at http://benchmarks.oregon.gov/) to engage the broadest interest for its economic and governance strategies. The long-term impact for Oregon and its regions has been cluster-focused economic developments supported by a constantly monitoring of the health of the State’s people, infrastructure, and business environment. Similarly, the Michigan Turnaround Plan was driven by the business community seeking to prevent the State’s fiscal and employment challenges causing further damage to the long-term prospects of company growth and retention. An exhaustive assessment of the business-case issues facing the private sector was coupled with a number of metrics on the top critical factors negatively impacting employment as well as benchmarks against competitor states with similar profiles in manufacturing, operations, and innovation capacities. The Turnaround Plan is considered the pivotal document used during the 2010 election cycle, and has been broadly distributed to legislators, local elected officials, economic organizations and chambers of commerce. The Plan’s metrics are driving fiscal policy-making. 31
  • 32. Useful Tips for Reviewing the Draft Competitiveness Index Regionnovate suggests that an Iowa Index should present metrics as ‘Then’ (2001/2002) and ‘Now’ (2009/2010 or latest data availability). Projections for future years should be noted in descriptions of ‘Impact on Iowa’ since information on trends and forecasting can provide useful insights for near-term planning. By linking the past and current with future trends, the powerfulness of the action, response, solution created can be determined over a period of time. Many of the challenges found in the Blueprint cannot, of course, be changed overnight. By assessing progress over a ten-year period, the Council and interested parties should take into account a number of ‘environmental’ scenarios that have impacted the Nation as a whole and Iowa specifically. For instance, while the current recession has devastated several mid- western regions and communities, Iowa has been resilient to significant drops in housing and real estate sectors. While no one could predict the unfortunate losses due to weather and flooding for many of Iowa’s cities and towns, current rebuilding offers unique opportunities to fix infrastructure and facilities with new technologies and systems as well as find boundary- crossing solutions for multiple communities affected by these disasters. And in doing such rebuilding, an opportunity exist to align outcomes and impacts with clear measures of how operations and infrastructure assist the business climate and competitiveness. Other so-called ‘assessing impact through scenario setting’ for Iowa must include the results of the short-term funding of programs through the federal Recovery Act, national security or terrorists threats, and disruptive technologies and services that shift sometimes daily through innovation. Therefore, in using the Index, the uncertainty – the turbulence – of our times should provide perspective that these are mileposts for consideration rather than hard-and-fast ‘rules’ that cannot be adjusted over time. The indicators outlined on the following pages align with the findings, goals, recommendations noted in prior sections, providing aspirational end- points for measuring success or reminding Iowans of remaining work to be done. One final perspective on a draft competitiveness index centers on the types of actions that are being measured. The tougher measurements are often those that seek to impact mindset, culture, transformation, and response to change. We know that measuring academic performance and related test results is a clear demonstration of progress in STEM instruction, however parental involvement in supporting graduation from high school, community college, or a four year university are vital to the prospects for addressing this challenge in Iowa. We know that measuring the number of public sector employees at the state and local levels describes employment patterns in government services, and yet measuring the willingness and related incentives to find innovative means of program delivery signals adaptation to budget reductions. Simply, a competitiveness index can ‘keep score’ in certain ways but also requires measuring so-called soft-skills that are just as if not more important to the Blueprint goals. These alternative metrics require further discussion to ensure implementation of recommendations are sustainable well into the future based on accountability and purposeful decisions to change performance results. 32
  • 33. Economic Growth & Opportunity Indices Goal: The ‘go to’ location for business relocation, expansion, consolidation, and innovative startups Metric: Overall Gross State Product What Does It Mean: The accumulation of data on what drives an economy is comprised of several factors including employment, wages, investments, assets, and revenues/sales. What is the Impact on Iowa: Our underpinning sector – Agriculture – has provided an important buffer for declines in other sectors. Yet, by concentrating on industry clusters as an economic development strategy, we have been able to attract and expand the Financial Services and Information Technology sectors. Such diversification is vital to long-term prospects. Metric: Non-Agriculture Employment Growth What Does It Mean: A portfolio of industries, firms, and businesses as well as non-profit, academic, and government employment secures an economy through the turbulent times. However, if the mix of sectors is not fully balanced or there is not enough growth in incomes, revenues, sales, then external forces can ‘control’ the fortunes of a state. What is the Impact on Iowa: Through the work of the Innovation Council and the prior work of the Iowa Business Council around industry clusters, new opportunities for employment are being discovered. All the while opportunities for retrenchment of existing corporations from China and abroad back to the U.S. are on the rise. Making Iowa a location choice is now critical for future growth. Metric: Manufacturing as a Percentage of Gross State Product What Does It Mean: Manufacturing is a mainstay occupation for a growth-oriented economy, and as global competitive has led to the off shoring of these jobs, retention in Iowa becomes vital What is the Impact on Iowa: Since agricultural occupations are often counted as a part of the manufacturing supply chain, without these jobs, Iowa’s economy would have been harder hit in the recession. In turn, the lack of new manufacturing occupation opportunities signals challenges. Metric: High-Tech Employment and Wages Per Population What Does It Mean: With the transition of industry sectors and clusters towards more technology- intensive employment, any state that is lagging behind national or global trends could slip further What is the Impact on Iowa: Unless the pipeline is created with more technically-skilled graduates and/or the attraction of new citizens with such skills, Iowa will not be considered as location for expansion, relocation, or even internal growth of future industries Metric: Access to Investment Financing and Business Incubation What Does It Mean: The attraction of external risk capital as well as that created among in-state groups coupled with services, facilities, and operations to support new enterprises is a competitive advantage What is the Impact on Iowa: While academic R&D funding has risen, existing industries continue to innovate, and fiscal policies are in place, Iowa continues to lag behind in its capacity to launch new products, services, and technologies from entrepreneurs 33
  • 34. Education Indices Goal: A national leader in Pre K through 16 education, readiness, scientific application of Iowans Metric: Science, Math and Reading Scores – 4th versus 8th grade What Does It Mean: Progress in retaining achievement for critical learning What is the Impact on Iowa: With little or no movement over a ten-year period, Iowa has not achieved a standard of excellence required for competing on a global level Metric: State Spending per Pupil What Does It Mean: Year-to-Year investment in educational progress. Requires breakout of spending on infrastructure, personnel, materials, and other elements impacting scores, student retention, and long-term value of current instruction What is the Impact on Iowa: Correlation between score indicators and expenditures often informs the progress of classroom instruction Metric: Educational Attainment by Population Over 25 What Does It Mean: Significant drop-off from High School rates to the number of students continuing their education in a two- or four-year setting What is the Impact on Iowa: There must be a concerted effort for informing, engaging, and encouraging parents and students towards obtaining college certification and degrees as a long-term economic value Metric: Total Funding (including Research) on Higher Education Campuses What Does It Mean: Through peer-reviewed grants, sponsored research programs, philanthropic gifts, and other funding mechanisms, universities provide the brainpower for the Knowledge Economy from faculty and students as well as regional engagement with the private sector What is the Impact on Iowa: Such significant increases in funding – especially federal grants and contracts – to Iowa’s institutions has assured a pipeline of ideas, technologies, and brains for commercialization and solving grand challenges facing Iowans such as health and wellness, energy, and technology adaptation for older industries. 34
  • 35. Demographics and Diversity Indices Goal: The preferred destination for a diverse workforce and population with global industry marketability as its core Metric: Net Migration to Iowa What Does It Mean: Increases in population choosing the State as a place to live, learn, and earn indicate perception of opportunities found here rather than other locations What is the Impact on Iowa: A low net migration in correlation to a low birth rate signals future challenges in workforce supply, potential increases in labor cost, and a less ‘global’ appreciation for cultures, languages, and markets Metric: Age of Population by Demographic Group What Does It Mean: Over the past ten years, Iowa has become a ‘bar-bell’ state – Younger on one- end, Older on the other – with average to below average growth in the middle What is the Impact on Iowa: Cost of services for these two disparate age groups will only increase in health care, education, social service expenditures Metric: Percentage of Students Learning a Foreign Language What Does It Mean: As globalization of markets continues, those states and communities with programs focused on international learning including foreign language components tied to Asia, South America, and Europe are viewed as competitive What is the Impact on Iowa: Given the number of domestic and global firms based in Iowa, the need for highly-skilled students with foreign language proficiency will directly impact the growth of markets, new product sales, and expansion of exported goods Metric: Investment in Diversity Programs by Public and Private Sector Sources What Does It Mean: Participation in diversity programs at the corporate and government levels assures the necessary actions are being taken to identify, provide for, and connect with populations across age, nationality, experience levels. What is the Impact on Iowa: A number of Iowa corporations already have highly-regarded diversity initiatives tied to human resource officers and senior executives with responsibility for workforce and skills development. By acknowledging the level of resources committed to such programs gives credence to the value and sustainability of openness. 35
  • 36. Health and Well-being Indices Goal: One of the healthiest states and people in the Nation Metric: Obesity Rate of Children Age 10-17 What Does It Mean: Predicator of long-term health challenges for future generations as less healthy citizens influence cost of Medicare, other public and private insurance, employment and productivity, and indirectly housing and transportation costs What is the Impact on Iowa: With a corresponding young population comes the need to focus on long-term health and well being so as to prevent future illnesses and diseases in both urban and rural Iowa. Current hypertension, heart, and cancer related illnesses in older populations correspond to obesity rates of generations borne in the 1950s-1970s. Metric: State Overall Health Expenditures Per Capita What Does It Mean: The public expenditures on health care have jumped in some states nearly four fold according to the Pew Charitable Trust and the Robert Wood Johnson Foundation. Those locations with strategic health programs for prevention, immunization, awareness and training have also seen corresponding improvements and benefits to their citizenry including reductions in smoking, transmitted diseases, and obesity related illness. What is the Impact on Iowa: Proportional increases in health expenditures without side-by-side recognition of immediate and long-term impacts, where such expenditures could be better targeted, and otherwise the lack of a future strategy against trends leaves Iowa vulnerable. Metric: State Expenditures on Medicaid What Does It Mean: Medicaid as a federal program for under-served populations requiring health and social services continues to increase across the Nation, and as such is putting increased pressure on state budgets What is the Impact on Iowa: Based on the expansion of health care for all citizens, and the increase demand for certain coverage to younger as well as elderly citizens, Iowa is expected have 25% jump in Medicaid expenditures this year, and a steady increase of 15-18% annually thereafter Metric: Percentage of Children Living in Poverty What Does It Mean: With changes in demographics and economic opportunity, the number of children facing financial challenges at or below poverty foretells future demands on services in health care, education remediation, crime, and other public services. What is the Impact on Iowa: Though the State has an unemployment rate below the national average, any increase will extend the impact on children living in poverty. Expanding employment opportunities for parents is a direct influence on reductions in poverty. Metric: Percentage of Citizens Covered by Private Health Insurance What Does It Mean: Availability and utilization of private health care insurance leads to healthier families, modernized services and facilities, and long-term well-being through preventative medicine, exercise, and related health benefits that lower costs over time What is the Impact on Iowa: The offering of health-care benefits to employees and their families continues to be a positive aspect of human resource recruitment and attraction given the increases in health care costs. 36
  • 37. Infrastructure and Transportation Indices Goal: The home of globally competitive commercial centers leveraging Iowa’s public infrastructure in transportation, energy, information, and research. Metric: State Investment in Infrastructure as Percentage of Debt What Does It Mean: On what areas of spending a state utilizes its debt – especially in new versus maintenance/repair of infrastructure and transportation - signals the modernization of key assets for competitiveness in the movement of goods, people, and ideas What is the Impact on Iowa: Where the State determines to place is investment of debt as well as formula funded federal grants and contracts strengthens commercial centers of economic activity by the long-term needs for infrastructure. In turn, patterns of public sector infrastructure investment often impact general real estate, housing, education, retail/trade, and operation decision-making for site location. Metric: Access to Airports/Airline Services for Business Travel Connections What Does It Mean: As air travel becomes linked to increased domestic and international markets, a state needs airports that are well connected to airlines serving those emerging centers of commerce What is the Impact on Iowa: the ability to prove to a shrinking number of airlines serving Iowa that it can sustain the demand for seats going to specific markets and regions is critical to both Metric: Projected New Miles of Highway/Roads by Population Density What Does It Mean: Where a state or region plans, constructs and maintains its infrastructure relative to population demand corresponds to the transportation needs of employees, employers, commuters, and education providers of the K-16 system as well adult learners. What is the Impact on Iowa: Forming a long-range planning process for transportation based on commercial centers and the growth along key corridors will impact financing of new highways and roads in concert with housing development, education institutions, warehousing, and retail demand. Metric: Broadband Infrastructure and Utilization What Does It Mean: Increased traffic on the Internet for business, education, government services, and civic networks responds to the needs of 24x7 economies, globalization, and the attraction/retention of students seeking robust digital communities What is the Impact on Iowa: Based on Iowa’s lag-time to deploy broadband networks, WIFI, and other information architectures designed to foster business-to-business, citizen-to-government, and community-to-community of interests puts the State behind the curve for technology adaptation and competitiveness. 37
  • 38. Fiscal Policy Indices Goal: A public sector grounded in, and annually compliant with, principles of sound budgeting, resource allocation, and impact on the competitive business climate Metric: Budget Deficit as a Percent of Tax Revenue What Does It Mean: The gap between revenues generated (through taxes, fees, other charges), and expenditures on services, infrastructure, debt payments signals the need for reductions in the imbalance by efficiency strategies, new revenue sources, alternative delivery models, and/or program elimination. What is the Impact on Iowa: Though Iowa has a tax policy that covers a broad range of industries, businesses, and professional services, increases in Medicare and Local Expenditure Support acerbate the resolution of the gap. And the end of short-term funding from the federal Recovery Act and Disaster Relief Programs provides additional concern. Metric: State and Local Debt Levels What Does It Mean: National trends show that County and Municipal Debt has risen over the past decade – often in locations where populations are in decline and revenue generation from the private sector has been reduced. Therefore, bond servicing and financing of local government is under increased scrutiny for default or renegotiations. What is the Impact on Iowa: The value of increased debt service against marginal at best growth in revenue generation by local governments throughout Iowa is a warning sign on future state expenditures required to subsidize new growth in certain locations and steady declines in other communities. Metric: State, Local Taxes Per Capita What Does It Mean: The tax burden on citizens and businesses against their incomes and revenues indicates whether government expenditures are in alignment with sustainable resources on which to continue to tap for service delivery at the same historical levels. What is the Impact on Iowa: State tax policy – including credits to spur investment and industry sector growth – are considered by some external assessments to be appropriate while other reports judge Iowa at the bottom for its tax climate. Metric: Counties with Decline in Population AND Increase in Debt What Does It Mean: Indicates the borrowing pattern of a local government to maintain service levels or respond to increased demands for certain services for a population that is declining in its capacity to produce What is the Impact on Iowa: Productivity by agricultural sources in many counties remains the highest source of revenues as does transfer payments from federal and state programs directly to citizens. As noted in the Demographic and Diversity section, the correlation between population growth and fiscal policy are immutable and clear. 38