More Related Content
Similar to Investigation05 en
Similar to Investigation05 en (20)
Investigation05 en
- 1. Biology teacher support material
Investigation 5
Designed Lab
Metabolism of Yeast in Different Temperatures
Research Question:
How will the different temperatures (5 C° 26 C° 40 C° and 80 C°)affect the amount of CO2
produced by the reaction of yeast?
Hypothesis:
If the temperature is increased, the enzymes present in the yeast solution will gain the
energy from the heat to overcome the activation energy. Also, the average kinetic energy of yeast
and glucose will increase. Therefore, the rate of reaction will be increased and CO2 will be
produced more at the higher temperature.
Variables:
Independent: temperature of yeast solution and glucose solution
Dependent: metabolism rate and the amount of CO2
Controlled: room temperature, atmosphere, temperatures of solutions, gas sensor
Materials:
CO2 Gas Sensor
Hot plate
Thermometer
Four 200ml beakers
Three 10ml measuring cylinders
Three syringes
Eight test tubes
Distilled water
Ice cube
Four thermometers
Stop watch
Yeast
1% glucose
Procedure:
1. Prepare four 200ml beakers with 150ml of distilled water
2. Place two of the beakers on the hot plate, and increase the water temperature until 80 C° and
40 C°
3. Leave the third beaker at the room temperature, and put ice cubes in the fourth beaker to
lower the temperature until 5 C°
4. Meanwhile, prepare four sets of 15ml yeast solution and 9ml 1% glucose solution in each
different test tube; use measuring cylinders and syringes to measure the amount of each
solutions
5. Place each set of 15ml yeast solution and 9ml 1% glucose solution in the beakers with
different temperatures, 5 °C, 26 °C (room temperature), 40 °C and 80 °C
6. Wait for l0 minutes to stabilize the temperatures of the yeast and glucose solutions at set
temperatures by using thermometer
7. In the meantime, set up the computer and CO2 Gas Sensor to collect the data
8. After 10 minutes, take out yeast and glucose solutions from 5 °C,and pour them in the
250ml gas sampling bottle
9. Stabilize the gas sensor. for 100 seconds, and as soon as two solutions are poured, close the
bottle with the gas sensor tube and press start button to collect data
© International Baccalaureate Organization 2007
- 2. Biology teacher support material
Investigation 5
10. After observing 7 minutes, press stop button to stop collecting the data
11. Repeat steps 8-10 for solutions with different temperatures
12. Record the collected data
2 © International Baccalaureate Organization 2007
- 3. Biology teacher support material
Investigation 5
Results:
Data Collection:
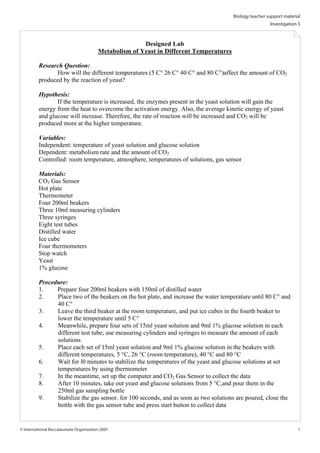
Graph1: The rate of yeast metabolism and the amount of CO2
Yeast Metabolism
4000
3000
CO2 (ppm)
2000
1000
0 50 100 150 200 250 300 350 400 450 500
Time (s)
Table 1: The change in the amount of CO2 over time
80°C 40°C 26°C 5°C
Time (s) C02 (ppm) Time (s) C02 (ppm) Time (s) C02 (ppm) Time (s) C02 (ppm)
0 1227 0 1214 0 1104 0 1056
20 1202 20 1202 20 1110 20 1056
40 1202 40 1188 40 1104 40 1056
60 1182 60 1163 60 1105 60 1066
80 1075 80 1233 80 1086 80 1160
100 1214 100 1696 100 1220 100 1153
120 1268 120 2011 120 1391 120 1202
140 1299 140 2240 140 1444 140 1250
160 1309 160 2389 160 1527 160 1290
180 1329 180 2502 180 1607 180 1329
200 1339 200 2610 200 1633 200 1369
220 1349 220 2723 220 1761 220 1388
240 1369 240 2841 240 1810 240 1408
260 1368 260 2905 260 1849 260 1427
280 1378 280 2952 280 1878 280 1437
300 1388 300 2997 300 1917 300 1454
320 1398 320 3049 320 1946 320 1466
340 1398 340 3097 340 1976 340 1476
360 1407 360 3147 360 2004 360 1496
380 1417 380 3206 380 2035 380 1506
400 1417 400 3265 400 2055 400 1525
420 1427 420 3334 420 2084 420 1534
440 1436 440 3413 440 2113 440 1547
460 1446 460 3492 460 2142 460 1564
480 1446 480 3539 480 2171 480 1574
*Note: The metabolic reaction starts from 100th second as this period is used to show the stability of the sensor
© International Baccalaureate Organization 2007
- 4. Biology teacher support material
Investigation 5
Table 2: Total change in the amount of CO2 (100sec to 160 sec)
80°C 40°C 26°C 5°C
232 ppm 1843 ppm 951 ppm 421 ppm
Table 3 Initial rate of reaction (100sec to 160sec)
Temperature 80°C 40°C 26°C 5°C
Calculation 1309 -1214 = 95 2389 -1696 = 693 1527 -1220 = 307 1290 -1153 = 137
CO2
(ppm/min) 95 693 307 137
Before the sample solutions were poured in the 250ml bottle, the CO2 sensor was stabilized
for 100 seconds.. After 100 seconds, the sample solutions were poured, as the procedure indicates,
the yeast started to metabolize sugars, which was indicated by the use of oxygen (O2); therefore,
resulting in the release of carbon dioxide (CO2), The CO2 Gas Sensor measures carbon dioxide gas
by monitoring the amount of infrared radiation absorbed by carbon dioxide molecules (Aerobic
Respiration). In the experiment, four sets of samples in different temperatures, 5 °C, 26 °C, 40 °C,
80 °C, were prepared, and the result shows that the optimum temperature of yeast for metabolizing
sugar (glucose) is 40 °C,. At 7minutes, the concentration of CO2 reached 3538.6 ppm. The yeast
was also reactive in the room temperature, 26 °C, with the result of 2l70.87ppm at 7minutes.
However, at 5 °C, and 80 °C, the concentration of CO2 stayed low, and barely increased over
7minutes, l573.76ppm and l445.8ppm.
Discussion:
The result supports the hypothesis, which states that as the temperature increases the
metabolism reaction rate of yeast will increase; therefore it will result in a higher carbon dioxide
concentration in the bottle. The chemical equation for the yeast metabolism is as follows:
C6H1206 + 6 O2 6H20 + 6C02 +Energy
Glucose + Oxygen Water + Carbon Dioxide +Energy
At the temperature of 40 °C, the amount of CO2 increased immediately after the yeast and
the glucose was mixed in the bottle. The rate of reaction was faster than other solutions because at
the higher temperature, the activation energy to overcome the activation barrier to initiate the
chemical reaction is higher. Hence, the initial rate of reaction, such as 307ppm/min, is the fastest.
Also at higher temperature, more energy is converted to the kinetic energy; thus, the average kinetic
energy becomes higher. Both yeast and glucose molecules move faster, and collide to each other
more frequently at higher average kinetic energy. Therefore, the yeast metabolized sugar in glucose
faster at 40 °C, and produced the most amount of l843ppm. Similarly, at the room temperature, the
metabolism occurred immediately after both solutions were mixed in the bottle. However, the total
amount of carbon dioxide at 7minutes was slightly less than 40 °C,
On the other hand, at the lower temperature such as 5 °C, the average kinetic energy is much
lower than at 40 °C,. Thus, only the low amount of carbon dioxide was produced because the
metabolism barely occurred. The total amount of carbon dioxide was l573.76ppm at 7minutes.
However, when the temperature of glucose and yeast was increased to 80°C,, the metabolism
reaction hardly occurred. The reason for this result is that even though the glucose solution
maintained higher average kinetic energy, most of the yeast in the yeast solution was dead by the
temperature at 80 °C,. Hence, the total amount of carbon dioxide produced at 7minutes was
l445.8ppm, which is the similar result as 5°C, •
The result of this experiment is fairly valid according to the common results from the
internet. The optimum temperature of yeast from the experiment could be estimated around 30-
40°C,, and the internet sources state that the optimum temperature is between 20-40°C, (AEM).
Therefore, the result of this experiment is reliable. However, there are some sources of errors in the
experiment. First of all, there is uncertainty in the use of technology such as CO2 Gas Sensor. While
© International Baccalaureate Organization 2007
- 5. Biology teacher support material
Investigation 5
the carbon dioxide in the bottle was stabilized for the first minute, the initial amount of carbon
dioxide was different each time. The uncertainty of the Gas Sensor is about ± 150 ppm. Therefore,
there is a slight invalidity with the use of Gas Sensor but the result shows reliable numbers,
therefore, the error could be reduced by controlling the atmosphere as much as possible. Another
source of error is the temperature change of solutions after taking out test tubes from the beakers
and poured solutions into the Gas Sensor bottle. When the solution was poured into the bottle, the
temperature might have increased or decreased to the room temperature and could have affected to
the result. Therefore, the error could be reduced by placing the bottle in the ideal temperature so
that the temperature is always controlled. In addition, there are some limitations in this experiment.
One of the limitations is that there was only limited number of CO2 Gas Sensor available. Thus, the
bottle of CO2 Gas Sensor had to be washed and dried for each samples. Another limitation is the
limited time to finish the experiment, thus the experiment could not be repeated to acquire more
accurate results. In addition, the maximum amount of CO2 that can be measured by the sensor is
5000ppm, and the respiration of yeast did not reach plateau at the maximum time; therefore, there is
clearly mechanical limitation and errors in procedure in this experiment. To reduce the error, the
amount of yeast solution and glucose could be reduced to minimize the maximum potential amount
of CO2 that can be produced by the respiration. Most significantly, the multiple trials of the
experiment should not be ignored in order to gain the validity of the experiment.
Conclusion:
The samples from 40 C° produced the highest amount of carbon dioxide from the metabolism
reaction. However, the optimum temperature for the yeast is limited to 30-40 C° because the yeast
dies in the high temperature. Therefore, the result of the experiment supports part of the hypothesis,
which states that if the temperature is increased, the average kinetic energy of yeast and glucose
will increase, therefore, the rate of reaction will be increased and CO2 will be produced more.
Sources:
Aerobic Respiration. http://faculty.uca.edu/~march/biol/aer_resp/co2_sensor.htm
AEM. http://aem.asm.org/cgi/content/full/69/3/1861
© International Baccalaureate Organization 2007 5