SlideShare a Scribd company logo
1 of 3
Name _____________________________________                                    Lab # ______
Earth Science


                              Changes In Phase of Water

Introduction: Water is a substance commonly found on Earth and in the atmosphere in all three
phases of matter (solid, liquid, and gas). This unique property of water is a major factor in
determining weather patterns on Earth.

Objective: You will use data to create a graph which show the changes in temperature as water
undergoes phase changes from solid to liquid and liquid to gas. You will compare the relative
amounts of energy needed for each step.

Vocabulary:
latent heat:


melting:


vaporization:


                Use the data below to create your graph:

      Time          Temp °C     Time        Temp°C         Time     Temp°C

      1             -9          11          45             21       100

      2             -3          12          60             22       100

      3             0           13          75             23       100

      4             0           14          90             24       100

      5             0           15          100            25       100

      6             0           16          100            26       105

      7             0           17          100            27       118

      8             0           18          100            28       123

      9             15          19          100            29       129

      10            30          20          100            30       135
Discussion Questions: (please answer in Complete Sentences)


1. According to your graph during what period of time was the sample in the solid (ice) phase?
   (Label it on your graph)


2. According to your graph, did the temperature increase while the ice was melting?


3. According to your graph, what happened to the temperature of the water between the time the ice
   melted and the water boiled?


4. How long did it take for the solid water to completely change it’s phase to liquid water?


5. How long did it take the liquid water to completely change to water vapor?


6. Which phase change gained and released the most energy?


7. Calculate the rate of temperature change between 25 and 30 minutes: (show all work)


                                                                   Answer _______________°C/min.

8. From minute 15 to minute 25, what phase change was taking place?


9. In what phase was the sample from minute 26-minute 30? (label it on your graph)
Heat Curve of Water


Temp
°C


                                            Time (min)


At what minute did the ice begin to melt          _____________________

How many minutes did the ice take to melt        _____________________

At what minute is the ice entirely melted        _____________________

At what minute did the water begin to boil        _____________________

How many minutes did the water take to boil       ____________________

More Related Content

Viewers also liked

What is science forensic check investigation
What is science forensic check investigationWhat is science forensic check investigation
What is science forensic check investigationWest Hollow MS Ms. Gill
 

Viewers also liked (20)

Global Tectonic Plates HW
Global Tectonic Plates HWGlobal Tectonic Plates HW
Global Tectonic Plates HW
 
Astro Review Packet 1
Astro Review Packet 1Astro Review Packet 1
Astro Review Packet 1
 
Chem packet 3
Chem packet 3Chem packet 3
Chem packet 3
 
Interpreting geologichistoryupdated2
Interpreting geologichistoryupdated2Interpreting geologichistoryupdated2
Interpreting geologichistoryupdated2
 
Stratigraphy Feild Trip Write Up
Stratigraphy Feild Trip Write UpStratigraphy Feild Trip Write Up
Stratigraphy Feild Trip Write Up
 
Prologue Note Packet 1 Handout (Blue)
Prologue Note Packet 1 Handout (Blue)Prologue Note Packet 1 Handout (Blue)
Prologue Note Packet 1 Handout (Blue)
 
Weathering For Sci 8
Weathering For Sci 8Weathering For Sci 8
Weathering For Sci 8
 
Prologue Note Packet 1 Handout (Blue)
Prologue Note Packet 1 Handout (Blue)Prologue Note Packet 1 Handout (Blue)
Prologue Note Packet 1 Handout (Blue)
 
Nature of Science Check activity ditto
Nature of Science Check activity dittoNature of Science Check activity ditto
Nature of Science Check activity ditto
 
Lab questions
Lab questionsLab questions
Lab questions
 
Welcome to 8th Grade Science
Welcome to 8th Grade ScienceWelcome to 8th Grade Science
Welcome to 8th Grade Science
 
What is science forensic check investigation
What is science forensic check investigationWhat is science forensic check investigation
What is science forensic check investigation
 
Unit 1: Energy Outline Science 8
Unit 1: Energy Outline Science 8Unit 1: Energy Outline Science 8
Unit 1: Energy Outline Science 8
 
Test corrections
Test correctionsTest corrections
Test corrections
 
Review student's copy
Review student's copyReview student's copy
Review student's copy
 
Dynamic Earth Practice
Dynamic Earth PracticeDynamic Earth Practice
Dynamic Earth Practice
 
Lab Report Sheet
Lab Report SheetLab Report Sheet
Lab Report Sheet
 
Weathering Outline For Sci 8
Weathering Outline For Sci 8Weathering Outline For Sci 8
Weathering Outline For Sci 8
 
Boulders
BouldersBoulders
Boulders
 
Erosion Outline
Erosion OutlineErosion Outline
Erosion Outline
 

Similar to Phase change activity

States of matter boiling point & freezing point (enhance)
States of matter   boiling point & freezing point (enhance)States of matter   boiling point & freezing point (enhance)
States of matter boiling point & freezing point (enhance)Noor Ibrahim
 
Science fair
Science fair Science fair
Science fair room24bbi
 
Weather Part 2
Weather Part 2Weather Part 2
Weather Part 2parrc
 
thesis presentation 020516
thesis presentation 020516thesis presentation 020516
thesis presentation 020516Catriona Clarke
 
Greenhouse effect presentation (slideshare)
Greenhouse effect presentation (slideshare)Greenhouse effect presentation (slideshare)
Greenhouse effect presentation (slideshare)Stella Ooi
 
Application of least square method
Application of least square methodApplication of least square method
Application of least square methodare you
 
ASSIGNMNET-2 (10)Project submission with presentation-This.docx
ASSIGNMNET-2 (10)Project submission with presentation-This.docxASSIGNMNET-2 (10)Project submission with presentation-This.docx
ASSIGNMNET-2 (10)Project submission with presentation-This.docxrock73
 
Thesis Hydro Modeling POSTER
Thesis Hydro Modeling POSTERThesis Hydro Modeling POSTER
Thesis Hydro Modeling POSTERAndre Michael
 
Rates of reaction (1).pdf
Rates of reaction (1).pdfRates of reaction (1).pdf
Rates of reaction (1).pdfBagalanaSteven
 
Max Vincent Phillip Jacques.ppt
Max Vincent Phillip Jacques.pptMax Vincent Phillip Jacques.ppt
Max Vincent Phillip Jacques.pptmax9_999
 
Fluid flow rate Experiment No. 5.pdf
Fluid flow rate Experiment No. 5.pdfFluid flow rate Experiment No. 5.pdf
Fluid flow rate Experiment No. 5.pdfKaiwan B. Hamasalih
 
Investigation05 en
Investigation05 enInvestigation05 en
Investigation05 enmcnewbold
 
States of matter
States of matter States of matter
States of matter ifaminHo
 
Taking the Mystery Out of Hydronics
Taking the Mystery Out of Hydronics Taking the Mystery Out of Hydronics
Taking the Mystery Out of Hydronics Cleaver-Brooks
 

Similar to Phase change activity (20)

G4 g4
G4 g4G4 g4
G4 g4
 
Harness-P.Balfour Final
Harness-P.Balfour FinalHarness-P.Balfour Final
Harness-P.Balfour Final
 
Chemistry Lab Report 3
Chemistry Lab Report 3Chemistry Lab Report 3
Chemistry Lab Report 3
 
States of matter boiling point & freezing point (enhance)
States of matter   boiling point & freezing point (enhance)States of matter   boiling point & freezing point (enhance)
States of matter boiling point & freezing point (enhance)
 
Science fair
Science fair Science fair
Science fair
 
Weather Part 2
Weather Part 2Weather Part 2
Weather Part 2
 
Reaction
ReactionReaction
Reaction
 
thesis presentation 020516
thesis presentation 020516thesis presentation 020516
thesis presentation 020516
 
Greenhouse effect presentation (slideshare)
Greenhouse effect presentation (slideshare)Greenhouse effect presentation (slideshare)
Greenhouse effect presentation (slideshare)
 
Application of least square method
Application of least square methodApplication of least square method
Application of least square method
 
ASSIGNMNET-2 (10)Project submission with presentation-This.docx
ASSIGNMNET-2 (10)Project submission with presentation-This.docxASSIGNMNET-2 (10)Project submission with presentation-This.docx
ASSIGNMNET-2 (10)Project submission with presentation-This.docx
 
Thesis Hydro Modeling POSTER
Thesis Hydro Modeling POSTERThesis Hydro Modeling POSTER
Thesis Hydro Modeling POSTER
 
Solar still
Solar stillSolar still
Solar still
 
Rates of reaction (1).pdf
Rates of reaction (1).pdfRates of reaction (1).pdf
Rates of reaction (1).pdf
 
Max Vincent Phillip Jacques.ppt
Max Vincent Phillip Jacques.pptMax Vincent Phillip Jacques.ppt
Max Vincent Phillip Jacques.ppt
 
Hum con
Hum conHum con
Hum con
 
Fluid flow rate Experiment No. 5.pdf
Fluid flow rate Experiment No. 5.pdfFluid flow rate Experiment No. 5.pdf
Fluid flow rate Experiment No. 5.pdf
 
Investigation05 en
Investigation05 enInvestigation05 en
Investigation05 en
 
States of matter
States of matter States of matter
States of matter
 
Taking the Mystery Out of Hydronics
Taking the Mystery Out of Hydronics Taking the Mystery Out of Hydronics
Taking the Mystery Out of Hydronics
 

More from West Hollow MS Ms. Gill (20)

Welcome to Regents Earth Science
Welcome to Regents Earth ScienceWelcome to Regents Earth Science
Welcome to Regents Earth Science
 
Syllabus earth science
Syllabus earth scienceSyllabus earth science
Syllabus earth science
 
Prologue pp1 2012
Prologue pp1 2012Prologue pp1 2012
Prologue pp1 2012
 
Prologue np1 2012
Prologue np1 2012Prologue np1 2012
Prologue np1 2012
 
Geologic History Note Packet
Geologic History Note PacketGeologic History Note Packet
Geologic History Note Packet
 
Geologic History Powerpoint Notes
Geologic History Powerpoint NotesGeologic History Powerpoint Notes
Geologic History Powerpoint Notes
 
Earthquakes final
Earthquakes finalEarthquakes final
Earthquakes final
 
Dynamic earth np1
Dynamic earth np1Dynamic earth np1
Dynamic earth np1
 
Earthquakes final
Earthquakes finalEarthquakes final
Earthquakes final
 
Plates ex2
Plates ex2Plates ex2
Plates ex2
 
Plates Lab
Plates LabPlates Lab
Plates Lab
 
Oceans and Basin Do Now
Oceans and Basin Do NowOceans and Basin Do Now
Oceans and Basin Do Now
 
Pangaea lab
Pangaea labPangaea lab
Pangaea lab
 
Ocean bottom profiles
Ocean bottom profilesOcean bottom profiles
Ocean bottom profiles
 
Earths Interior Questions HW
Earths Interior Questions HWEarths Interior Questions HW
Earths Interior Questions HW
 
Dynamic Earth Note Packet
Dynamic Earth Note PacketDynamic Earth Note Packet
Dynamic Earth Note Packet
 
Dynamic Earth
Dynamic EarthDynamic Earth
Dynamic Earth
 
Earths dimension sci 8 ppt np1
Earths dimension sci 8 ppt np1Earths dimension sci 8 ppt np1
Earths dimension sci 8 ppt np1
 
Metamorphic Rocks
Metamorphic RocksMetamorphic Rocks
Metamorphic Rocks
 
Igneous Rocks
Igneous RocksIgneous Rocks
Igneous Rocks
 

Phase change activity

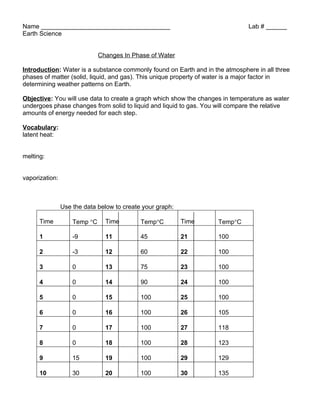
  • 1. Name _____________________________________ Lab # ______ Earth Science Changes In Phase of Water Introduction: Water is a substance commonly found on Earth and in the atmosphere in all three phases of matter (solid, liquid, and gas). This unique property of water is a major factor in determining weather patterns on Earth. Objective: You will use data to create a graph which show the changes in temperature as water undergoes phase changes from solid to liquid and liquid to gas. You will compare the relative amounts of energy needed for each step. Vocabulary: latent heat: melting: vaporization: Use the data below to create your graph: Time Temp °C Time Temp°C Time Temp°C 1 -9 11 45 21 100 2 -3 12 60 22 100 3 0 13 75 23 100 4 0 14 90 24 100 5 0 15 100 25 100 6 0 16 100 26 105 7 0 17 100 27 118 8 0 18 100 28 123 9 15 19 100 29 129 10 30 20 100 30 135
  • 2. Discussion Questions: (please answer in Complete Sentences) 1. According to your graph during what period of time was the sample in the solid (ice) phase? (Label it on your graph) 2. According to your graph, did the temperature increase while the ice was melting? 3. According to your graph, what happened to the temperature of the water between the time the ice melted and the water boiled? 4. How long did it take for the solid water to completely change it’s phase to liquid water? 5. How long did it take the liquid water to completely change to water vapor? 6. Which phase change gained and released the most energy? 7. Calculate the rate of temperature change between 25 and 30 minutes: (show all work) Answer _______________°C/min. 8. From minute 15 to minute 25, what phase change was taking place? 9. In what phase was the sample from minute 26-minute 30? (label it on your graph)
  • 3. Heat Curve of Water Temp °C Time (min) At what minute did the ice begin to melt _____________________ How many minutes did the ice take to melt _____________________ At what minute is the ice entirely melted _____________________ At what minute did the water begin to boil _____________________ How many minutes did the water take to boil ____________________