1. The document summarizes an investigation into supercavitation physics conducted in two laboratories. It included studies of ventilated cavitation, configuration effects, and a comparison of ventilated and natural supercavitation.
2. Key findings included that results from the two laboratories for ventilated cavitation agreed well, and that a backward facing model provided better visualization of natural supercavitation compared to a forward facing model.
3. The formation and evolution of natural supercavitation was observed, including four stages of cavity development. Choking behavior, where cavity size remains constant despite pressure changes, was demonstrated and used to measure minimum cavitation numbers.
A Study of Anomalous Value of Free-Air Vertical Gradient for Density Determin...Premier Publishers
Underground Gravity Vertical Gradient is an important practice for prospecting underground densities, although in most cases it does not match the densities obtained directly in the laboratory from rock samples representative of the location. The densities of the laboratory samples were systematically lower when compared to the densities calculated by gravimetric determination suggesting some kind of systematic error. Several researchers propose different sources to explain these systematic errors including an anomalous value of the free-air vertical gradient. The anomalous value was admitted for the free-air vertical gradient in this paper to reinterpret the densities determination research made in a mine at Barberton, Ohio, in 1950, by gravimetric measurements and by laboratory rock samples. The results of both approaches reached similar densities agreeing with the free-air vertical gradient proposed.
NUMERICAL SIMULATION OF FORCED CONVECTION IN OIL SANDS USING LATTICE BOLTZMAN...IAEME Publication
Lattice Boltzmann method is used to simulate forced convection in oil sands (low permeable porous geometries). Fluid flows through a sandstone look alike square geometry with left wall of the geometry kept at higher temperature compared to other walls. Investigation is carried out to study influence of increased temperature on flow properties by observing the variation in velocity and temperature profiles for various permeability and porosity values, which were varied to match the geometrical properties of oil sands.
HOW TO PREDICT HEAT AND MASS TRANSFER FROM FLUID FRICTIONbalupost
In this paper, the „Generalized Lévêque Equation (GLE)“, which allows to calculate heat or mass transfer coefficients – or the corresponding Nusselt and Sherwood numbers – from frictional pressure drop or friction forces in place of the flow rates or Reynolds numbers is used in external flow situations, such as a single sphere or a single cylinder in cross flow.
Asme2009 82287 - Porous Media - Forced Convection FlowHIIO
In this study the flow field and heat transfer properties of a
steady, two-dimensional flow field in a porous domain between
two parallel plates is investigated numerically by using a
discretized numeric code. Analysis has been carried for
Reynolds number based on particle sizes ranging from 60 to
1000. Numerical results are compared with different numerical
methods used for predicting this kind of flow. Results are
obtained for different regime, various p Re numbers and the
effect of Particles size is also investigated. Solutions indicate
that by increasing the
p Re , the flow in the porous media
remains laminar where the flow has turbulence characteristics
for p Re <50. Moreover, by increasing p Re , the value of
average Nusselt number increases. Also, reducing the particle
size affects the Nusselt number and it increases while the
porosity remains the same.
Atmospheric turbulent layer simulation for cfd unsteady inlet conditionsStephane Meteodyn
The aim of this work is to bridge the gap between experimental approaches in wind tunnel testing and numerical computations, in the field of structural design against strong winds. This paper focuses on the generation of an unsteady flow field, representative of a natural wind field, but still compatible with CFD inlet requirements. A simple and “naïve” procedure is explained, and the results are successfully compared to some standards.
Effect of Geometry on Variation of Heat Flux and Drag for Launch Vehicle -- Z...Abhishek Jain
Above Research Paper can be downloaded from www.zeusnumerix.com
The research paper aims at studying the variation of the geometry of the launch vehicle nose and its effect on heat flux. CFDExpert software is first validated on NASA's hyperballistic model and then used on proposed geometries. Various nose radius and blending shapes are studied for effect on drag and heat flux. Cone ogive shape is found to decrease heat flux with an insignificant increase in drag. Authors Abhishek Jain (Zeus Numerix), Rohan Kedar and Prof V Kalamkar (SPCOE).
technoloTwo dimensional numerical simulation of the combined heat transfer in...ijmech
A numerical investigation was conducted to analyze the flow field and heat transfer characteristics in a vertical channel withradiation and blowing from the wall. Hydrodynamic behaviour and heat transfer results are obtained by the solution of the complete Navier–Stokesand energy equations using a control volume finite element method. Turbulent flow with "Low Reynolds Spalart-Allmaras Turbulence Model" and radiation with "Discrete Transfer Radiation Method" had been modeled. In order to have a complete survey, this article has a wide range of study in different domains including velocity profiles at different locations, turbulent viscosity, shear stress, suctioned mass flow rate in different magnitude of the input
Rayleigh number, blowing Reynoldsnumber, radiation parameter, Prandtl number, the ratio of length to width and also ratio of opening thickness to width of the channel. In addition, effects of variation in any of the above non-dimensional numbers on parameters of the flow are clearly illustrated. At the end resultants had been compared with experimental data which demonstrated that in the present study, results have a great accuracy, relative errors are very small and the curve portraits are in a great
agreement with real experiments.
To better understand injection and post-injection flow processes and the entrapment of supercritical CO2 during geological carbon sequestration in a carbonate reservoir, the pore systems of sixty-six Cambrian-Ordovician carbonate samples from multiple states in the Midwest United States were analyzed.
A Comprehensive Study of Multiphase Flow through Annular Pipe using CFD ApproachRaian Nur Islam
This study analyzes 3D fluid flow through the annular pipeline with multiphase fluids using CFD simulation. Eulerian Model with Reynolds Stress Model (RSM) turbulence closure is adopted to analyze multiphase fluid flow. The results are validated with existing experimental data and empirical correlations. A robust simulation model is developed that can be used further for different applied cases. Geometry and boundary conditions of flow are adopted from experimental works to validate the simulation. The sensitivity analysis is also conducted to observe the flow characteristics. Fluid inlet velocity of distinct phases, inner pipe rotation and eccentricity are used as input or independent parameters and pressure gradient and local concentration profile at different sections of geometry are the primary output parameter to analyze. The key results show that changing inner pipe rotation and eccentricity have a significant impact on output pressure and local particle distribution which eventually help to find a way out from particle blockage. This study would help the oil and gas industry in designing their pipelines.
This paper details the ultrasonic tube hydroforming, in tube hydroforming due to friction condition, uniform wall thickness and sharp corners may not be achieved. Use of ultrasonic vibration can improve the contact conditions at the tube-die interface. The current work studies the effect of applying ultrasonic vibration on wall thickness and corner filling of hydroformed tubes. In order to understand the process an analytical model based on geometric relationships and stress-strain states has been established. The wall thickness and corner radius of hydroformed tube can be obtained by solving the model. By comparing the results of the Finite Element Models of tube in two cases of ultrasonic hydroforming (internal pressure along with the oscillations of the die) and conventional hydroforming (internal pressure only), the effects of vibration on wall thickness and corner filling are investigated. The results indicate superimposing ultrasonic vibrations to the process will increase corner filling ratio of the tube significantly, and more uniform tube wall thickness will be achieved.
Validations and applications of a CFD tool dedicated to wind assessment in ur...Stephane Meteodyn
UrbaWind is a CFD code developed by Meteodyn especially dedicated to urban wind applica-tions with an automatic meshing and boundary conditions set-up. The paper shows validations by comparisons with experimental data proposed by the Architectural Institute of Japan (Tominaga et al., 2008). The first selected case is a wind-tunnel experiment of wind past a group of blocks, and the second one is a field experiment inside a quarter Niigata (Japan). Three examples of ap-plication in the outdoor comfort assessment are presented: A pool deck of Mosaic Houston (Tex-as), Chambéry Hospital (France), Saint-Brieuc district (France).
Similar to Investigation of Supercavitation Physics (20)
Validations and applications of a CFD tool dedicated to wind assessment in ur...
Investigation of Supercavitation Physics
1. 1
Investigation of Supercavitation Physics
Siyao Shao, Ashish Karn, Jiarong Hong and Roger E.A. Arndt
Final Report
To
Professor Byoung-Kwon Ahn,
Flow Induced Noise & Cavitation Control Lab. (FINCL)
Introduction
Supercavitation is of interest because of the large reduction in drag that can be achieved,
allowing for considerably higher operating speeds for various hydrodynamic vehicles. Although
there have been a considerable number of investigations of supercavitation carried out in many
institutions around the world, there have been few studies in which comparable results have been
achieved.
This is a collaborative study with the Flow Induced Noise & Cavitation Control Lab. (FINCL),
Dept. of Naval Architecture and Ocean Engineering, in Chungnam National University in
Daejon, 34134, Korea. The study reported herein has three parts:
1. A study of ventilated cavitation in which direct comparison is made with the results
obtained in Korea
2. An investigation of configuration effects
3. A comparison between ventilated and vaporous supercavitation
The operation of supercavitating vehicles poses unique challenges. Only small regions at the
nose (cavitator) and possibly on the afterbody are in contact with water. Unlike for a fully wetted
vehicle, there is an absence of lift on the body. In addition, the vehicle has significant start-up
issues requiring special attention to methods for reaching high enough velocity to operate in the
supercavitating mode. A precise knowledge of cavity shape is very important when computing
the fin and planing forces acting on a supercavitating vehicle. In addition, cavity-vehicle
interaction also exhibits strong memory effects (cavity shape is a function of the history of the
vehicle motion). Ventilation is an important issue due to the paucity of both experimental data
and reliable modeling of ventilation demand.
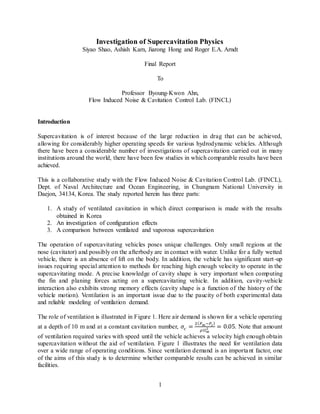
The role of ventilation is illustrated in Figure 1. Here air demand is shown for a vehicle operating
at a depth of 10 m and at a constant cavitation number, 𝜎𝑐 =
2( 𝑃∞−𝑃𝑐)
𝜌𝑈∞
2 = 0.05. Note that amount
of ventilation required varies with speed until the vehicle achieves a velocity high enough obtain
supercavitation without the aid of ventilation. Figure 1 illustrates the need for ventilation data
over a wide range of operating conditions. Since ventilation demand is an important factor, one
of the aims of this study is to determine whether comparable results can be achieved in similar
facilities.
2. 2
Figure 1 Schematic of ventilation demand for an accelerating vehicle designed to operate
at a cavitation number of 0.05 and a depth of 10m.
Facilities
Figure 2 is an illustration of the water tunnel at Chungnam University. By comparison the Saint
Anthony Falls Laboratory (SAFL) Water Tunnel is shown in Figure 3. Both tunnels have test
sections with a square cross section with the SAFL tunnel having a larger cross section (190mm
X 190mm versus 100mm X 100 mm. Both tunnels have a maximum operating speed of 20 m/s.
A unique feature of the SAFL tunnel is the ability to remove large quantities of injected air,
allowing for continuous operation with high rates of ventilation air.
Test Conditions
The first phase of our study was a comparison of the ventilation rates obtained in the two
facilities. The size of cavitators used were adjusted so that the relative size, D/dc was the same
for a series of tests. This is illustrated in Table 1. In both cases the tunnel diameter was defined
as the diameter of a circular cross section with the same cross sections area:
hD
2
where h is the tunnel cross section height. 20mm, 30mm and 40mm cavitators were used in the
experiments to study the effect of blockage on the cavity geometry and closures. Cavity images
including the cavity closure region were captured with a Nikon D-610 digital camera. The
highest flow velocity was set as 12m/s.
4. 4
SAFL
Test section 190x190
D [mm] 214.4
dc [mm] 20.0 30.0 40.0
D/dc 10.72 7.15 5.36
σ (min) 0.20 0.32 0.46
CNUCT
Test section 100x100
D [mm] 112.8
dc [mm] 10.5 15.8 21.1
D/dc 10.72 7.15 5.36
σ (min) 0.20 0.32 0.46
Table 1. Comparison of test conditions for ventilation studies
Ventilation Studies Forward Facing Model
Since the Chungnam facility is only equipped with a forward facing model, comparison are made
with this configuration first. The forward facing model was similar in design to the one used in
Korea. A typical set of data is shown in Figure 4. In this plot the size of a cavity varies with the
ventilation rate. Here the ventilation rate is normalized with flow velocity and cavitator diameter:
2
Ud
Q
Cq
Cavitation number is defined as the equivalent cavitation number for free stream conditions
(Kawakami and Arndt 2011, p). The results are similar to those obtained in Korea.
The minimum cavitation number agrees well with the predictions of Brennen (1969) as shown in
Figure 5. Further, the measured geometry agreed well with simulations of Ahn et al (2012). Here
the original data was converted to show the cavity geometry, D/dc in terms of the equivalent
cavitation number for unbounded flow (Kawakami and Arndt 2011).
The overall conclusion is that results of the present study and the earlier results of Kawakami and
Arndt agree very well with Chungnam University data.
A full summary of all the data is given in the appendix.
5. 5
Figure 4 Typical set of images over a range of ventilation rate
Figure 5. Choking Cavitation Number versus Blockage Ratio
6. 6
Figure 6 Comparison of measured geometry with the simulations of Ahn et al (2012)
Configuration Effects
Our initial experiments with forward facing cavitators (FFM) indicated some issues:
It was found to be difficult to establish a natural supercavity with the FFM, especially
with the 10 mm cavitator and 20mm cavitator.
Difficult to observe cavity closure.
Later experiments with natural supercavitation were difficult to carry out because large
vibrations in the strut were encountered while carrying out experiments at high
tunnel velocities.
To circumvent these issues a backward facing model (BFM) was developed. A favorable feature
was the ease of observing cavity closure without the encumbrance of a supporting body. A
negative was the influence of a supporting hydrofoil strut, mounted upstream of the cavity. The
two types of models are compared in Figures 7 and 8.
A comparison of the performance of the two types of models is shown in Figure 9. Note that the
biggest drawback with BFM is the influence of the wake from the hydrofoil support.
8. 8
Figure 8 Backward Facing Model
Figure 9 Comparison of two types of models.
A typical set of backward facing model is shown in Figure 10.
Figure 10 Typical set of images over a range of ventilation rate
Natural Supercavitation
The backward facing model provided a good starting point for observing natural cavitation. The
experimental conditions are shown in Table 2. And a much smaller experimental range of
forward facing model natural supercavitation was achieved after the stabilization of the model
from outside of the test section which is shown in Table 3. Figure 10 provides a comparison of
9. 9
the natural supercavities formed by the backward facing model and forward facing model with
the same cavitator size (30mm).
Figure 10 Comparison of two types of models (natural supercavitation).
Table 2 Experimental Conditions with BFM
SAFL
Test section 190x190
D (mm) 214.4
dc (mm) 30.0 40.0
D/dc 7.15 5.36
Velocity range, V (m/s)* 8.7-10.7 7.7-10.7
Wake signature
10. 10
Fr range 15.9-19.7 12.3-17.1
Lowest stable operation pressure, P
(kPa)
15
σmin, theory 0.3174 0.4556
σv, attainable 0.3205 0.4594
Table 3 Experimental Conditions with FFM
Formation and Evolution
An important question is whether there are any differences between ventilated and natural
supercavitation. It was observed that, for a backward facing model, a bubbly flow undergoes four
different stages to generate a clear supercavity which are dense bubbly flow, bubbly flow with
spiraling bubble jets, foamy cavity and a supercavity. Figure 11 illustrates the process of the
cavity’s evolution.
Figure 11 Evolution of Cavity Formation
Choking
After reaching supercavitation, the cavitation index can be further reduced by pressure reduction.
However, there is a minimum below which the cavitation index cannot be further reduced. The
minimum value is dictated by blockage (Brennen, 1969, Tulin, 1961). Under choking, further
11. 11
pressure reduction does not influence the cavitation number. Instead, a constant velocity drop
occurs to satisfy this constant minimum/choking cavitation number, as shown in Figure 11. This
provides a practical way to measure minimum cavitation number in restrained water tunnel
experiments. The cavity size remained constant after choking, as seen in Figure 12 (rc is the
cavitator radius and (L/2) is the length from cavitator to the cavity’s maximum diameter).
Similar results are found with the forward facing model as shown in Figure 13.
Figure 12 Choking Test
12. 12
Figure 13 Change in Cavity Shape After Choking
Figure 14 Choking Test with FFM
13. 13
An interesting characteristic is the change in cavity closure with choking. Figure 15 shows the
characteristic cavity closure before choking and Figure 16 portrays the evolution of cavity
closure after choking. The variation of the closure geometry with velocity after choking is an
interesting new phenomenon that should be studied further. A published theory (Karn et al. 2015)
of closure types’ dependence on the closure region’s ambient pressure for the artificial
supercavities could be applied to the explanation of the natural supercavities’ closure evolution
and it requires a systematic measurement of the downstream pressure for both ventilated and
natural supercavities.
Figure 15 Cavity closure observed with the BFM (40mm cavitator)
14. 14
Figure 16 Cavity Closure after Choking (40mm cavitator)
Physics of Natural Cavitation
An interesting insight into the physics of natural cavitation can be inferred from inspection of
Figures 17 and 18. Figure 17 compares natural and ventilated cavitation at the same sigma
whereas Figure 18 displays a comparison for the same size cavity1. The reason the natural and
ventilated cavities are so different in Figure 17 is that v should be calculated on the basis of
vapor pressure within the cavity not the value corresponding to the temperature of the liquid
external to the cavity. There is a temperature gradient across the cavity wall that is necessary to
supply vapor to maintain the cavity. Hence the vapor pressure within the cavity is lower. Thus
the actual v is higher. Hence a lower value of v, based on the temperature in the test section is
required to achieve comparable conditions. Based on the experiment condition of Figure 17,
using ventilated supercavity’s pressure and shape data as a reference, a required pressure drop of
roughly 1kPa is required to maintain the similar cavity geometry. However, a theoretical
calculation indicates a pressure drop less than 500Pa (Gelder et al. 1966). Further studies into the
physics of natural cavitation are required from both the theoretical and experimental views to
resolve this discrepancy of the natural supercavities and artificial supercavities.
1 Actually a slightly smaller value of sigma is required to obtain equal cavity size.
15. 15
Figure 17
Figure 18
REFERENCES
Ahn, B-K, Jang, H-G, Kim, H-T and Lee, C-S 2012 “Numerical Analysis of Axisymmetric
Supercavitating Flows” Proceedings of the Eighth International Symposium on Cavitation (CAV
2012)
Brennen, C., 1969, “A Numerical Solution of Axisymmetric Cavity Flows,” J.Fluid Mech., 37
(4), pp. 671–688.
Kawakami, E and Arndt, REA , 2011 “Investigation of the Behavior of Ventilated Supercavities”
J. Fluids Engineering, 33, 091305-1-11 September
Tulin, M.P., 1961, “Supercavitating Flows,” Handbook of Fluid Dynamics, Streeter, V. (ed.),
McGraw-Hill, New York, pp. 1224–1246.
16. 16
Karn, A., Arndt, R., & Hong, J. “An experimental investigation into the physics of supercavity
closure,” Journal of Fluid Mechanics (In press).
Gelder. T., Ruggeri R., Moore. Royce, 1966 “Cavitation similarity considerations based on
measured pressure and temperature and temperature depression in cavitated regions of Freon
114”, NASA TN D-3509.