SlideShare a Scribd company logo
B) Ice jam study in the Grand River
1,3
4
Investigating Flooding Pattern Using Hydrologic Engineering Center-River Analysis System (HEC-RAS) in the City of Painesville, Ohio
Niraj Lamichhane1, Suresh Sharma2
1Graduate Student, Civil/Environmental Engineering Program, Youngstown State University, One University Plaza, Youngstown, OH 44555; (330)-259-6019, Email: nlamichhane@student.ysu.edu, 2Assistant Professor, Civil/Environmental Engineering Program, Youngstown State University, One University Plaza, Youngstown, OH 44555; (330)941-1741, Email: ssharma06@ysu.edu
Study area
This study was conducted on a Grand River watershed of the Northern Ohio (Figure 1). The total watershed area of the
outlet of the Grand River is approximately 705 mi2. Major portions of the watershed is covered with forest (44%), water
bodies and wetlands (14.7%) and developed/urban land (10.3%).
Methodology
The methodology is briefly sketched in section A.
Objectives
1. To understand ice jam and its contribution to probable future floods.
2. To prepare different year return period flooding maps in order to warn the local people about the potential flood
hazards.
Abstract
The majority of the Rivers in the northern belt of Ohio undergo freezing in the winter season with a possible consequence of an ice jam formation. As a result, sudden flooding can be experienced even though the anticipated precipitation is not significant. Since river ice jams can generate extreme flood events, detailed monitoring of ice jam record is
needed for the prediction of ice jam break up in order to improve the conventional hydrologic forecast. In this research, Hydrologic Engineering Center-River Analysis System (HEC-RAS) has been developed using high resolution datasets, LIDAR (Light Detection and Ranging) and field verified cross section. The hydraulic model, HEC-RAS has been
used to predict the downstream flooding pattern and prepare flood inundation maps based on upstream gage height. The potential locations for additional gage stations have been investigated to ensure downstream flood forecast a few hours in advance and provide sufficient evacuation time. In addition, flood maps of various return periods have been
prepared. Our preliminary analysis indicates that 500 year return period flood is destructive.
0
1000
2000
3000
4000
5000
6000
7000
Discharge(cfs)
Date
Observed discharge
Simulated discharge
a) Streamflow calibration at the USGS gage station 04212100
0
1000
2000
3000
4000
5000
6000
7000
8000
9000
Discharge(cfs)
Date
Observed discharge
Simulated discharge
b) Streamflow validation at the USGS gage station 04212100
Figure 8. Ice jam upstream of Fairport Harbor in
2014
Figure 7: Historical ice jam locations at various sections along the Grand River, Ohio
Result and Discussions
 Flood from Harpersfield (upstream) takes approximately 4-6 hours (depending upon the nature of the flood) to reach the City
of Painesville.
 Hydraulic analysis of the Grand River was conducted using HEC-RAS (Figure 2). Cross sections of the Grand River to be used
in HEC-RAS was verified from the field survey (Figure 3).
 The model was calibrated and validated (Figure 4).
 Floods of different return period are listed in Table 1 and the ice jam locations are listed in Table 2. Our preliminary
investigation concludes that the Vrooman bridge, Lakeland Freeway bridge and High Street bridge along the section of the
Grand River might be flooded (during 500 year return period)
 Flood plain delineation of 500 year return period using HEC-RAS and HEC-GeoRAS (Figure 6) shows followings:
• around 12 houses have a high chance of flooding near the junction of the Big Creek and Grand River;
• nearly 25 houses and 4 apartments will be flooded in Steel Ave and Grand River Ave ;
• some of the areas Kiwanis Recreation Park and Casement Golf Course just downstream of Main St. bridge in the City of
Painesville and Hidden Valley Park in Madison will be flooded;
• nearly 11 apartments and some houses near the banks of the Grand River in Huntington road and Hidden Harbor of
Painesville including some other harbors are under the risk of flooding;
 The historical climatic study shows that the formation of ice jam is more often in Neutral period of ENSO phases while
showing the least chances in La Niña period (Figure 10).
 Melting of ice in the late winter due to increase in mean air temperature has a significant contribution to winter flooding.
0
2000
4000
6000
8000
10000
12000
Discharge(cfs)
Date
Observed discharge
Simulated discharge
c) Streamflow validation at the USGS gage station 04212100
Figure 1. A map showing study area (the Grand River) spreading out to four counties of Ohio. ( Lake, Ashtabula, Geauga and Trumbull)
Figure 4. Calibration (a), and validation (b & c) of the HEC-RAS
Figure 3. Field verification of cross sections
Table 1. Flood discharge in the Grand River and it’s tributaries
S.N. Locations Dates of occurrence Description
1. 0.1 mile upstream of Main Street Bridge, Painesville 2014
2. Upstream section of Grand River near E Walnut Ave.
1981, 1982, 1984, 1988, 2003,
2007, 2008, 2009, 2010, 2011
Most of them were breakup jams
and some were releasing jams
3. Near Main Street Bridge, Painesville 1978
4. Just upstream of Vrooman Bridge, Vrooman Rd 2014 Blockage of Vrooman road
5.
Bank St., Painesville, OH
2014 -
5. Water St, Fairport Harbor, OH 2014 -
6.
Near 4842 Bailey Rd, Madison, OH
- -
Table 2. Location and periods of ice jams in the Grand River
0
200
400
600
800
1000
1200
La Niña El Niño Neutral
AccumulatedFreezingDegreeDays(0F)
Figure 9. Box plot showing variation of AFDD during different
ENSO phases as an evidence of climatic variability in ice jam
Conclusion
 Many houses, bridges and people near the banks of the Grand River will be under the risk of 500 year return period flood.
 Early flood warning systems should be developed to provide sufficient warnings for the protection of lives and properties.
Figure 6. Grand River flood plain delineation using HEC-RAS and HEC-GeoRAS showing the flood plain near the City of
Painesville (a), and at the junction of the Mill Creek and the Grand River (b)
10 year flood
50 year flood
100 year flood
500 year flood
a) Details of flood plain near the City of Painesville area
City of
Painesville
Fairport
Harbor
Lake Erie
b) Details of flood plain near the junction of the Mill Creek and
Grand River
Lake Erie
Painesville
Big Creek
S.N Stream Name
Flood discharge (cfs)
10 years 50 years 100 years 500 years
1. Grand River upstream at Harpersfield 8,870 11,200 12,300 14,400
2. Mill Creek at the junction of Grand River 1,420 2,030 2,300 2,890
3. Grand River at the junction of Mill Creek 10,290 13,230 14,600 17,290
4. Painecreek at the junction of Grand River 2,120 3,080 3,500 4,460
5. Grand River at the junction of Painecreek 12,410 16,310 18,100 21,750
6. Big Creek at the junction of Grand River 3,390 4,940 5,620 7,170
7. Grand River at the junction of Big Creek 15,800 21,250 23,720 28,920
Figure 5. High flood level in different bridges from the HEC-RAS simulation
b) Water Level at Lakeland Freeway
bridge during 500 year flood
c) Water Level at High Street bridge
during 500 year flood
a) Water Level at Vrooman bridge
during 500 year flood
Acknowledgement
Authors would like to acknowledge for the grant support provided by the Ohio Sea Grant for this research.
A) Hydraulic analysis and flood plain delineation
Figure 2. Hydraulic model of the Grand River in HEC-RAS
b) XYZ perspective plot of Grand River
a) Plan view of Grand River (From Harpersfield to Fairport Harbor)
c) Longitudinal profile of the Grand River
Note: AFDD is an Accumulated Freezing Degree Days,
which is calculated using the summation of Freezing
Degree Days (FDD); that is, FDD = 32-Ta, where Ta is
mean temperature of air.
Figure 10. Relationship between AFDD, precipitation and discharge showing an increase in winter flooding due to
both precipitation and melting of ice (caused by increase in mean air temperature)
25
6
7

More Related Content

What's hot

Exaple of use of decision support system planning dss (p) kerala state
Exaple of use of decision support system planning dss (p)   kerala stateExaple of use of decision support system planning dss (p)   kerala state
Exaple of use of decision support system planning dss (p) kerala statehydrologyproject0
 
Understanding impacts of sustainable land management interventions using SWAT...
Understanding impacts of sustainable land management interventions using SWAT...Understanding impacts of sustainable land management interventions using SWAT...
Understanding impacts of sustainable land management interventions using SWAT...
International Water Management Institute (IWMI)
 
Estimation of surface runoff in nallur amanikere
Estimation of surface runoff in nallur amanikereEstimation of surface runoff in nallur amanikere
Estimation of surface runoff in nallur amanikere
eSAT Publishing House
 
Hydrologic modeling
Hydrologic modelingHydrologic modeling
Sea level rise and storm surge tools and datasets supporting Municipal Resili...
Sea level rise and storm surge tools and datasets supporting Municipal Resili...Sea level rise and storm surge tools and datasets supporting Municipal Resili...
Sea level rise and storm surge tools and datasets supporting Municipal Resili...
GrowSmart Maine
 
Developing a Model to Validate the Use of Landsat and MODIS Data to Monitor C...
Developing a Model to Validate the Use of Landsat and MODIS Data to Monitor C...Developing a Model to Validate the Use of Landsat and MODIS Data to Monitor C...
Developing a Model to Validate the Use of Landsat and MODIS Data to Monitor C...daileya
 
Runoff estimation and water management for Holetta River, Awash subbasin, Eth...
Runoff estimation and water management for Holetta River, Awash subbasin, Eth...Runoff estimation and water management for Holetta River, Awash subbasin, Eth...
Runoff estimation and water management for Holetta River, Awash subbasin, Eth...
International Water Management Institute (IWMI)
 
Groundwater Modeling and GIS
Groundwater Modeling and GISGroundwater Modeling and GIS
Groundwater Modeling and GIS
Prof. A.Balasubramanian
 
Dredging and Disposal Site Reclamation at John Redmond Reservoir, Kansas
Dredging and Disposal Site Reclamation at John Redmond Reservoir, KansasDredging and Disposal Site Reclamation at John Redmond Reservoir, Kansas
Dredging and Disposal Site Reclamation at John Redmond Reservoir, Kansas
Matt Unruh
 
Groundwater modelling (an Introduction)
Groundwater modelling (an Introduction)Groundwater modelling (an Introduction)
Groundwater modelling (an Introduction)
Putika Ashfar Khoiri
 
Streamflow simulation using radar-based precipitation applied to the Illinois...
Streamflow simulation using radar-based precipitation applied to the Illinois...Streamflow simulation using radar-based precipitation applied to the Illinois...
Streamflow simulation using radar-based precipitation applied to the Illinois...
Alireza Safari
 
Birr - Identifying Critical Portions of the Landscape
Birr - Identifying Critical Portions of the LandscapeBirr - Identifying Critical Portions of the Landscape
Birr - Identifying Critical Portions of the LandscapeJose A. Hernandez
 
Effectiveness Analysis of Agriculture BMPs by SWAT Model for Apropriate Contr...
Effectiveness Analysis of Agriculture BMPs by SWAT Model for Apropriate Contr...Effectiveness Analysis of Agriculture BMPs by SWAT Model for Apropriate Contr...
Effectiveness Analysis of Agriculture BMPs by SWAT Model for Apropriate Contr...
Stankovic G
 
GROUNDWATER MODELING SYSTEM
GROUNDWATER MODELING SYSTEMGROUNDWATER MODELING SYSTEM
GROUNDWATER MODELING SYSTEM
Shyam Mohan Chaudhary
 
Hinshaw Davis Updating Catskill Mountain Regional Curves
Hinshaw Davis Updating Catskill Mountain Regional CurvesHinshaw Davis Updating Catskill Mountain Regional Curves
Hinshaw Davis Updating Catskill Mountain Regional CurvesSarah Hinshaw
 
Land cover change analysis
Land cover change analysisLand cover change analysis
Land cover change analysis
Soil and Water Conservation Society
 
Modeling the Effects of Land Use Change on Flooding
Modeling the Effects of Land Use Change on FloodingModeling the Effects of Land Use Change on Flooding
Modeling the Effects of Land Use Change on Flooding
Adam Nayak
 
Analysis of runoff for vishwamitri river watershed using scs cn method and ge...
Analysis of runoff for vishwamitri river watershed using scs cn method and ge...Analysis of runoff for vishwamitri river watershed using scs cn method and ge...
Analysis of runoff for vishwamitri river watershed using scs cn method and ge...
vishvam Pancholi
 
Estimating Groundwater Availability at the Catchment Scale Using Streamflow R...
Estimating Groundwater Availability at the Catchment Scale Using Streamflow R...Estimating Groundwater Availability at the Catchment Scale Using Streamflow R...
Estimating Groundwater Availability at the Catchment Scale Using Streamflow R...
International Water Management Institute (IWMI)
 
California; Harvesting Rain: Addressing Water Needs of the Monterey Peninsu...
California;  Harvesting Rain:  Addressing Water Needs of the Monterey Peninsu...California;  Harvesting Rain:  Addressing Water Needs of the Monterey Peninsu...
California; Harvesting Rain: Addressing Water Needs of the Monterey Peninsu...
D7Z
 

What's hot (20)

Exaple of use of decision support system planning dss (p) kerala state
Exaple of use of decision support system planning dss (p)   kerala stateExaple of use of decision support system planning dss (p)   kerala state
Exaple of use of decision support system planning dss (p) kerala state
 
Understanding impacts of sustainable land management interventions using SWAT...
Understanding impacts of sustainable land management interventions using SWAT...Understanding impacts of sustainable land management interventions using SWAT...
Understanding impacts of sustainable land management interventions using SWAT...
 
Estimation of surface runoff in nallur amanikere
Estimation of surface runoff in nallur amanikereEstimation of surface runoff in nallur amanikere
Estimation of surface runoff in nallur amanikere
 
Hydrologic modeling
Hydrologic modelingHydrologic modeling
Hydrologic modeling
 
Sea level rise and storm surge tools and datasets supporting Municipal Resili...
Sea level rise and storm surge tools and datasets supporting Municipal Resili...Sea level rise and storm surge tools and datasets supporting Municipal Resili...
Sea level rise and storm surge tools and datasets supporting Municipal Resili...
 
Developing a Model to Validate the Use of Landsat and MODIS Data to Monitor C...
Developing a Model to Validate the Use of Landsat and MODIS Data to Monitor C...Developing a Model to Validate the Use of Landsat and MODIS Data to Monitor C...
Developing a Model to Validate the Use of Landsat and MODIS Data to Monitor C...
 
Runoff estimation and water management for Holetta River, Awash subbasin, Eth...
Runoff estimation and water management for Holetta River, Awash subbasin, Eth...Runoff estimation and water management for Holetta River, Awash subbasin, Eth...
Runoff estimation and water management for Holetta River, Awash subbasin, Eth...
 
Groundwater Modeling and GIS
Groundwater Modeling and GISGroundwater Modeling and GIS
Groundwater Modeling and GIS
 
Dredging and Disposal Site Reclamation at John Redmond Reservoir, Kansas
Dredging and Disposal Site Reclamation at John Redmond Reservoir, KansasDredging and Disposal Site Reclamation at John Redmond Reservoir, Kansas
Dredging and Disposal Site Reclamation at John Redmond Reservoir, Kansas
 
Groundwater modelling (an Introduction)
Groundwater modelling (an Introduction)Groundwater modelling (an Introduction)
Groundwater modelling (an Introduction)
 
Streamflow simulation using radar-based precipitation applied to the Illinois...
Streamflow simulation using radar-based precipitation applied to the Illinois...Streamflow simulation using radar-based precipitation applied to the Illinois...
Streamflow simulation using radar-based precipitation applied to the Illinois...
 
Birr - Identifying Critical Portions of the Landscape
Birr - Identifying Critical Portions of the LandscapeBirr - Identifying Critical Portions of the Landscape
Birr - Identifying Critical Portions of the Landscape
 
Effectiveness Analysis of Agriculture BMPs by SWAT Model for Apropriate Contr...
Effectiveness Analysis of Agriculture BMPs by SWAT Model for Apropriate Contr...Effectiveness Analysis of Agriculture BMPs by SWAT Model for Apropriate Contr...
Effectiveness Analysis of Agriculture BMPs by SWAT Model for Apropriate Contr...
 
GROUNDWATER MODELING SYSTEM
GROUNDWATER MODELING SYSTEMGROUNDWATER MODELING SYSTEM
GROUNDWATER MODELING SYSTEM
 
Hinshaw Davis Updating Catskill Mountain Regional Curves
Hinshaw Davis Updating Catskill Mountain Regional CurvesHinshaw Davis Updating Catskill Mountain Regional Curves
Hinshaw Davis Updating Catskill Mountain Regional Curves
 
Land cover change analysis
Land cover change analysisLand cover change analysis
Land cover change analysis
 
Modeling the Effects of Land Use Change on Flooding
Modeling the Effects of Land Use Change on FloodingModeling the Effects of Land Use Change on Flooding
Modeling the Effects of Land Use Change on Flooding
 
Analysis of runoff for vishwamitri river watershed using scs cn method and ge...
Analysis of runoff for vishwamitri river watershed using scs cn method and ge...Analysis of runoff for vishwamitri river watershed using scs cn method and ge...
Analysis of runoff for vishwamitri river watershed using scs cn method and ge...
 
Estimating Groundwater Availability at the Catchment Scale Using Streamflow R...
Estimating Groundwater Availability at the Catchment Scale Using Streamflow R...Estimating Groundwater Availability at the Catchment Scale Using Streamflow R...
Estimating Groundwater Availability at the Catchment Scale Using Streamflow R...
 
California; Harvesting Rain: Addressing Water Needs of the Monterey Peninsu...
California;  Harvesting Rain:  Addressing Water Needs of the Monterey Peninsu...California;  Harvesting Rain:  Addressing Water Needs of the Monterey Peninsu...
California; Harvesting Rain: Addressing Water Needs of the Monterey Peninsu...
 

Viewers also liked

Flood Risk Analysis for River Serio, Italy by using HECRAS & River 2D
Flood Risk Analysis for River Serio, Italy by using HECRAS & River 2DFlood Risk Analysis for River Serio, Italy by using HECRAS & River 2D
Flood Risk Analysis for River Serio, Italy by using HECRAS & River 2D
Arshia Mousavi
 
Upstream Suburban Philadelphia Sub-Watershed Cluster Modeling Overview
Upstream Suburban Philadelphia Sub-Watershed Cluster Modeling OverviewUpstream Suburban Philadelphia Sub-Watershed Cluster Modeling Overview
Upstream Suburban Philadelphia Sub-Watershed Cluster Modeling Overview
Kim Beidler
 
Flood hazard mapping four provinces of cambodia
Flood hazard mapping four provinces of cambodiaFlood hazard mapping four provinces of cambodia
Flood hazard mapping four provinces of cambodia
Institute of Space Knowledge Development
 
Automating HEC-RAS with Excel
Automating HEC-RAS with ExcelAutomating HEC-RAS with Excel
Automating HEC-RAS with Excel
Thomas Williams
 
Hec ras tutorial-flume_example
Hec ras tutorial-flume_exampleHec ras tutorial-flume_example
Hec ras tutorial-flume_example
khaledH
 
HEC-RAS tutorial on single bridge
HEC-RAS tutorial on single bridgeHEC-RAS tutorial on single bridge
HEC-RAS tutorial on single bridge
Nureen Anisha
 
Hec ras
Hec rasHec ras
Hec ras
Karan Tyagi
 

Viewers also liked (8)

Flood Risk Analysis for River Serio, Italy by using HECRAS & River 2D
Flood Risk Analysis for River Serio, Italy by using HECRAS & River 2DFlood Risk Analysis for River Serio, Italy by using HECRAS & River 2D
Flood Risk Analysis for River Serio, Italy by using HECRAS & River 2D
 
Upstream Suburban Philadelphia Sub-Watershed Cluster Modeling Overview
Upstream Suburban Philadelphia Sub-Watershed Cluster Modeling OverviewUpstream Suburban Philadelphia Sub-Watershed Cluster Modeling Overview
Upstream Suburban Philadelphia Sub-Watershed Cluster Modeling Overview
 
Flood hazard mapping four provinces of cambodia
Flood hazard mapping four provinces of cambodiaFlood hazard mapping four provinces of cambodia
Flood hazard mapping four provinces of cambodia
 
Automating HEC-RAS with Excel
Automating HEC-RAS with ExcelAutomating HEC-RAS with Excel
Automating HEC-RAS with Excel
 
Hec ras tutorial-flume_example
Hec ras tutorial-flume_exampleHec ras tutorial-flume_example
Hec ras tutorial-flume_example
 
HEC-RAS tutorial on single bridge
HEC-RAS tutorial on single bridgeHEC-RAS tutorial on single bridge
HEC-RAS tutorial on single bridge
 
Hec ras
Hec rasHec ras
Hec ras
 
floods
floodsfloods
floods
 

Similar to Investigating Flooding Pattern Using Hydrologic Engineering Center-River Analysis System (HEC-RAS) in the City of Painesville, Ohio

Diana Allen, SFU - Water Science Research: Challenges and Success Stories in ...
Diana Allen, SFU - Water Science Research: Challenges and Success Stories in ...Diana Allen, SFU - Water Science Research: Challenges and Success Stories in ...
Diana Allen, SFU - Water Science Research: Challenges and Success Stories in ...BC Water Science Symposium
 
Upper san fernando dam
Upper san fernando damUpper san fernando dam
Upper san fernando dam
Ruben Dario Aranda Leiva
 
DSD-INT 2019 Using D-Water Quality & D-Flow FM to model cohesive sediment tra...
DSD-INT 2019 Using D-Water Quality & D-Flow FM to model cohesive sediment tra...DSD-INT 2019 Using D-Water Quality & D-Flow FM to model cohesive sediment tra...
DSD-INT 2019 Using D-Water Quality & D-Flow FM to model cohesive sediment tra...
Deltares
 
Water Resource Sustainability of the Palouse Region: A Systems Approach
Water Resource Sustainability of the Palouse Region: A Systems ApproachWater Resource Sustainability of the Palouse Region: A Systems Approach
Water Resource Sustainability of the Palouse Region: A Systems Approach
Ramesh Dhungel
 
(055) river flood plains some observations on their formation
(055) river flood plains   some observations on their formation(055) river flood plains   some observations on their formation
(055) river flood plains some observations on their formationRavi Naid Gorle
 
Student Name Bud BennemanGeology 105 Spring 2020Paper Outline.docx
Student Name Bud BennemanGeology 105 Spring 2020Paper Outline.docxStudent Name Bud BennemanGeology 105 Spring 2020Paper Outline.docx
Student Name Bud BennemanGeology 105 Spring 2020Paper Outline.docx
deanmtaylor1545
 
Student Name Bud BennemanGeology 105 Spring 2020Paper Outline.docx
Student Name Bud BennemanGeology 105 Spring 2020Paper Outline.docxStudent Name Bud BennemanGeology 105 Spring 2020Paper Outline.docx
Student Name Bud BennemanGeology 105 Spring 2020Paper Outline.docx
cpatriciarpatricia
 
Changing Great Lakes Water Levels: Current Conditions and Future Projections
Changing Great Lakes Water Levels: Current Conditions and Future ProjectionsChanging Great Lakes Water Levels: Current Conditions and Future Projections
Changing Great Lakes Water Levels: Current Conditions and Future Projections
Graham Sustainability Institute at the University of Michigan
 
2016 Gold Kng Poster NMT April
2016 Gold Kng Poster NMT April2016 Gold Kng Poster NMT April
2016 Gold Kng Poster NMT AprilAnastasia Hedrick
 
Big Data & Machine Learning for Societal Benefit
Big Data & Machine Learning for Societal BenefitBig Data & Machine Learning for Societal Benefit
Big Data & Machine Learning for Societal Benefit
David Lary
 
Modeling analyses for fort lewis jblm drinking water system, aspect 2009
Modeling analyses for fort lewis jblm drinking water system, aspect 2009Modeling analyses for fort lewis jblm drinking water system, aspect 2009
Modeling analyses for fort lewis jblm drinking water system, aspect 2009
Sequalitchew Creek Watershed Council
 
Presentation: Unit 1 Introduction to the hydrological cycle
Presentation: Unit 1 Introduction to the hydrological cyclePresentation: Unit 1 Introduction to the hydrological cycle
Presentation: Unit 1 Introduction to the hydrological cycle
SERC at Carleton College
 
Fluvial Sedementation from Mt. Rainier
Fluvial Sedementation from Mt. RainierFluvial Sedementation from Mt. Rainier
Fluvial Sedementation from Mt. Rainier
Nisqually River Council
 

Similar to Investigating Flooding Pattern Using Hydrologic Engineering Center-River Analysis System (HEC-RAS) in the City of Painesville, Ohio (20)

Diana Allen, SFU - Water Science Research: Challenges and Success Stories in ...
Diana Allen, SFU - Water Science Research: Challenges and Success Stories in ...Diana Allen, SFU - Water Science Research: Challenges and Success Stories in ...
Diana Allen, SFU - Water Science Research: Challenges and Success Stories in ...
 
Upper san fernando dam
Upper san fernando damUpper san fernando dam
Upper san fernando dam
 
DSD-INT 2019 Using D-Water Quality & D-Flow FM to model cohesive sediment tra...
DSD-INT 2019 Using D-Water Quality & D-Flow FM to model cohesive sediment tra...DSD-INT 2019 Using D-Water Quality & D-Flow FM to model cohesive sediment tra...
DSD-INT 2019 Using D-Water Quality & D-Flow FM to model cohesive sediment tra...
 
Water Resource Sustainability of the Palouse Region: A Systems Approach
Water Resource Sustainability of the Palouse Region: A Systems ApproachWater Resource Sustainability of the Palouse Region: A Systems Approach
Water Resource Sustainability of the Palouse Region: A Systems Approach
 
Hawaii Pacific GIS Conference 2012: Disaster Management and Emergency Respons...
Hawaii Pacific GIS Conference 2012: Disaster Management and Emergency Respons...Hawaii Pacific GIS Conference 2012: Disaster Management and Emergency Respons...
Hawaii Pacific GIS Conference 2012: Disaster Management and Emergency Respons...
 
Minsley et al 2011 - JEEG
Minsley et al 2011 - JEEGMinsley et al 2011 - JEEG
Minsley et al 2011 - JEEG
 
(055) river flood plains some observations on their formation
(055) river flood plains   some observations on their formation(055) river flood plains   some observations on their formation
(055) river flood plains some observations on their formation
 
Bathymetric Survey of Cross Lake
Bathymetric Survey of Cross LakeBathymetric Survey of Cross Lake
Bathymetric Survey of Cross Lake
 
Student Name Bud BennemanGeology 105 Spring 2020Paper Outline.docx
Student Name Bud BennemanGeology 105 Spring 2020Paper Outline.docxStudent Name Bud BennemanGeology 105 Spring 2020Paper Outline.docx
Student Name Bud BennemanGeology 105 Spring 2020Paper Outline.docx
 
Student Name Bud BennemanGeology 105 Spring 2020Paper Outline.docx
Student Name Bud BennemanGeology 105 Spring 2020Paper Outline.docxStudent Name Bud BennemanGeology 105 Spring 2020Paper Outline.docx
Student Name Bud BennemanGeology 105 Spring 2020Paper Outline.docx
 
Changing Great Lakes Water Levels: Current Conditions and Future Projections
Changing Great Lakes Water Levels: Current Conditions and Future ProjectionsChanging Great Lakes Water Levels: Current Conditions and Future Projections
Changing Great Lakes Water Levels: Current Conditions and Future Projections
 
2016 Gold Kng Poster NMT April
2016 Gold Kng Poster NMT April2016 Gold Kng Poster NMT April
2016 Gold Kng Poster NMT April
 
final report
final reportfinal report
final report
 
GEOG_362_FINAL
GEOG_362_FINALGEOG_362_FINAL
GEOG_362_FINAL
 
Big Data & Machine Learning for Societal Benefit
Big Data & Machine Learning for Societal BenefitBig Data & Machine Learning for Societal Benefit
Big Data & Machine Learning for Societal Benefit
 
Anthony_GIS
Anthony_GISAnthony_GIS
Anthony_GIS
 
Modeling analyses for fort lewis jblm drinking water system, aspect 2009
Modeling analyses for fort lewis jblm drinking water system, aspect 2009Modeling analyses for fort lewis jblm drinking water system, aspect 2009
Modeling analyses for fort lewis jblm drinking water system, aspect 2009
 
Presentation: Unit 1 Introduction to the hydrological cycle
Presentation: Unit 1 Introduction to the hydrological cyclePresentation: Unit 1 Introduction to the hydrological cycle
Presentation: Unit 1 Introduction to the hydrological cycle
 
Rude_Undergraduate_Thesis
Rude_Undergraduate_ThesisRude_Undergraduate_Thesis
Rude_Undergraduate_Thesis
 
Fluvial Sedementation from Mt. Rainier
Fluvial Sedementation from Mt. RainierFluvial Sedementation from Mt. Rainier
Fluvial Sedementation from Mt. Rainier
 

Investigating Flooding Pattern Using Hydrologic Engineering Center-River Analysis System (HEC-RAS) in the City of Painesville, Ohio

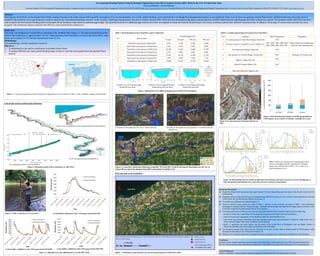
  • 1. B) Ice jam study in the Grand River 1,3 4 Investigating Flooding Pattern Using Hydrologic Engineering Center-River Analysis System (HEC-RAS) in the City of Painesville, Ohio Niraj Lamichhane1, Suresh Sharma2 1Graduate Student, Civil/Environmental Engineering Program, Youngstown State University, One University Plaza, Youngstown, OH 44555; (330)-259-6019, Email: nlamichhane@student.ysu.edu, 2Assistant Professor, Civil/Environmental Engineering Program, Youngstown State University, One University Plaza, Youngstown, OH 44555; (330)941-1741, Email: ssharma06@ysu.edu Study area This study was conducted on a Grand River watershed of the Northern Ohio (Figure 1). The total watershed area of the outlet of the Grand River is approximately 705 mi2. Major portions of the watershed is covered with forest (44%), water bodies and wetlands (14.7%) and developed/urban land (10.3%). Methodology The methodology is briefly sketched in section A. Objectives 1. To understand ice jam and its contribution to probable future floods. 2. To prepare different year return period flooding maps in order to warn the local people about the potential flood hazards. Abstract The majority of the Rivers in the northern belt of Ohio undergo freezing in the winter season with a possible consequence of an ice jam formation. As a result, sudden flooding can be experienced even though the anticipated precipitation is not significant. Since river ice jams can generate extreme flood events, detailed monitoring of ice jam record is needed for the prediction of ice jam break up in order to improve the conventional hydrologic forecast. In this research, Hydrologic Engineering Center-River Analysis System (HEC-RAS) has been developed using high resolution datasets, LIDAR (Light Detection and Ranging) and field verified cross section. The hydraulic model, HEC-RAS has been used to predict the downstream flooding pattern and prepare flood inundation maps based on upstream gage height. The potential locations for additional gage stations have been investigated to ensure downstream flood forecast a few hours in advance and provide sufficient evacuation time. In addition, flood maps of various return periods have been prepared. Our preliminary analysis indicates that 500 year return period flood is destructive. 0 1000 2000 3000 4000 5000 6000 7000 Discharge(cfs) Date Observed discharge Simulated discharge a) Streamflow calibration at the USGS gage station 04212100 0 1000 2000 3000 4000 5000 6000 7000 8000 9000 Discharge(cfs) Date Observed discharge Simulated discharge b) Streamflow validation at the USGS gage station 04212100 Figure 8. Ice jam upstream of Fairport Harbor in 2014 Figure 7: Historical ice jam locations at various sections along the Grand River, Ohio Result and Discussions  Flood from Harpersfield (upstream) takes approximately 4-6 hours (depending upon the nature of the flood) to reach the City of Painesville.  Hydraulic analysis of the Grand River was conducted using HEC-RAS (Figure 2). Cross sections of the Grand River to be used in HEC-RAS was verified from the field survey (Figure 3).  The model was calibrated and validated (Figure 4).  Floods of different return period are listed in Table 1 and the ice jam locations are listed in Table 2. Our preliminary investigation concludes that the Vrooman bridge, Lakeland Freeway bridge and High Street bridge along the section of the Grand River might be flooded (during 500 year return period)  Flood plain delineation of 500 year return period using HEC-RAS and HEC-GeoRAS (Figure 6) shows followings: • around 12 houses have a high chance of flooding near the junction of the Big Creek and Grand River; • nearly 25 houses and 4 apartments will be flooded in Steel Ave and Grand River Ave ; • some of the areas Kiwanis Recreation Park and Casement Golf Course just downstream of Main St. bridge in the City of Painesville and Hidden Valley Park in Madison will be flooded; • nearly 11 apartments and some houses near the banks of the Grand River in Huntington road and Hidden Harbor of Painesville including some other harbors are under the risk of flooding;  The historical climatic study shows that the formation of ice jam is more often in Neutral period of ENSO phases while showing the least chances in La Niña period (Figure 10).  Melting of ice in the late winter due to increase in mean air temperature has a significant contribution to winter flooding. 0 2000 4000 6000 8000 10000 12000 Discharge(cfs) Date Observed discharge Simulated discharge c) Streamflow validation at the USGS gage station 04212100 Figure 1. A map showing study area (the Grand River) spreading out to four counties of Ohio. ( Lake, Ashtabula, Geauga and Trumbull) Figure 4. Calibration (a), and validation (b & c) of the HEC-RAS Figure 3. Field verification of cross sections Table 1. Flood discharge in the Grand River and it’s tributaries S.N. Locations Dates of occurrence Description 1. 0.1 mile upstream of Main Street Bridge, Painesville 2014 2. Upstream section of Grand River near E Walnut Ave. 1981, 1982, 1984, 1988, 2003, 2007, 2008, 2009, 2010, 2011 Most of them were breakup jams and some were releasing jams 3. Near Main Street Bridge, Painesville 1978 4. Just upstream of Vrooman Bridge, Vrooman Rd 2014 Blockage of Vrooman road 5. Bank St., Painesville, OH 2014 - 5. Water St, Fairport Harbor, OH 2014 - 6. Near 4842 Bailey Rd, Madison, OH - - Table 2. Location and periods of ice jams in the Grand River 0 200 400 600 800 1000 1200 La Niña El Niño Neutral AccumulatedFreezingDegreeDays(0F) Figure 9. Box plot showing variation of AFDD during different ENSO phases as an evidence of climatic variability in ice jam Conclusion  Many houses, bridges and people near the banks of the Grand River will be under the risk of 500 year return period flood.  Early flood warning systems should be developed to provide sufficient warnings for the protection of lives and properties. Figure 6. Grand River flood plain delineation using HEC-RAS and HEC-GeoRAS showing the flood plain near the City of Painesville (a), and at the junction of the Mill Creek and the Grand River (b) 10 year flood 50 year flood 100 year flood 500 year flood a) Details of flood plain near the City of Painesville area City of Painesville Fairport Harbor Lake Erie b) Details of flood plain near the junction of the Mill Creek and Grand River Lake Erie Painesville Big Creek S.N Stream Name Flood discharge (cfs) 10 years 50 years 100 years 500 years 1. Grand River upstream at Harpersfield 8,870 11,200 12,300 14,400 2. Mill Creek at the junction of Grand River 1,420 2,030 2,300 2,890 3. Grand River at the junction of Mill Creek 10,290 13,230 14,600 17,290 4. Painecreek at the junction of Grand River 2,120 3,080 3,500 4,460 5. Grand River at the junction of Painecreek 12,410 16,310 18,100 21,750 6. Big Creek at the junction of Grand River 3,390 4,940 5,620 7,170 7. Grand River at the junction of Big Creek 15,800 21,250 23,720 28,920 Figure 5. High flood level in different bridges from the HEC-RAS simulation b) Water Level at Lakeland Freeway bridge during 500 year flood c) Water Level at High Street bridge during 500 year flood a) Water Level at Vrooman bridge during 500 year flood Acknowledgement Authors would like to acknowledge for the grant support provided by the Ohio Sea Grant for this research. A) Hydraulic analysis and flood plain delineation Figure 2. Hydraulic model of the Grand River in HEC-RAS b) XYZ perspective plot of Grand River a) Plan view of Grand River (From Harpersfield to Fairport Harbor) c) Longitudinal profile of the Grand River Note: AFDD is an Accumulated Freezing Degree Days, which is calculated using the summation of Freezing Degree Days (FDD); that is, FDD = 32-Ta, where Ta is mean temperature of air. Figure 10. Relationship between AFDD, precipitation and discharge showing an increase in winter flooding due to both precipitation and melting of ice (caused by increase in mean air temperature) 25 6 7