Late Noachian Icy Highlands climate model: Exploring the possibility of trans...
GEOG_362_FINAL
1. Final Project for Geog 362 Fall 2015 Remote Sensing Image Analysis -- Instructor: Guido Cervone (cervone@psu.edu) http://cervone.psu.edu http://geoinf.psu.edu
Geoinformatics and Earth Observation Laboratory, Department of Geography and Institute for CyberScience
The Pennsylvania State University, University Park, PA
Increasing human population and infrastructure has an array of
issues that normally accompany its presence, and State College
is no exception. As the university and town grows dealing with
storm water management becomes increasingly difficult, and the
runoff from urban areas can have ill effects on the once rural
based waterways of the Spring Creek watershed
Higher maximum and average temperatures in a naturally cold
water fishery can devastate the local ecology, especially trout.
Spring Creek and other parts of the watershed have traditionally
been an ideal location for trout, however the rise in stream
temperatures have pushed them out of their natural habitat. The
objective of this study was to identify characteristics of healthy
and thermally impaired sub-watersheds according to the amount
and type of infrastructure in the area.
Introduction
To begin the Spring Creek watershed was analyzed as well as
the individual temperature reading sites to identify locations of
urban development in the case of Lower Slab Cabin, farmland
and moderate urban area for Upper Slab Cabin, and mostly
farmland and forested areas for Cedar Creek. The boundary
data for each watershed taken from the StreamStats site was
applied to a base map using Esri Arcmap. Then a Normalized
Difference Vegetation Index (NDVI) was performed on the
satellite imagery taken from Landsat 7 using R Studio a data
analysis suite. This test analyzed the levels of urban areas
within the Spring Creek watershed as well as the individual
watersheds for each station. Here higher densities of urban
infrastructure were shown and cross referenced with the
maximum temperature data to display the thermal impact on
stream temperature that human development has. Three
different NDVIs were created for the years of 1999, 2005, and
2015. The range between the first and last NDVI provided a
gauge of the urban growth in this part of Pennsylvania. The
NDVI images exported from R were then georectified using
ArcMap to show the watershed extents on top of the land cover
types.
Methodology
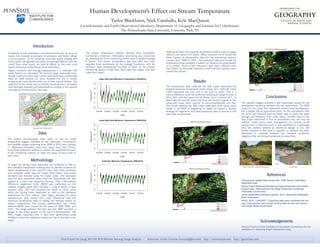
The temperature data collected the Slab Cabin watershed has
multiple maximum temperature peaks above 25°C, while the Cedar
Creek watershed has only one in the past 15 years. This is a
critical difference since the preferred temperature range of trout is
10 to 16°C, and the upper limit for Brown trout is around 26°C. In
Slab Cabin the warmer water may force the trout to migrate or die,
along with many other species of macroinvertebrates and fish.
The runoff entering the Slab Cabin watershed from urban areas
visible in the NDVI is degrading its ability to sustain a healthy
ecology for organisms that were previously able to survive in this
cold water environment.
Results
Conclusions
The satellite imagery provided a few reasonable causes for the
temperature variations between the two watersheds. The NDVI
series for the Cedar Run watershed shows some development,
but is largely still an agricultural area. As the precipitation falls
the farms and forested land are better able to retain the water
through soil infiltration than urban areas. Another issue in the
Slab Cabin watershed is that its boundaries may not truly be
defined. Urban storm water management can transfer runoff
volume from a collection point in one watershed to a discharge
area into another whether by intentional design or not, and
further research in this area is required. In contrast the other
watershed is centered between two forested sandstone
ridgelines that are strong boundaries for water flow.
References
Pennsylvania Spatial Data Access Site. 1996. Spring Creek Basin
Watershed Area.
Spring Creek Watershed Monitoring Project temperature and station
location data. Retrieved from the Water Resources Coordinator
Clearwater Conservancy.
USGS StreamStat Interactive website. 2015. StreamStat Watershed
Basin Delineation.
NASA. 2015. “LANDSAT 7, Supplying data users worldwide with low
cost, multi-purpose, land remote sensing data into the next century”
The United States Government.
Acknowledgements
Special Thanks to Katie Ombalski at Clearwater Conservancy for her
assistance in obtaining stream temperature data.
Human Development’s Effect on Stream Temperature
Taylor Blackburn, Nick Caraballo, Kyle MacQueen
The stream temperature dataset received from ClearWater
Conservancy extensive. Information processing was conducted
by assessing all of the monitoring station data in graphs through
R Studio. The stream temperature data was split into three
separate Excel worksheets by the average, maximum, and the
minimum daily temperature recorded at each of the chosen
monitoring stations (Cedar Run, Slab Cabin Run Upper, and Slab
Cabin Run Lower).
Data
The project encompassed data taken in situ by small
temperature loggers operated by the Clearwater Conservancy
and satellite imagery spanning from 1999 to 2015 from Landsat
7. Watershed boundary data was taken from the U.S.G.S.
StreamStat interactive website to outline the watershed for each
of the monitoring stations to show the types of land cover in
each zone.
Slab Cabin Run Utility Drilling Site Cedar Run
Splitting the data into separate worksheets made it easy to assign
matrix’s and values in R studio. When exported into R Studio the
three classes of temperature data for the monitoring stations
covered from 1999 to 2015. The extensive collection period for
temperature helps establish a pattern of influence by development
on a stream. Some of the tributaries have been affected more
than others by thermally impacted runoff and less riparian cover
around the stream.
Spring Creek Watershed