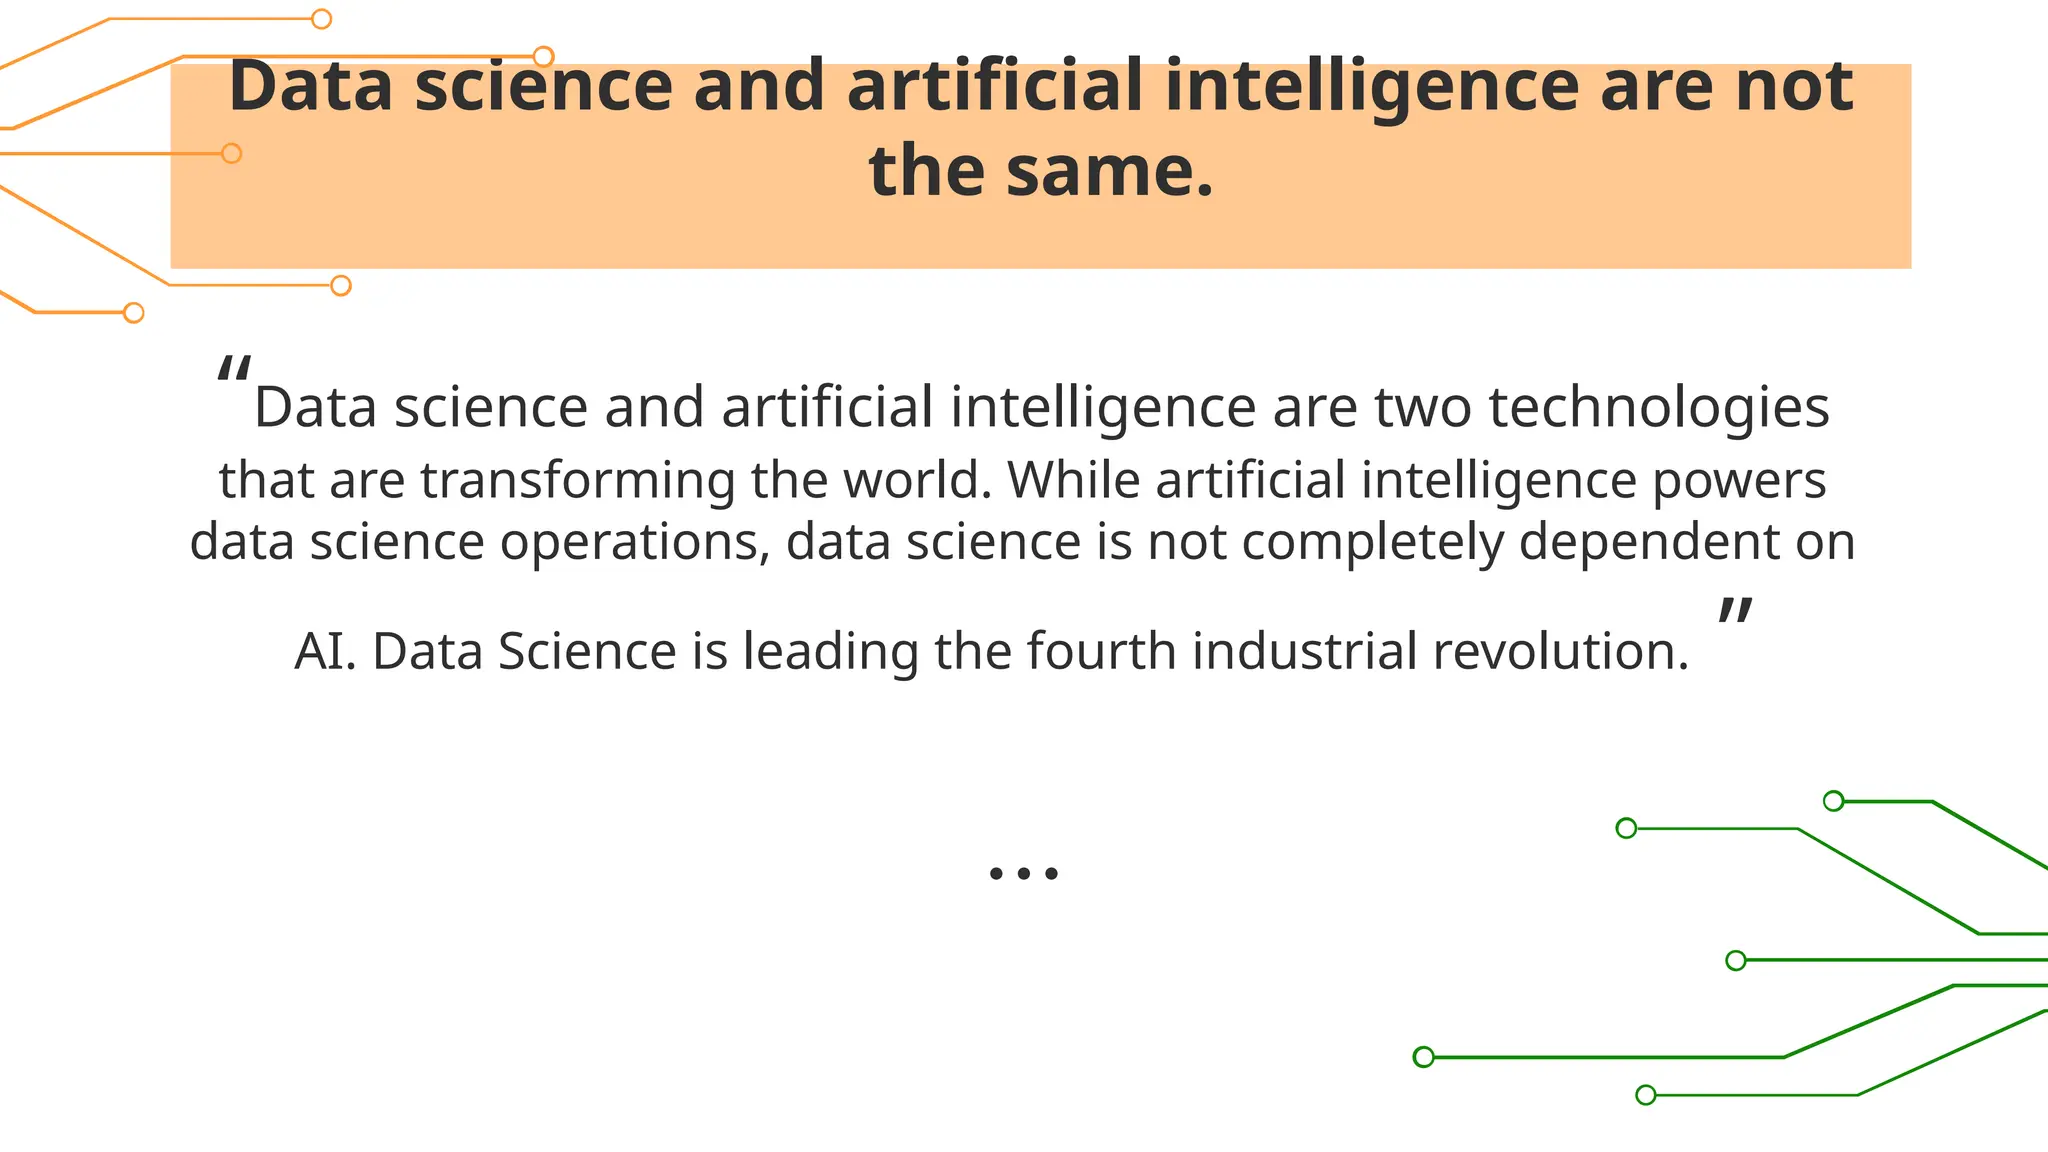
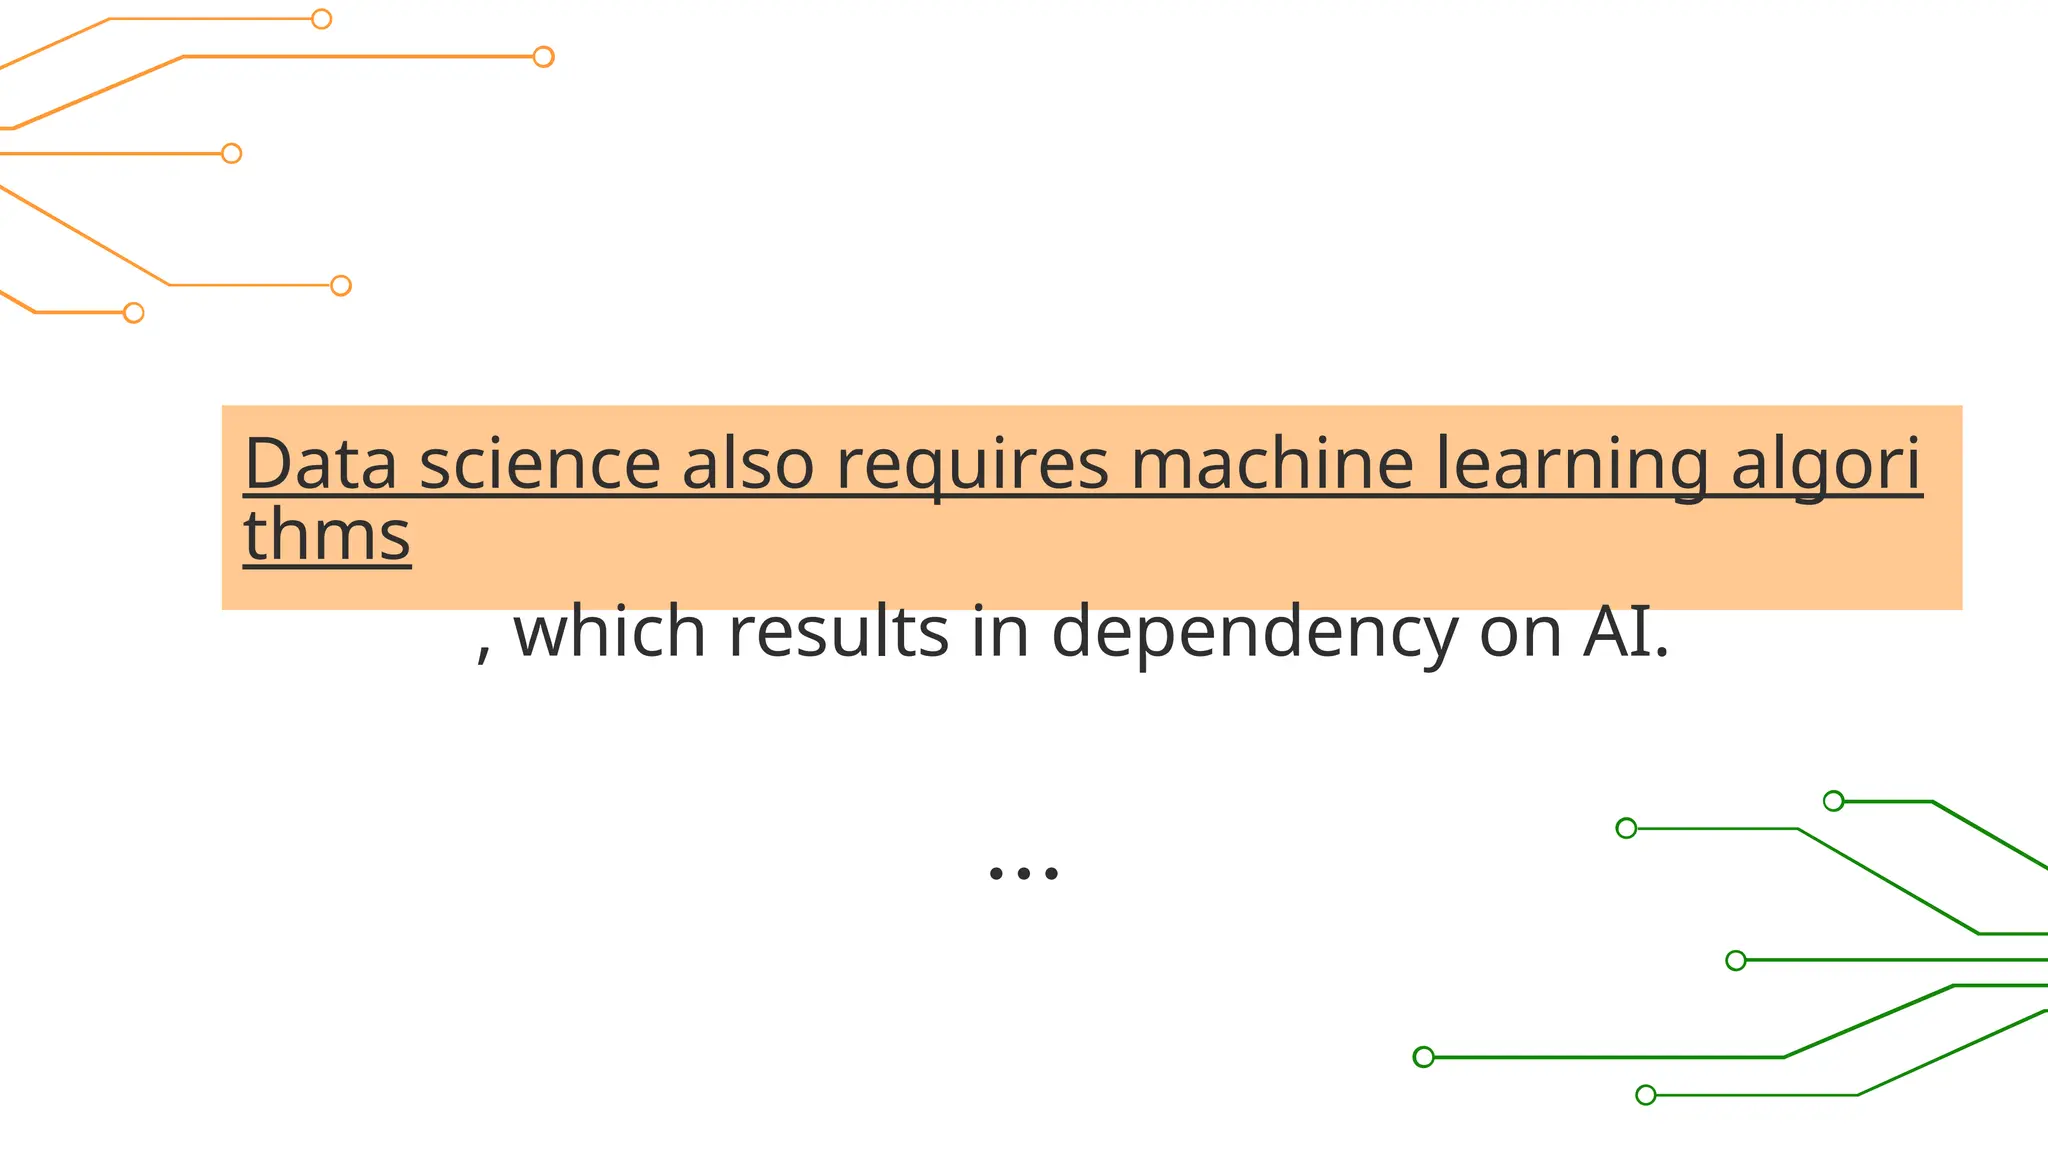
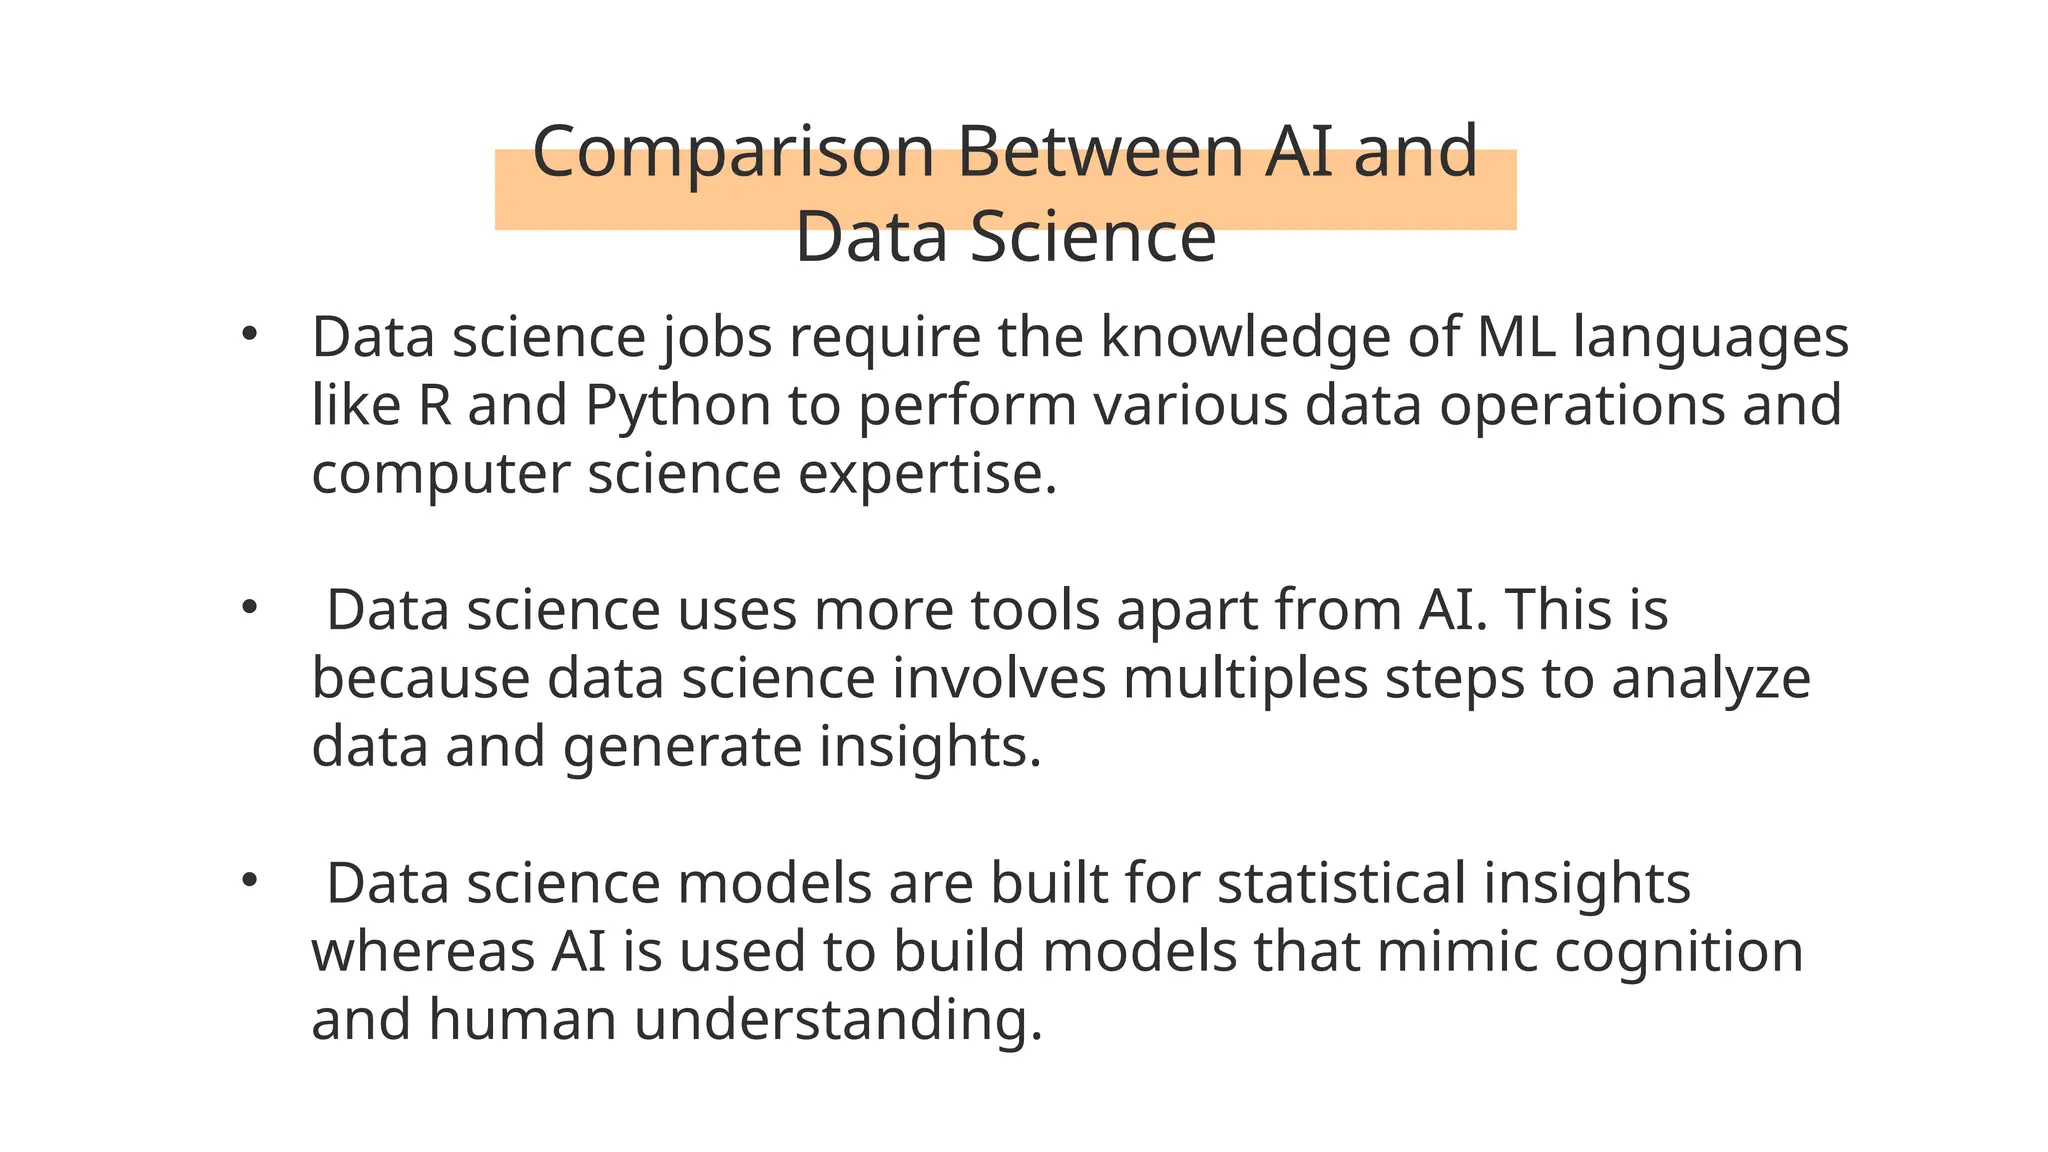
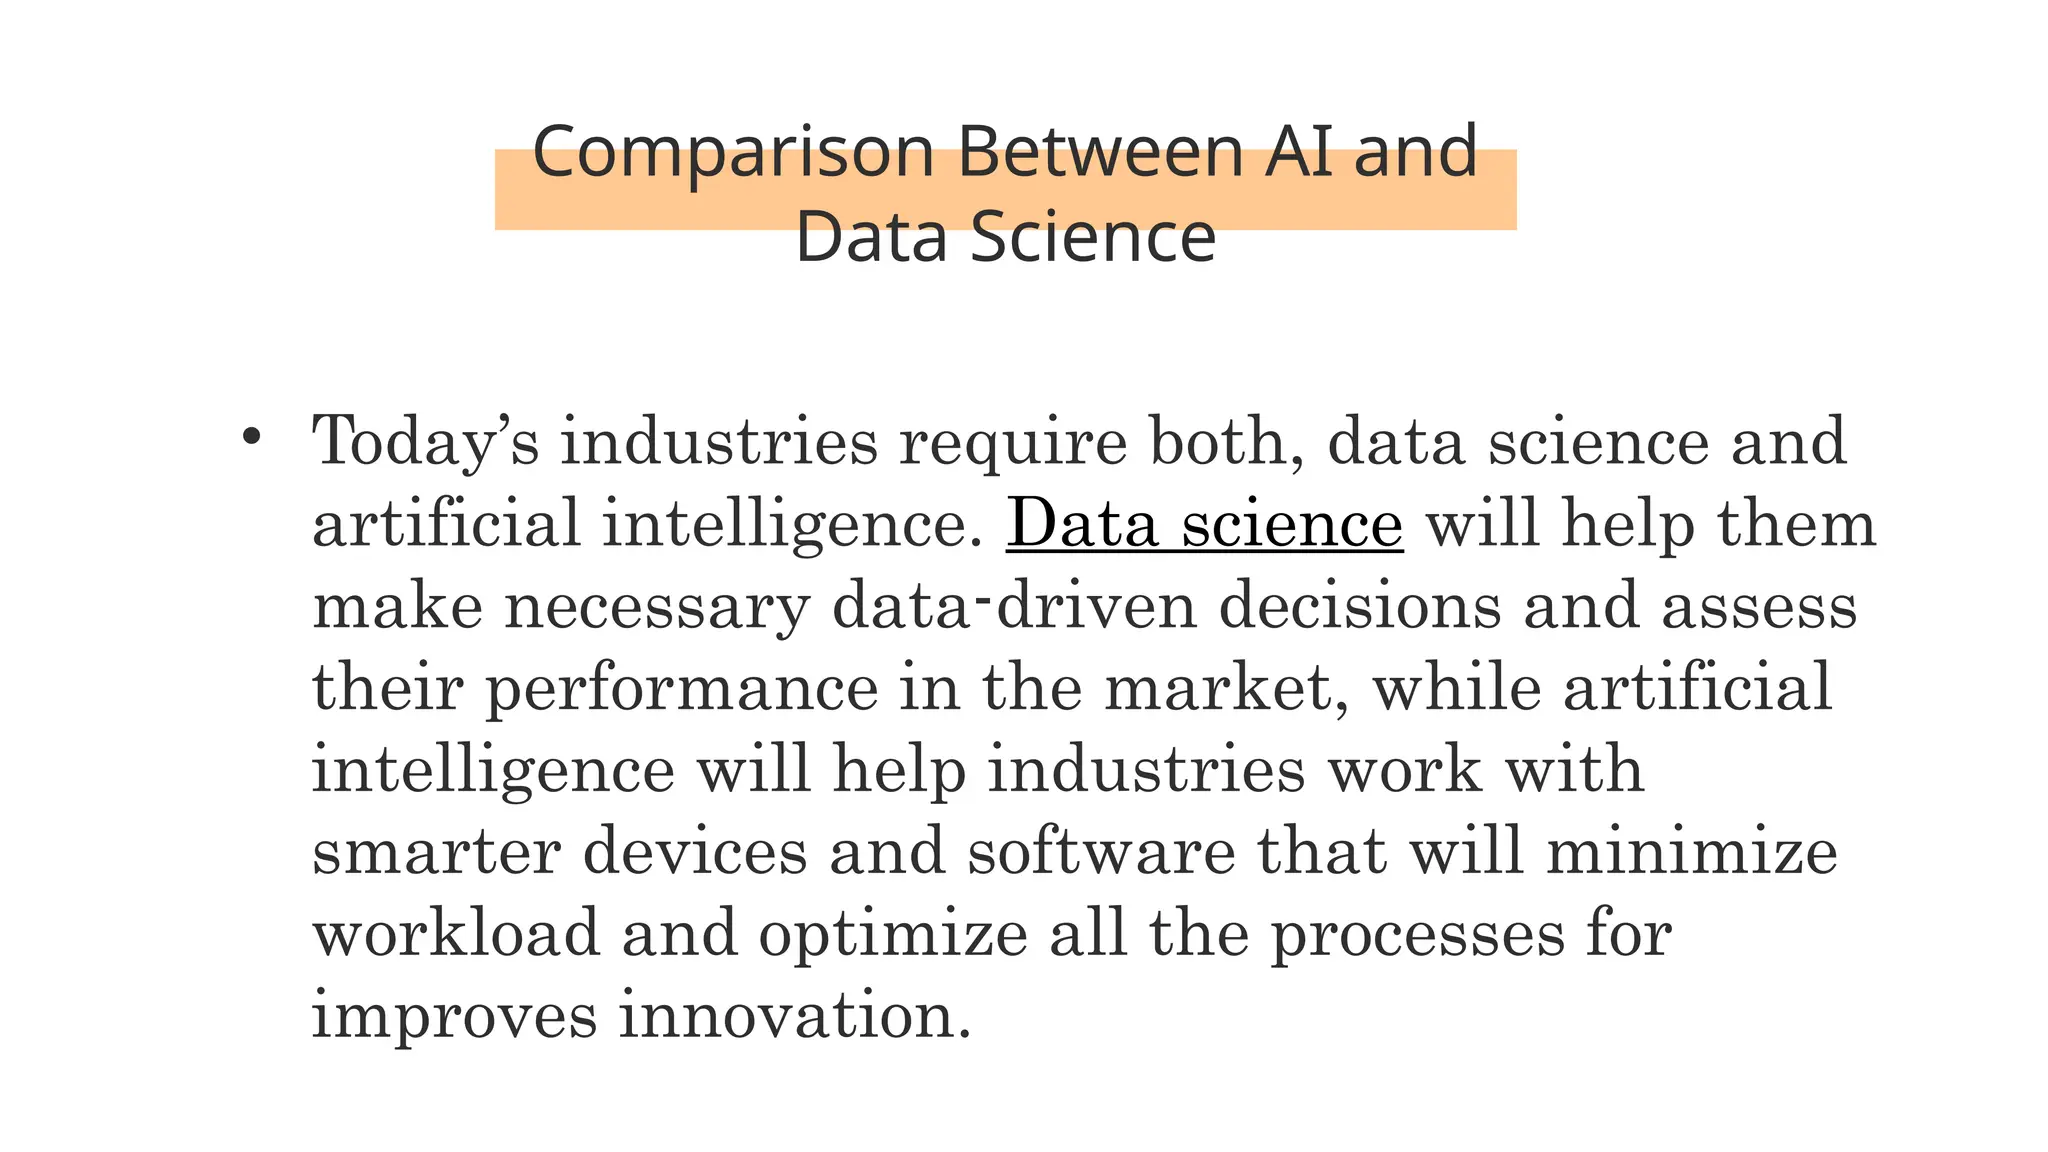
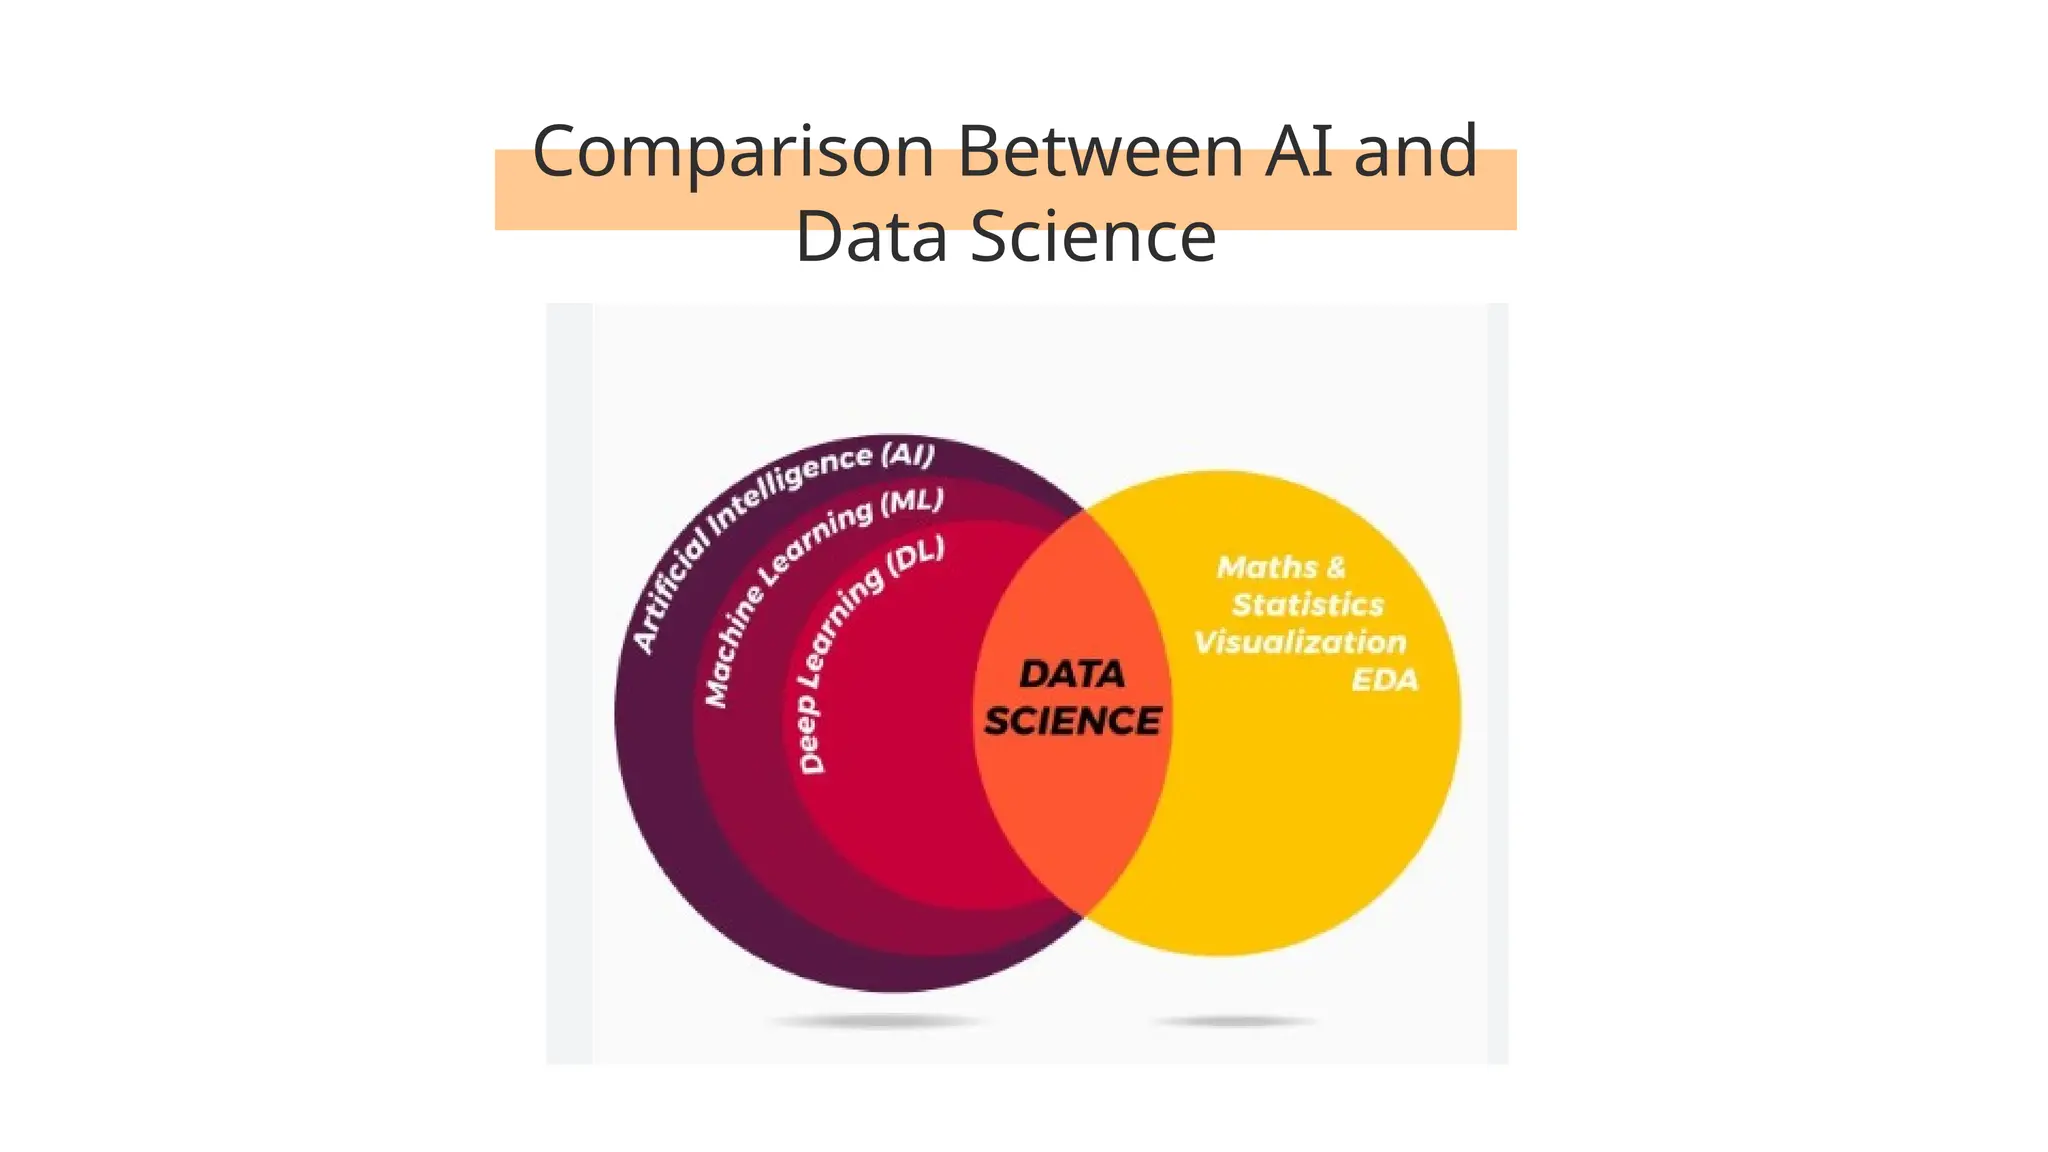
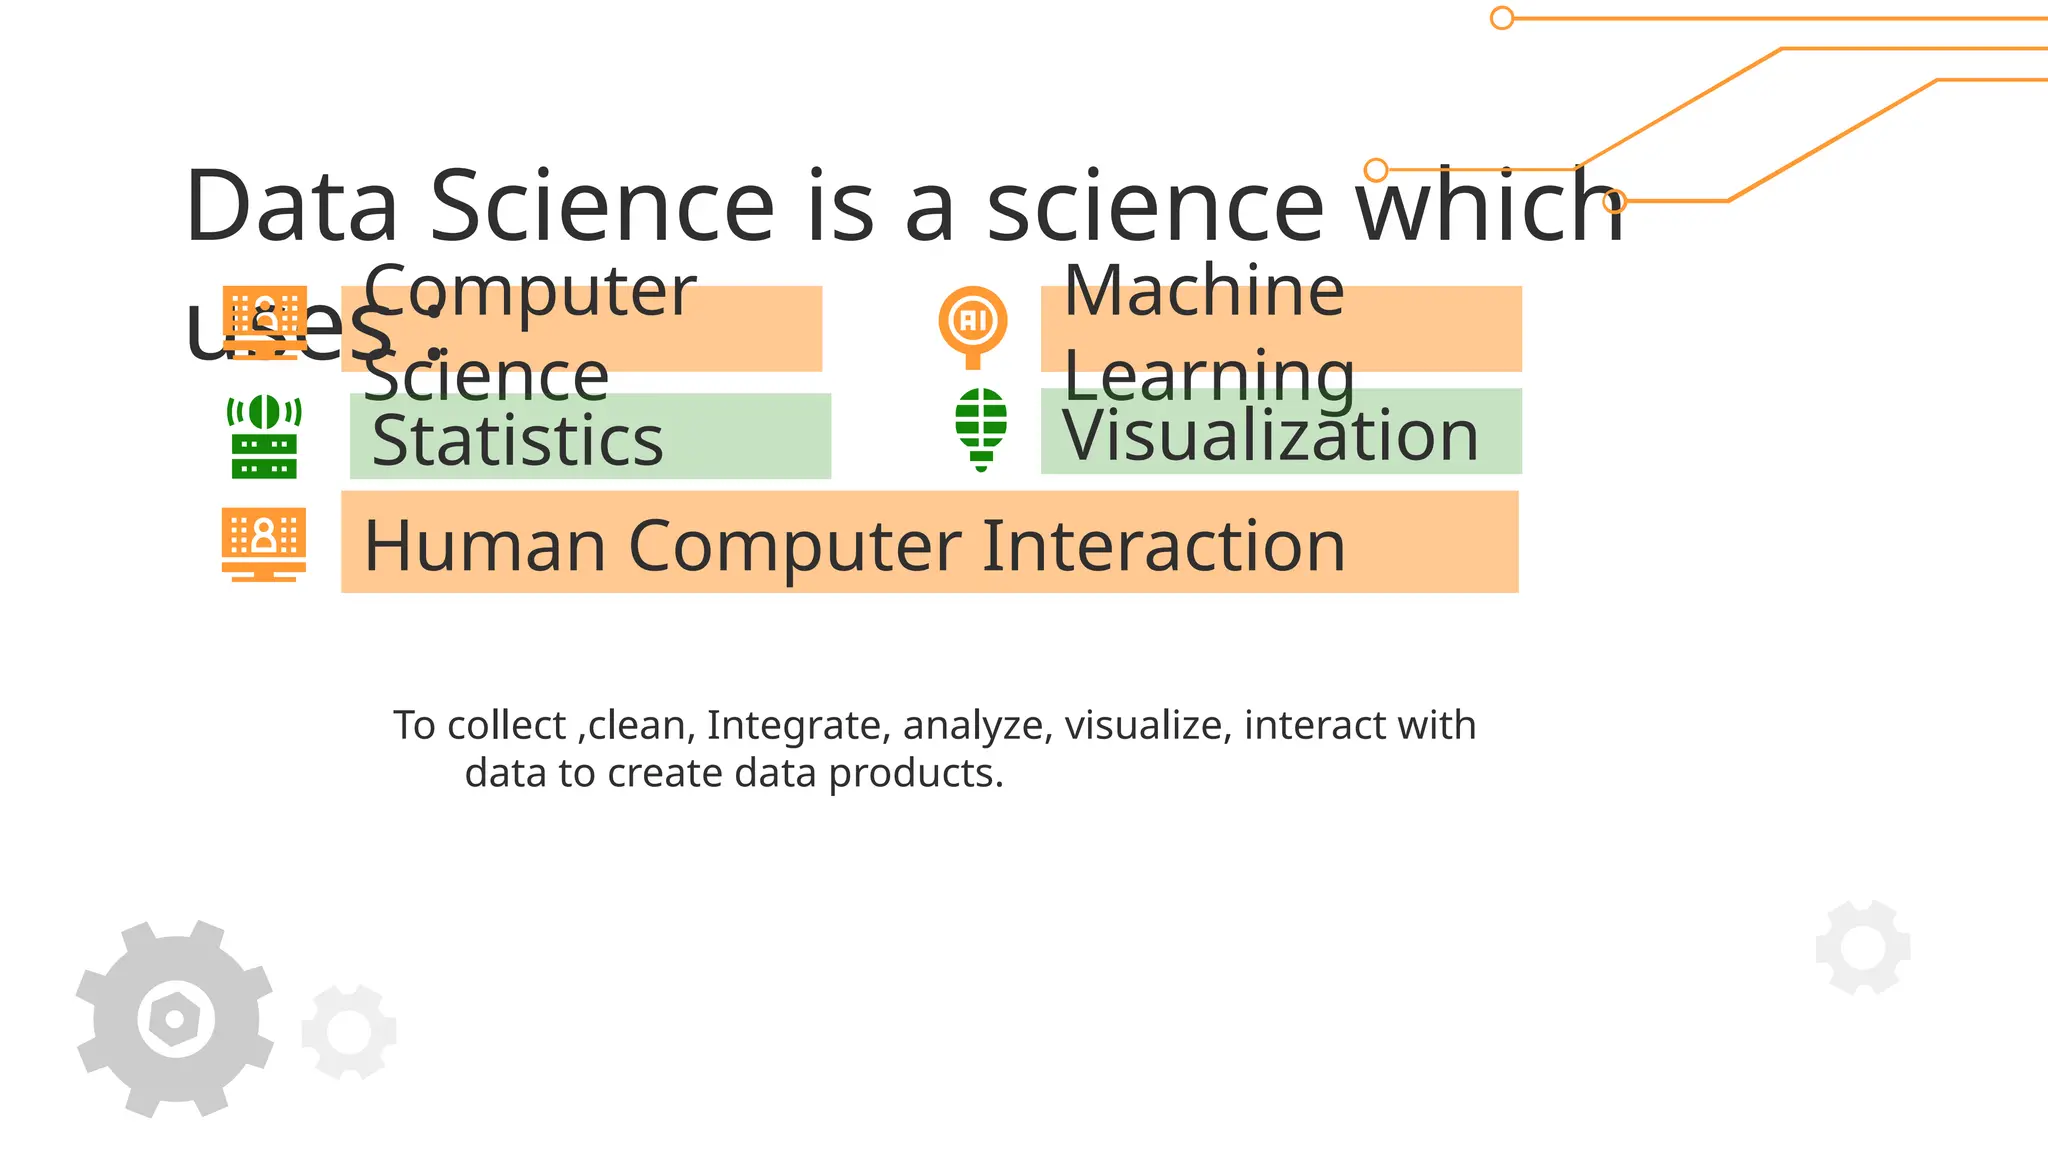
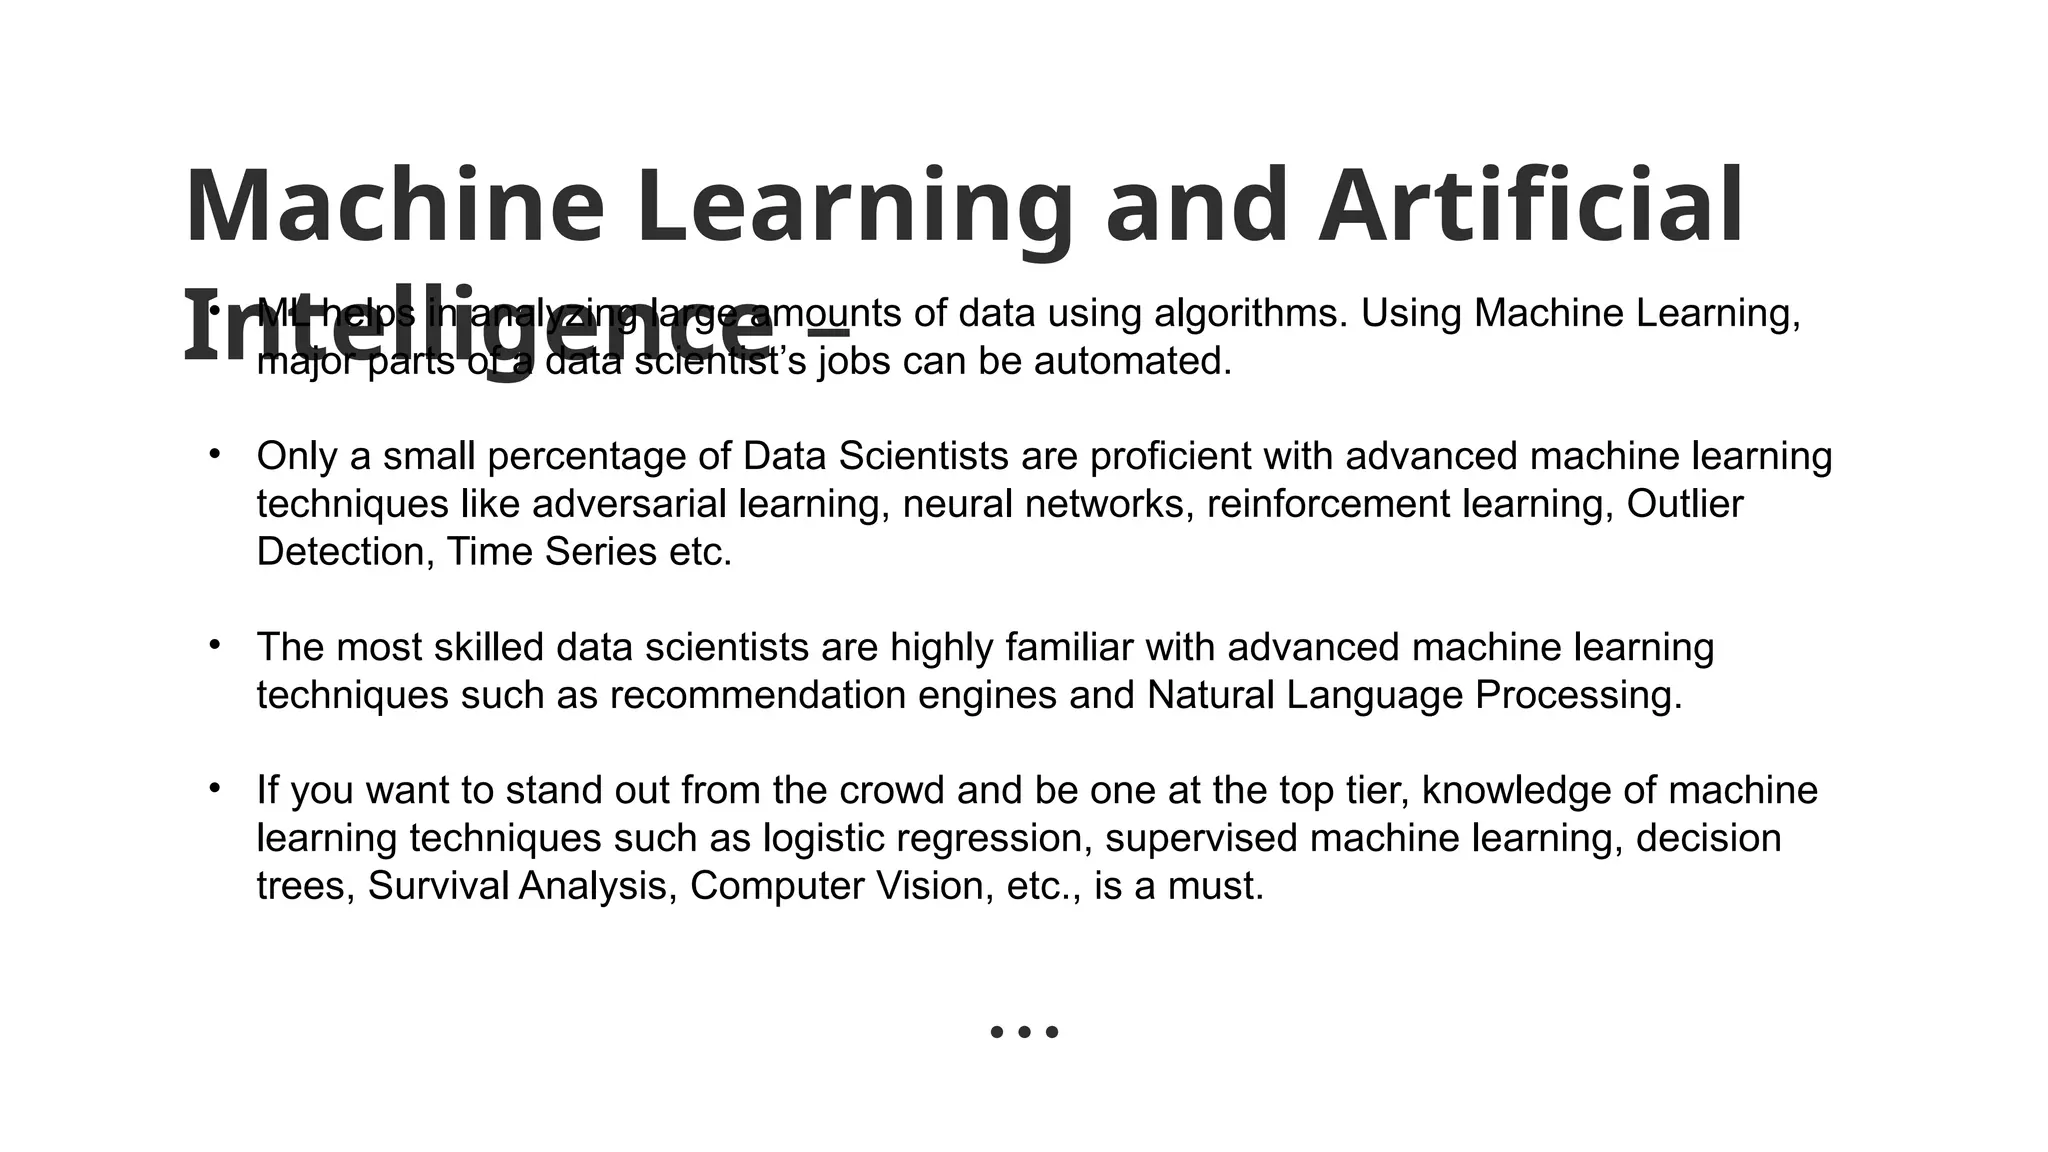
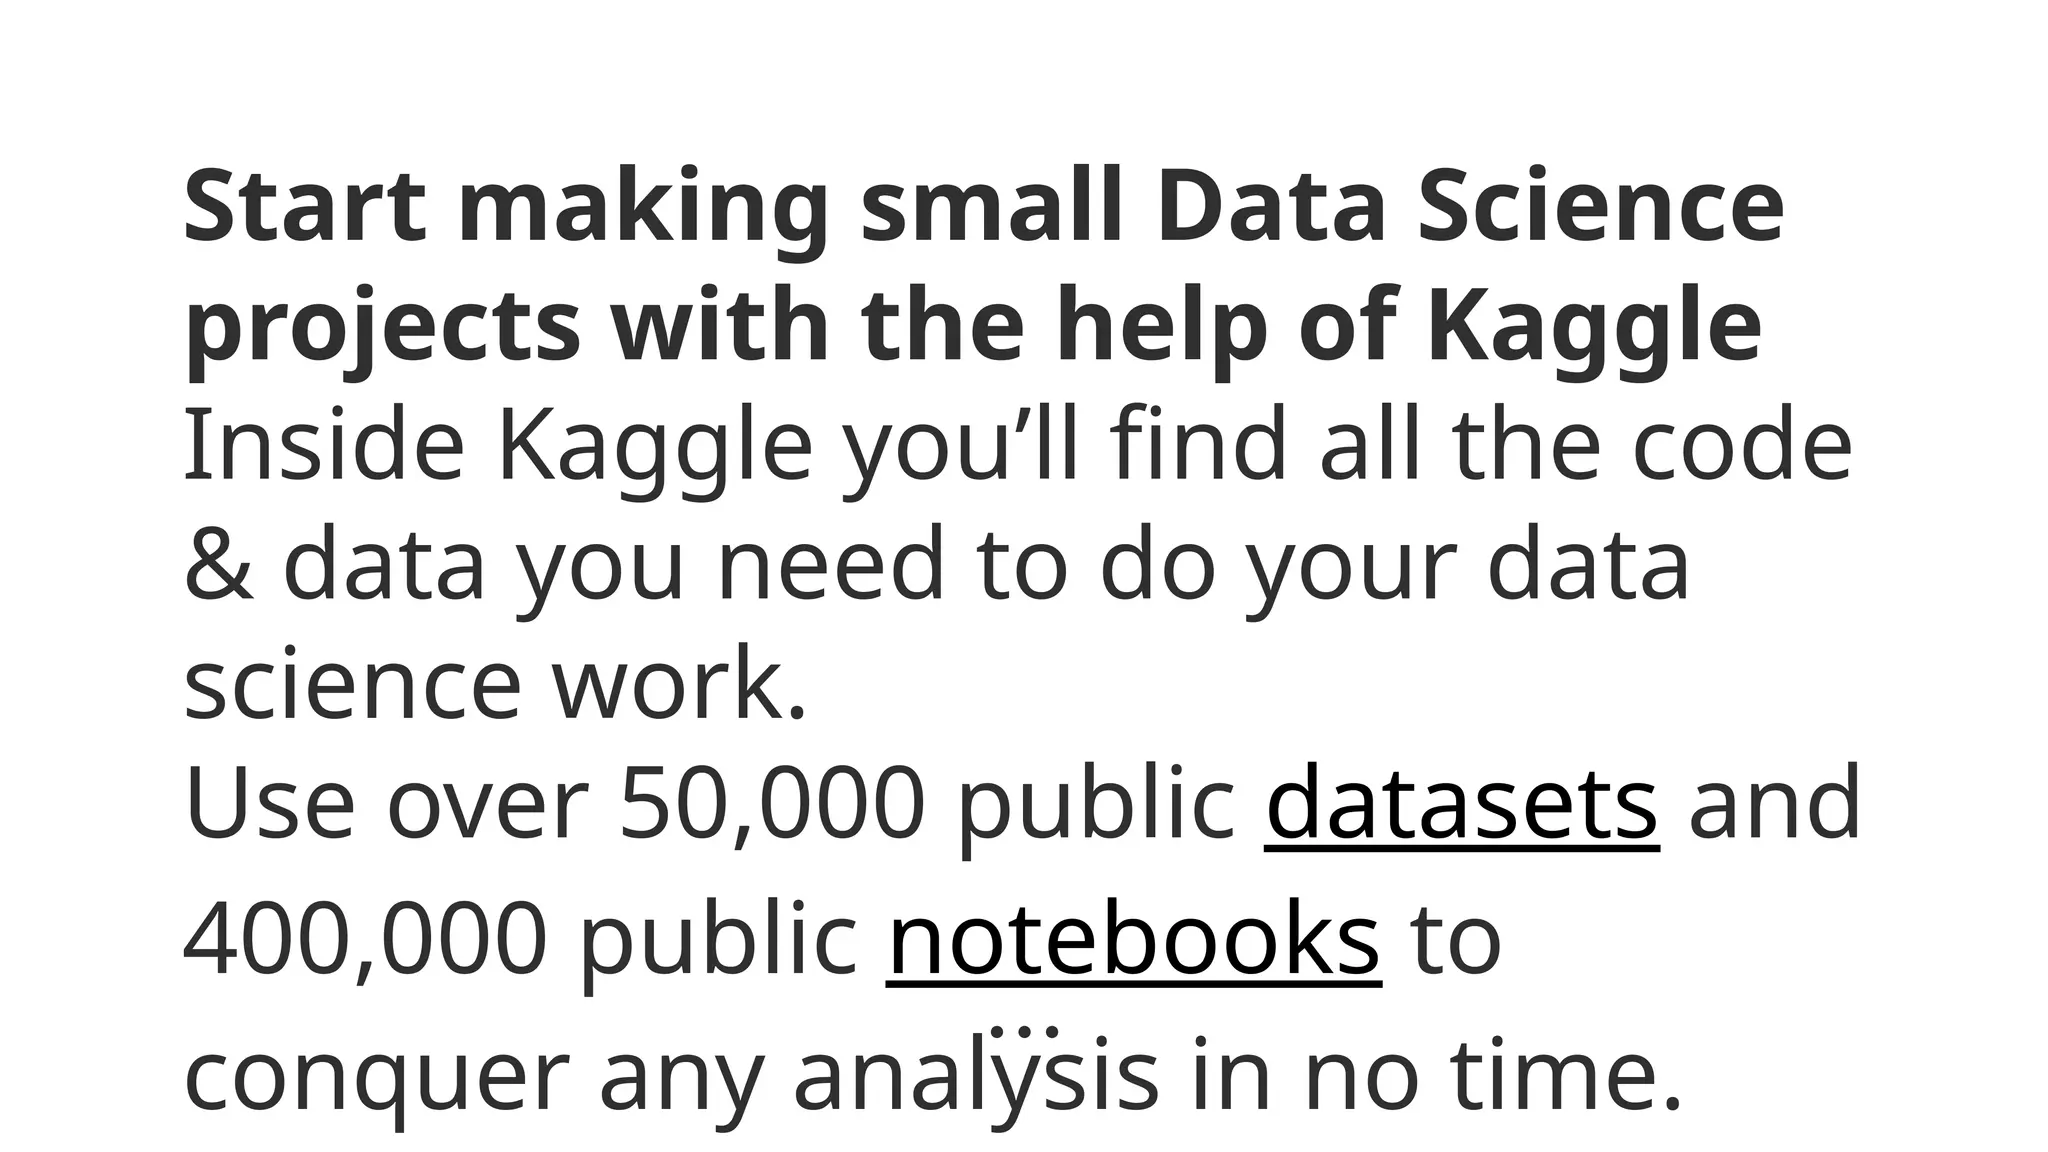
An
Introduction
to DATA
SCIENCE
By: Shweta Saraswat
0
1 Definitions and Examples
0
2 What exactly data science and
data scientist do?
0
3 Relation between artificial
ineliigence and data science
0
4 To become a data scientist
one should know the various
techniques.
TABLE OF CONTENTS
Data Science &
Importance
Data Science
Process
AI and Data
Science
Prerequisites for
DS
What is Data
Science?
Data science is an
interdisciplinary field that uses
algorithms, procedures, and
processes to examine large
amounts of data in order to
uncover hidden patterns,
generate insights, and direct
decision making.
Importance
of Data
Science
01
Career Opportunities
"The rise of Data Science needs will create roughly 11.5 million job openings by
2026" US Bureau of Labour Statistics
"By 2026, Data Scientists and Analysts will become the number one emerging
role in the world." World Economic Forum
Data Science and Artificial Intelligence are amongst the hottest fields of the
21st century that will impact all segments of daily life by 2025, from transport
and logistics to healthcare and customer service.
Examples:
Oil giant Shell, for instance, used data science to anticipate machine failure at
facilities across the world.
Agricultural company Cargill developed a mobile data-tracking app that helps
shrimp farmers reduce mortality rates.
Dr. Pepper Snapple Group analyzed data with machine learning to glean more
details about beverage sales and vendors.
And freight company Pitt Ohio used historical data and predictive analytics to
estimate delivery time with 99 percent accuracy.
Facts on Data Generation
Facts on Data Genaration
Statistics show that more than 500 terabytes of new data are
entered into the databases of the social networking site
Facebook every day.
• A single Jet engine can generate over 10 terabytes of data in
30 minutes of flight time. With several thousand flights per
day, data generation reaches several petabytes.
• Stock Exchange is also an example of big data that generates
about a terabyte of new trade data per day
How does
Data Science
Work?
02
Collect Data
Raw data is gathered
from various sources that
explain the business
problem
Using various statistical
analysis, and machine
learning approaches,
data modeling is
performed to get the
optimum solutions that
best explain the business
problem.
Actionable insights that
will serve as a solution
for the business
problems gathered
through data science.
How does Data Science Work?
Analyze Data Insights
Collect Data
Gather the previous data
on the sales that were
closed.
Use statistical analysis to
find out the patterns that
were followed by the
leads that were closed.
Use machine learning to
get actionable insights
for finding out potential
leads.
Consider an Example!
Analyze Data Insights
Suppose there is an organization that is working
towards finding out potential leads for their sales
team. They can follow the following approach to
get an optimal solution using Data Science:
Lets check relationship between AI
and Data Science
“In above example we saw machine
learning is required for insights”
AI and Data
Science
03
Data science and artificial intelligence are not
the same.
“Data science and artificial intelligence are two technologies
that are transforming the world. While artificial intelligence powers
data science operations, data science is not completely dependent on
AI. Data Science is leading the fourth industrial revolution. ”
Data science also requires machine learning algori
thms
, which results in dependency on AI.
Comparison Between AI and
Data Science
• Data science jobs require the knowledge of ML languages
like R and Python to perform various data operations and
computer science expertise.
• Data science uses more tools apart from AI. This is
because data science involves multiples steps to analyze
data and generate insights.
• Data science models are built for statistical insights
whereas AI is used to build models that mimic cognition
and human understanding.
Comparison Between AI and
Data Science
• Today’s industries require both, data science and
artificial intelligence. Data science will help them
make necessary data-driven decisions and assess
their performance in the market, while artificial
intelligence will help industries work with
smarter devices and software that will minimize
workload and optimize all the processes for
improves innovation.
Comparison Between AI and
Data Science
Prerequisites
for Data
Science
04
Computer
Science
Machine
Learning
Statistics
Data Science is a science which
uses :
Visualization
To collect ,clean, Integrate, analyze, visualize, interact with
data to create data products.
Human Computer Interaction
Roadmap of Data Science
Commonly used
languages are
python and R
Involves charts,graphs etc.
We have already two
libraries in Python for this i.e
Seaborn, matplotlib
Like mean, median ,
mode, standard
deviation etc.
Know about basic
algorithms of ML like Linear
regression, Logistic
regression, Decision tree,
SVM algorithm, KNN
algorithm , Random forest
algorithm.
1. Learn
Programming
Language
3. Data
Visualization
2. Mathematics &
Statistics
4. Machine
Learning
5. Project
Try to make projects with
the help of Kaggle
Python :
• Python is also most popular programming language among data scientists
these days.
• Python is very versatile and can be used in almost all the processes in Data
Science.
• Be it data mining or running embedded systems, python can do everything,
and because of this, 40% of the people that participated in a survey by
O’Reilly said that they used Python most often.
• Pandas, a python library, is used for data analysis and can do anything from
plotting data with histograms, to importing data from spreadsheets.
• Python can take data in various formats and import SQL tables to your code
easily.
• The python packages you need to master are Numpy, Matplotlib, PyTorch,
Pandas, Scikit-Learn, and Seaborn in Python.
R programming Language
• Following Python, the next skill in the list was R Programming, mentioned in 32% of the job
postings. R is a language specifically designed for Data Science.
• It can be used to solve any Data Science related problem that you might encounter.
• It is the most popular language among Data Scientists.
• Infact, 43% of data scientists prefer to use R for solving statistical problems.
• It is one of the most important Data Science Prerequisites. However, the learning curve is steep.
It is difficult to master, especially if you already have an expertise in any other programming
language.
• R can implement ML algorithms to give us a vast variety of statistical and graphical techniques
like time-series analysis, clustering, classical statistical tests etc.
• It is used for calculations and data manipulation. Tidyverse, Ggplot2, Stringr, Dplyr and Caret are
some of the things to master in R.
Mathematics and Statistics
Mathematics is one of the very popular Prerequisites for Data Science.
Probability and Statistics are used for data imputation, visualization of
features, feature transformation, model evaluation, dimensionality reduction,
feature engineering and data preprocessing.
Multivariable Calculus is used to build Machine Learning Models. For Model
Evaluation, Data Preprocessing and Data Transformation, we use linear
Algebra. A matrix is used to represent a Data set.
Mathematics and Statistics
There is no defined syllabus for what you need to learn in Mathematics and Statistics but
here are a few topics you should be familiar with –
• Mean, Median, Mode, Variance, Standard Deviation, and Percentiles
• Bayes Theorem And Probability Distribution (Normal, Poisson, and Binomial)
• Covariance Matrix and Correlation Coefficient
• Mean Square Error and R2 Score
• Statistical tests like p-value, hypothesis Testing, and chi-square
• Multivariate Functions, Cost Functions and Maxima and Minima of a Function
• Step Function, Sigmoid Function, Logit function and Rectified Linear Unit
• Vectors and Matrices; Transpose, Inverse, and Determinant of a matrix
• Dot Product, Cross Product, Eigenvalues, and Eigenvectors
Data Visualization
Data Visualization is a very important Prerequisite for Data Science. In
simple words, data visualization is a representation of data visually, through
graphs and charts. A data scientist should be able to represent data
graphically, using charts, graphs, maps, etc.
Data Visualization
There are multiple components in a good data visualization –
• Data Component – The first step in visualizing data is understanding the type of data, for example,
it could be continuous data, discrete data, or categorical data.
• Geometric Component – This means deciding what kind of visualization will best suit your data-
histograms, bar plots, heatmaps, scatter plots, pair plots, line graphs, etc.
• Mapping Component – In this component, you decide what variable you should use as the x-
variable (independent variable) and y-variable (dependent variable). This is especially important for
multi-dimensional datasets.
• Labels Component – This has the axes labels, legends, titles, font size, etc.
• Scale Component – Here you decide which scale you will be using- log scale, linear scale, etc.
• Ethical Component – This is to make sure that the visualization you have done, tells the true story,
and doesn’t mislead the audience.
Machine Learning and Artificial
Intelligence –
• ML helps in analyzing large amounts of data using algorithms. Using Machine Learning,
major parts of a data scientist’s jobs can be automated.
• Only a small percentage of Data Scientists are proficient with advanced machine learning
techniques like adversarial learning, neural networks, reinforcement learning, Outlier
Detection, Time Series etc.
• The most skilled data scientists are highly familiar with advanced machine learning
techniques such as recommendation engines and Natural Language Processing.
• If you want to stand out from the crowd and be one at the top tier, knowledge of machine
learning techniques such as logistic regression, supervised machine learning, decision
trees, Survival Analysis, Computer Vision, etc., is a must.
Start making small Data Science
projects with the help of Kaggle
Inside Kaggle you’ll find all the code
& data you need to do your data
science work.
Use over 50,000 public datasets and
400,000 public notebooks to
conquer any analysis in no time.
introductiontodatascience-230122140841-b90a0856 (1).pptx

introductiontodatascience-230122140841-b90a0856 (1).pptx

  • 1.
  • 2.
    0 1 Definitions andExamples 0 2 What exactly data science and data scientist do? 0 3 Relation between artificial ineliigence and data science 0 4 To become a data scientist one should know the various techniques. TABLE OF CONTENTS Data Science & Importance Data Science Process AI and Data Science Prerequisites for DS
  • 3.
    What is Data Science? Datascience is an interdisciplinary field that uses algorithms, procedures, and processes to examine large amounts of data in order to uncover hidden patterns, generate insights, and direct decision making.
  • 4.
  • 5.
    Career Opportunities "The riseof Data Science needs will create roughly 11.5 million job openings by 2026" US Bureau of Labour Statistics "By 2026, Data Scientists and Analysts will become the number one emerging role in the world." World Economic Forum Data Science and Artificial Intelligence are amongst the hottest fields of the 21st century that will impact all segments of daily life by 2025, from transport and logistics to healthcare and customer service.
  • 20.
    Examples: Oil giant Shell,for instance, used data science to anticipate machine failure at facilities across the world. Agricultural company Cargill developed a mobile data-tracking app that helps shrimp farmers reduce mortality rates. Dr. Pepper Snapple Group analyzed data with machine learning to glean more details about beverage sales and vendors. And freight company Pitt Ohio used historical data and predictive analytics to estimate delivery time with 99 percent accuracy.
  • 21.
    Facts on DataGeneration
  • 22.
    Facts on DataGenaration Statistics show that more than 500 terabytes of new data are entered into the databases of the social networking site Facebook every day. • A single Jet engine can generate over 10 terabytes of data in 30 minutes of flight time. With several thousand flights per day, data generation reaches several petabytes. • Stock Exchange is also an example of big data that generates about a terabyte of new trade data per day
  • 23.
  • 24.
    Collect Data Raw datais gathered from various sources that explain the business problem Using various statistical analysis, and machine learning approaches, data modeling is performed to get the optimum solutions that best explain the business problem. Actionable insights that will serve as a solution for the business problems gathered through data science. How does Data Science Work? Analyze Data Insights
  • 25.
    Collect Data Gather theprevious data on the sales that were closed. Use statistical analysis to find out the patterns that were followed by the leads that were closed. Use machine learning to get actionable insights for finding out potential leads. Consider an Example! Analyze Data Insights Suppose there is an organization that is working towards finding out potential leads for their sales team. They can follow the following approach to get an optimal solution using Data Science:
  • 26.
    Lets check relationshipbetween AI and Data Science “In above example we saw machine learning is required for insights”
  • 27.
  • 28.
    Data science andartificial intelligence are not the same. “Data science and artificial intelligence are two technologies that are transforming the world. While artificial intelligence powers data science operations, data science is not completely dependent on AI. Data Science is leading the fourth industrial revolution. ”
  • 29.
    Data science alsorequires machine learning algori thms , which results in dependency on AI.
  • 30.
    Comparison Between AIand Data Science • Data science jobs require the knowledge of ML languages like R and Python to perform various data operations and computer science expertise. • Data science uses more tools apart from AI. This is because data science involves multiples steps to analyze data and generate insights. • Data science models are built for statistical insights whereas AI is used to build models that mimic cognition and human understanding.
  • 31.
    Comparison Between AIand Data Science • Today’s industries require both, data science and artificial intelligence. Data science will help them make necessary data-driven decisions and assess their performance in the market, while artificial intelligence will help industries work with smarter devices and software that will minimize workload and optimize all the processes for improves innovation.
  • 32.
    Comparison Between AIand Data Science
  • 33.
  • 34.
    Computer Science Machine Learning Statistics Data Science isa science which uses : Visualization To collect ,clean, Integrate, analyze, visualize, interact with data to create data products. Human Computer Interaction
  • 35.
    Roadmap of DataScience Commonly used languages are python and R Involves charts,graphs etc. We have already two libraries in Python for this i.e Seaborn, matplotlib Like mean, median , mode, standard deviation etc. Know about basic algorithms of ML like Linear regression, Logistic regression, Decision tree, SVM algorithm, KNN algorithm , Random forest algorithm. 1. Learn Programming Language 3. Data Visualization 2. Mathematics & Statistics 4. Machine Learning 5. Project Try to make projects with the help of Kaggle
  • 36.
    Python : • Pythonis also most popular programming language among data scientists these days. • Python is very versatile and can be used in almost all the processes in Data Science. • Be it data mining or running embedded systems, python can do everything, and because of this, 40% of the people that participated in a survey by O’Reilly said that they used Python most often. • Pandas, a python library, is used for data analysis and can do anything from plotting data with histograms, to importing data from spreadsheets. • Python can take data in various formats and import SQL tables to your code easily. • The python packages you need to master are Numpy, Matplotlib, PyTorch, Pandas, Scikit-Learn, and Seaborn in Python.
  • 37.
    R programming Language •Following Python, the next skill in the list was R Programming, mentioned in 32% of the job postings. R is a language specifically designed for Data Science. • It can be used to solve any Data Science related problem that you might encounter. • It is the most popular language among Data Scientists. • Infact, 43% of data scientists prefer to use R for solving statistical problems. • It is one of the most important Data Science Prerequisites. However, the learning curve is steep. It is difficult to master, especially if you already have an expertise in any other programming language. • R can implement ML algorithms to give us a vast variety of statistical and graphical techniques like time-series analysis, clustering, classical statistical tests etc. • It is used for calculations and data manipulation. Tidyverse, Ggplot2, Stringr, Dplyr and Caret are some of the things to master in R.
  • 38.
    Mathematics and Statistics Mathematicsis one of the very popular Prerequisites for Data Science. Probability and Statistics are used for data imputation, visualization of features, feature transformation, model evaluation, dimensionality reduction, feature engineering and data preprocessing. Multivariable Calculus is used to build Machine Learning Models. For Model Evaluation, Data Preprocessing and Data Transformation, we use linear Algebra. A matrix is used to represent a Data set.
  • 39.
    Mathematics and Statistics Thereis no defined syllabus for what you need to learn in Mathematics and Statistics but here are a few topics you should be familiar with – • Mean, Median, Mode, Variance, Standard Deviation, and Percentiles • Bayes Theorem And Probability Distribution (Normal, Poisson, and Binomial) • Covariance Matrix and Correlation Coefficient • Mean Square Error and R2 Score • Statistical tests like p-value, hypothesis Testing, and chi-square • Multivariate Functions, Cost Functions and Maxima and Minima of a Function • Step Function, Sigmoid Function, Logit function and Rectified Linear Unit • Vectors and Matrices; Transpose, Inverse, and Determinant of a matrix • Dot Product, Cross Product, Eigenvalues, and Eigenvectors
  • 40.
    Data Visualization Data Visualizationis a very important Prerequisite for Data Science. In simple words, data visualization is a representation of data visually, through graphs and charts. A data scientist should be able to represent data graphically, using charts, graphs, maps, etc.
  • 41.
    Data Visualization There aremultiple components in a good data visualization – • Data Component – The first step in visualizing data is understanding the type of data, for example, it could be continuous data, discrete data, or categorical data. • Geometric Component – This means deciding what kind of visualization will best suit your data- histograms, bar plots, heatmaps, scatter plots, pair plots, line graphs, etc. • Mapping Component – In this component, you decide what variable you should use as the x- variable (independent variable) and y-variable (dependent variable). This is especially important for multi-dimensional datasets. • Labels Component – This has the axes labels, legends, titles, font size, etc. • Scale Component – Here you decide which scale you will be using- log scale, linear scale, etc. • Ethical Component – This is to make sure that the visualization you have done, tells the true story, and doesn’t mislead the audience.
  • 42.
    Machine Learning andArtificial Intelligence – • ML helps in analyzing large amounts of data using algorithms. Using Machine Learning, major parts of a data scientist’s jobs can be automated. • Only a small percentage of Data Scientists are proficient with advanced machine learning techniques like adversarial learning, neural networks, reinforcement learning, Outlier Detection, Time Series etc. • The most skilled data scientists are highly familiar with advanced machine learning techniques such as recommendation engines and Natural Language Processing. • If you want to stand out from the crowd and be one at the top tier, knowledge of machine learning techniques such as logistic regression, supervised machine learning, decision trees, Survival Analysis, Computer Vision, etc., is a must.
  • 43.
    Start making smallData Science projects with the help of Kaggle Inside Kaggle you’ll find all the code & data you need to do your data science work. Use over 50,000 public datasets and 400,000 public notebooks to conquer any analysis in no time.