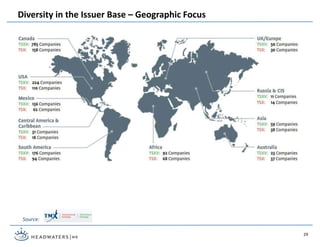
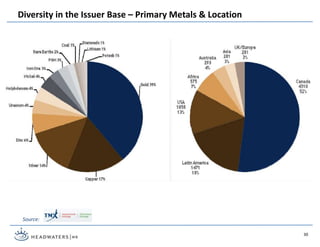
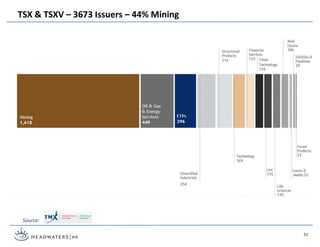
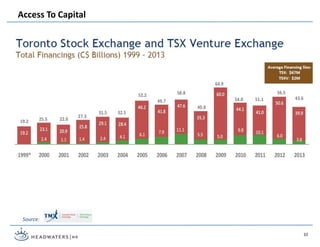
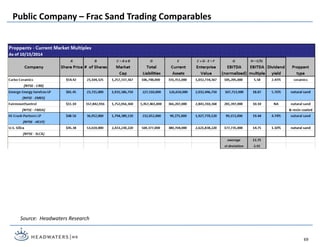
Introduction To The Global Mining Industry
Rocky Mountain Mineral Law Foundation – Mining Law Short Course
Westminster, Colorado
Joel Schneyer – Managing Director
November 3, 2014
Adrian Kingshott
203.489.3682
Ted Kinsman
303.572.6013
Len LaPorta
203.451.7799
Reed Macy
713.876.8030
Jack Maier
202.957.5155
Daniel McBroom
303.951.7128
Ray McCormick
724.933.6600
Gary Moon
650.515.8734
Peter Nam
949.706.8440
John O’Neill
214.870.5040
Tess Oxenstierna
203.524.0888
John Patterson
908.403.2135
Jeff Ackerman
617.275.4401
David Baker
312.466.7677
Bob Balaban
303.792.9400
John Batdorf
415.847.8805
David Brinkley
917.817.0375
Brendan Burke
303.531.4603
Ricardo Campoy
646.382.4000
Vince Cannaliato
917.533.4152
Tyler Comann
415.272.2463
Ian Cookson
617.470.9338
Rick deNey
203.972.9100
Mike Ewing
973.713.1463
National Footprint, Global Reach: Over 25% of Revenue Cross-Border
United States
International
 26 countries
 50 offices
 300 professionals
North America
 7 offices
 64 professionals
 Award winning partners in the UK, France,
Germany, Netherlands and India
 Long history of success in Spain, Russia,
Japan, Brazil, South Africa and Italy
 Over 80 languages spoken
2
Horacio Facca
617.312.3420
David Francione
617.419.2040
Grant Garbers
949.706.8444
Gregory Gerard
303.572.6016
Darin Good
303.549.5674
Bill Harrison
917.596.5533
Sam Hill
214.457.4832
CJ Hummel
303.217.5743
Paul Janson
303.572.6012
Rick Jeffrey
917.538.2446
Roger Kahn
917.597.2245
Samrat Karnik
917.733.6022
Russia
David Wolfe
12.495.721.1370
Mark Bond
12.495.721.1370
Spain
Maarten De Jongh
34.933.426.227
Igor Gorostiaga
34.944.352.311
India
Karan Gupta
230.213.6514
Mahesh Singhi
91.22.6634.6666
Japan
Owen Hultman
81.3.6895.5521
Masahito Tachikawa
81.3.6895.5521
Mexico
Fausto Garcia
52.55.5203.4430
Javier Arce Fernandez
52.55.5208.4430
Poland
Michael Harvey
48.22.236.9227
Piotr Olejniczak
48.22.236.9227
South Africa
Pieter Veldtman
27.82.566.6352
Pieter Venter
27.82.566.6352
Canada
Don Lioutas
416.496.3075
Eric Klein
416.496.3742
South America
Leonardo Antunes
55.21.3873.8000
Felipe Monaco
55.11.4114.2047
United Kingdom
Mark Humphries
44.20.7881.2990
Mark Wilson
44.121.654.5000
Benelux
Jan Willem Jonkman
31.73.623.8774
Ron Belt
31.73.623.8774
France
Michel Degryck
33.148.246.300
Jean-Pierre Brice
33.148.246.300
Germany
Michael Fabich
49.611.205.4825
Ervin Schellenberg
49.611.205.48.10
Italy
Nuccia Cavalieri
39.02.92.88.04.00
Stefano Pastore
39.02.92.88.04.00
Thailand
Chayot Vitayanonektavee
66.2664.9100
Jim Vorapon Ponvanit
66.2664.9100
Turkey
Omer Unsal
0212.215.52.40
Brian Pietravalle
202.595.4739
Rod Rivera
917.969.4270
Carlos Rodriguez
858.752.4350
Joel Schneyer
303.619.4211
Brad Schreiber
949.706.8440
Phil Seefried
303.572.6004
Kevin Slocum
203.331.5955
Jerry Sturgill
208.287.8903
Mike Swartz
303.531.5009
Doug Usifer
908.432.7792
Bill Young
203.622.1044
Sun Jen Yung
917.297.8716
1) Prices - Cyclical
2) Demand – BRIC countries are the drivers
3) Raw Material Supply
4) Political Risk in the Mining Sector – Fraser Institute
5) Raising Capital – TSX and TSXV
6) Development Stage Gold Companies Value Proposition Timeline
7) Frac Sand Industry Overview
8) Closing Thoughts
Presentation Outline
3
1) Prices - Cyclical
2) Demand – BRIC countries are the drivers
3) Raw Material Supply
4) Political Risk in the Mining Sector – Fraser Institute
5) Raising Capital – TSX and TSXV
6) Development Stage Gold Companies Value Proposition Timeline
7) Frac Sand Industry Overview
8) Closing Thoughts
Presentation Outline
4
0.000
0.500
1.000
1.500
2.000
2.500
3.000
3.500
19711972197319741975197619771978197919801981198219831984198519861987198819891990199119921993199419951996199719981999200020012002200320042005200620072008
Al,Cu&NiPrice(US$/lb)
0.000
2.000
4.000
6.000
8.000
10.000
12.000
14.000
16.000
18.000
NiPrice(US$/lb)
copper aluminum nickel
- 4 - 6
- 4 - 7+ 3
+
2
+ 5
+
2
Average Up Cycle is 3 Years – Average Down Cycle is 5 Years
5
Source: Headwaters Research
Copper Stocks and Copper Prices – Inverse Relationship
Source: International Copper Study Group – 2013 Factbook
6
Cumulative Production0% 40% 60%20% 100%80%
Supply
demand
d1
d2
d3
lower taxes
more gov’t spending
lower interest rates
loose money supply
higher taxes
less gov’t spending
higher interest rates
tight money supply
substitution
Macroeconomics – Supply & Demand
7
Source: Headwaters Research
World Copper Use Per Capita
Source: International Copper Study Group – 2013 Factbook
8
Intensity Of Use For Copper – 7 Largest Economies In 2012
Source: ICSG and IMF estimates
9
1) Prices - cyclical
2) Demand – BRIC countries are the drivers
3) Raw Material Supply
4) Political Risk in the Mining Sector – Fraser Institute
5) Raising Capital – TSX and TSXV
6) Development Stage Gold Companies Value Proposition Timeline
7) Frac Sand Industry Overview
8) Closing Thoughts
Presentation Outline
10
Population in Millions
2014 Population Estimate = 7.2 Billion People
Source: Internet World Stats – Miniwatts Marketing Group – estimated world population 7.18 billion
11
Time to Successive Billions in World Population 1800 -2050
Source: US Census Bureau
12
Population in Millions
2050 Population Forecast = 9.1 Billion People
Source: Internet World Stats – Miniwatts Marketing Group – US Census Bureau
BRIC Countries of Brazil, Russia, India, China = 38%
13
GDP % Annual Growth Rates
Source: The World Bank
14
China Crude Steel Apparent Consumption
Source: The Globe and Mail, Mysteel
15
German Exports
Source: The Globe and Mail, Bloomberg
16
1) Prices - cyclical
2) Demand – BRIC countries are the drivers
3) Raw Material Supply
4) Political Risk in the Mining Sector – Fraser Institute
5) Raising Capital – TSX and TSXV
6) Development Stage Gold Companies Value Proposition Timeline
7) Frac Sand Industry Overview
8) Closing Thoughts
Presentation Outline
17
Global Sources Supply – Number of Suppliers
18
Global Sources of Supply – Limited Number of Suppliers
19
Global Sources of Chromite – Potential Supply Issues
 Global Reserve Base is
sufficient to meet
conceivable demand for
centuries
 No substitute for chromium
in stainless steel production
 South Africa mining industry
not meeting its risk adjusted
returns on capital
 Kazakhstan unreliable
supplier
20
1) Prices - cyclical
2) Demand – BRIC countries are the drivers
3) Raw Material Supply
4) Political Risk in the Mining Sector – Fraser Institute
5) Raising Capital – TSX and TSXV
6) Development Stage Gold Companies Value Proposition Timeline
7) Frac Sand Industry Overview
8) Closing Thoughts
Presentation Outline
21
Difficult Investment Landscape for Miners
Source: Novagold - Presentation San Francisco Gold Conference November 2013
Mexico: New 8% tax
on gold profits
South America
1. Peru: Construction halted at largest mine due to
gov’t review and social unrest.
2. Ecuador: Political obstacles and windfall tax
discourage foreign investment in mining.
3. Venezuela: Five mining companies seeking
compensation through World Bank’s arbitration
court following nationalizations.
4. Bolivia: Nationalization of various natural
resources assets.
5. Argentina: Miners required to repatriate
revenues from foreign sales, limitations imposed
on foreign exchange. Controls on imports of
equipment/supplies have also been tightened
Africa
6. Ghana: Increase in tariffs on mines and introduced
a windfall tax, halting project expansions.
7. Guinea: New law gives government a 35% stake;
threat of nationalization.
8. Mali: Recent military coup creating political
uncertainty
9. Kenya: Rising mineral royalties and drilling fees for
mining.
10. Congo: Plans to revise mining code, raise taxes and
increase stake in mining projects
11. Zimbabwe: Gov’t plans to seize control of foreign-
owned mines.
12. South Africa: Ongoing dialogue to nationalize
mining industry.
Russia, Asia & Australia
13.Indonesia: Newly proposed legislation
limits foreign ownership of mines to 49%.
14.Philippines: New royalties and taxes being
imposed on mining companies.
15.Mongolia: Drafting investment law to
restrict foreign ownership.
16.Kyrgyzstan: Parliamentary motion calling
for increased government stake in one of its
largest mines
Heightened Geopolitical/Permitting Risk in North America
22
BC: Mt Polly tailings
dam spill
Alaska: EPA’s “stoppage” of Pebble
Mine under sec 404C of clean water act
Quebec: Amendments
To Mining Act
BC: Canada
Supreme Court
Tsilhqot’in
First Nation
Ruling
 Providing valuable information to the mining industry and policy makers since
1997 on political risk by examining 13 policy areas such as taxation, regulation,
land claims, etc.
 Sent to 4,100 executives at exploration, development, and mining consulting
companies. Asked to respond only for jurisdictions which they know
 Responses from 690 executives, representing $3.4 billion in exploration
spending in 2013
 A composite index of the policy areas
 0 is worst policy; 100 is best
www.fraserinstitute.org
Fraser Institute 2013 Mining Survey
23
1) UNCERTAINTY REGARDING THE ADMINISTRATION, INTERPRETATION, OR ENFORCEMENT OF EXISTING REGULATIONS
2) UNCERTAINTY CONCERNING ENVIRONMENTAL REGULATIONS
3) REGULATORY DUPLICATION AND INCONSISTENCIES (includes federal/provincial, federal/state, inter-departmental
overlap, etc.)
4) TAXATION REGIME (includes personal, corporate, payroll, capital, and other taxes, and complexity of tax
compliance)
5) UNCERTAINTY CONCERNING NATIVE / ABORIGINAL LAND CLAIMS
6) UNCERTAINTY CONCERNING WHAT AREAS WILL BE PROTECTED AS WILDERNESS OR PARKS
7) INFRASTRUCTURE (includes access to roads, power availability, etc.)
8) SOCIOECONOMIC AGREEMENTS / COMMUNITY DEVELOPMENT CONDITIONS (includes local purchasing, processing
requirements or supplying social infrastructure such as schools or hospitals, etc.)
9) POLITICAL STABILITY
10) LABOUR REGULATIONS / EMPLOYMENT AGREEMENTS
11) QUALITY OF THE GEOLOGICAL DATABASE (includes quality and scale of maps, ease of access to information, etc.)
12) SECURITY (includes physical security due to the threat of attack by terrorists, criminals, guerrilla groups, etc.)
13) AVAILABILITY OF LABOUR / SKILLS
The Fraser Institute – Policy Survey
24
Source: Fraser Institute – 2013 Mining Survey
2013 Fraser Results - Policy Perception Index
Top 10
Sweden (best)
Finland
Alberta
Ireland
Wyoming
Western Australia
New Brunswick
Nevada
Newfoundland/Labrador
Norway
Bottom 10
Madagascar
Indonesia
Ivory Coast
Zimbabwe
Argentina – Mendoza
Angola
Argentina – La Rioja
Philippines
Venezuela
Kyrgyzstan (worst)
25
E&Y Top Business Risks in Mining Sector
26
Source: E & Y, Business Risks Facing Mining & Metals 2014 - 2015
1) Metal Prices - cyclical
2) Demand – BRIC countries are the drivers
3) Raw Material Supply
4) Political Risk in the Mining Sector – Fraser Institute
5) Raising Capital – TSX and TSXV
6) Development Stage Gold Companies Value Proposition Timeline
7) Frac Sand Industry Overview
8) Closing Thoughts
Presentation Outline
27
2013 Mining Markets At A Glance
Source:
28
Diversity in the Issuer Base – Geographic Focus
Source:
29
Diversity in the Issuer Base – Primary Metals & Location
Source:
30
TSX & TSXV – 3673 Issuers – 44% Mining
Source:
31
Access To Capital
Source:
32
Number of Mining Companies by the Stage of Project Development
Source:
33
Disconnect Between Gold Miner Indexes and Broader Market
34
Source: Headwaters Research
1) Metal Prices - cyclical
2) Demand – BRIC countries are the drivers
3) Raw Material Supply
4) Political Risk in the Mining Sector – Fraser Institute
5) Raising Capital – TSX and TSXV
6) Development Stage Gold Companies Value Proposition Timeline
7) Frac Sand Industry Overview
8) Closing Thoughts
Presentation Outline
35
Source: MinEx Consulting, Mining Journal Gold Supplement, August 2014
Gold Discovery Cost
36
0
200
400
600
800
1,000
1,200
2010 2011 2012 2013
Total Cash Total Production All-In Sustaining
$739$713$624
Source: Metals Focus
$548
$1,066 $1,045
$/oz
Mining Cost Inflation
37
Source: Metals Focus
$/oz
-200
0
200
400
600
800
1,000
1,200
1,400
1,600
1,800
2,000
2,200
2,400
-200
0
200
400
600
800
1,000
1,200
1,400
1,600
1,800
2,000
2,200
2,400
0 25 50 75 100
Cumulative Gold Production (%)
Total Cash Cost H1 14 Av. H1 14 Gold Price
Total Cash Cost H1 13 Av. H1 13 Gold Price
Industry Cash Cost Curve H1 2014
38
Source: Metals Focus
-200
0
200
400
600
800
1,000
1,200
1,400
1,600
1,800
2,000
2,200
2,400
-200
0
200
400
600
800
1,000
1,200
1,400
1,600
1,800
2,000
2,200
2,400
0 25 50 75 100
Cumulative Gold Production (%)
All-In Sustaining Cost H1 14 Av. H1 14 Gold Price
All-In Sustaining Cost H1 13 Av. H1 13 Gold Price
Industry All-In Sustainable Cost H1 14
39
0
200
400
600
800
1,000
1,200
1,400
1,600
1,800
Q1 13 Q2 13 Q3 13 Q4 13 Q1 14 Q2 14
Total Cash Cost All-In Sustaining Cost Gold Price
$301/oz
$292/oz$312/oz $338/oz $321/oz
Source: Metals Focus
$/oz
$535/oz
Margins Under Pressure
40
SNL Pipeline Activity Index
Source: SNL Metals & Mining 2014
41
SNL Significant Gold Drill Results Announced
Source: SNL Metals & Mining 2014
42
43
The Institutional Money has lost confidence …
˗ that costs can be controlled
˗ that capital discipline will occur
˗ that restructurings can deliver on promises
˗ that returns on capital employed will improve
˗ that the industry won’t pile back into too many new projects or expensive deals when
prices rebound
˗ that resource nationalism will not overwhelm the industry
˗ that commodity prices will not collapse
˗ that “stuckholders” have an exit
… and the markets reflect this loss of confidence
Institutional Money Is Not Buying Gold Exploration Lottery Tickets
Why Buy An Illiquid Share When You Can Buy An ETF?
44
Source: Yahoo Finance
 No control – generally passive
 Upfront payment for metal –
generally passive, much more
important financing source
today
 Rise of PE as active investors and
generally absolute control
 May have board representation,
early toehold in projects
 The rise of state backed
investments (e.g. China and
Korea)
45
Company
Project
Retail
Sovereign Wealth
InstitutionalMoney
Private Equity
Streaming & Royalty
Strategics
Merchant Traders
Mutual Funds
Major Shift In How Institutional Money Invests In Sector
46
Development Stage Gold Companies trade at an Enterprise Value of $16 per ounce of M, I, & I
(NI 43-101) with average estimated project development costs of $91 per ounce
*EV = (share price x # shares) – current assets + total liabilities
**9/29/2014 share prices at close Au=$1219.50/oz, Ag=$17.58/oz
However The Development Stage Business Model Looks To Be Unsustainable
47
Once the Project enters the Development Investment Analysis Phase (PEA – Prefeasibility – Feasibility),
companies see a long period of share price erosion as studies, permitting and de-risking drag on.
Life Cycle of a Gold Mining Share – Dec 2013 119th Annual Meeting
De-risking
&
48
Once the Project enters the Development Investment Analysis Phase (PEA – Prefeasibility – Feasibility),
companies see a long period of share price erosion as studies, permitting and de-risking drag on.
Life Cycle of a Gold Mining Share – Dec 2014 120th Annual Meeting
Donlin Gold Project – Advancing Toward a Production Decision
Source: NovaGold 2nd Q & Project Update Presentation, July 2014
49
50
Development Stage Gold Companies Trade on Average at $16/oz Resource
Costs to Complete Drilling, Feasibility & Permitting ~$10/oz Resource
Capital Development Costs $91/oz Resource
Owners Costs Not in Feasibility (25%) $23/oz Resource
Total $140/oz Resource
Actual Trading Market Multiples
• Small Gold Producers $71/oz Resource
• Intermediate Gold Producers $70/oz Resource
• Large Gold Producers $129/oz Resource
• Silver Producers $128/oz Resource
So What Is the Problem?
Focus On Sustainable Development And What You Can Control
 Mining investors are increasingly focused on investment returns.
Focus less on project IRR’s and more on Project rank on cost curve
Attractive Returns
& Economic
51
Staged Development
Low Political Risk
Available Workforce
 To minimize capital risk, design around an initial high grade starter pit with
scaled expansion & investigate the lower cap intensity heap leach option
 Conventional process circuit. Will take project thru “detailed engineering”
before seeking project finance
 Favorable jurisdiction with long established mining laws
 Host jurisdiction has available trained and or trainable work force, only
need modest number of expatriate supervisors
Permitting &
Social Issues
 Have local stakeholders (partners) with financial stake that are on
record supporting project and EIS process
Completion &
Overrun Risk
1) Metal Prices - cyclical
2) Demand – BRIC countries are the drivers
3) Raw Material Supply
4) Political Risk in the Mining Sector – Fraser Institute
5) Raising Capital – TSX and TSXV
6) Development Stage Gold Companies Value Proposition Timeline
7) Frac Sand Industry Overview
8) Closing Thoughts
Presentation Outline
52
Industry Observations – The Unconventional Shale Plays
53
Industry Observations – Sand Market Overview
54
Major Dynamics
Demand
Supply
Competition
Pricing
 Demand is increasing faster than supply
 Logistics capabilities are no longer a competitive advantage but still a
necessity
 There is rapidly growing need for high quality frac sand - more wells
per section, more stages per well, more sand per stage
 Exponential decline of unconventional shale plays requires continued
drilling to keep production levels up
 Permitting is becoming harder (NIMBY)
 Economic and mineable deposits of Northern White sand hard to find
 Not much of an issue in an “expanding” market
 The consolidation in the industry is just beginning
 Long-term contract pricing of $50 to 65 per ton (20/70) FOB Mine
 Prices for 100 mesh have found strength
Industry Observations – Secular Demand Drivers for Proppant
55
Proppant demand is expected to increase over the next several years
 Proppant growth has outpaced rig count due to high service intensity and
increased horizontal drilling
 Pressure pumpers are increasing, facing efficiencies and completing jobs
faster
 Down spacing creates more locations to drill
 Use of cemented liners versus sliding sleeves increases sand usage
 Overall increase in frac sizes per stage
 Increased number of frac stages per well
Proppant Market Differentiation
56
Source: Emerge Energy Services, Investor Presentation, April 2014
The quality of proppants produced from St Peter Sandstone often is a function of
the process flowsheet utilized and careful attention to cleaning, not differences in
the raw sand quality
Economics of the Unconventional Plays
57
Source: Benteck Energy, 2nd Annual Frac Sand Conference, Minneapolis 2014
Oil and NGL Plays Earning the Highest Returns
58
Source: Benteck Energy, 2nd Annual Frac Sand Conference, Minneapolis 2014
Frac Sand Demand – Regional Sand Consumption (billion lbs)
59
Source: PacWest Consulting, Frac Sand Logistics Conference – San Antonio, August 2014
Industry Observations – Proppant Demand Expected to Remain Strong
60
1.8
7.0
29.6
51.2
78.5
$40
$48
$58
$68
$80
$25
$35
$45
$55
$65
$75
$85
0
20
40
60
80
100
2002 2007 2012 2017 2022
Raw Frac Sand Resin-Coated Sand, Ceramics, Other Raw Frac Sand Price (S/ton)
(Millions
of Tons)
(S/Ton)
Historical and Projected Industry Proppant Demand
Source: Hi-Crush Partners Company Presentation, Freedonia Group
Frac Sand Shipping Flows
61
Source: PLG Consulting, 2nd Annual Frac Sand Conference, Minneapolis 2014
Regulatory Authority and Control Nonmetallic Mining in Wisconsin
62
Source: GZA Environmental, 2nd Annual Frac Sand Conference, Minneapolis 2014
Frac Sand Handled By Railroads
63
Source: PLG Consulting, 2nd Annual Frac Sand Conference, Minneapolis 2014
Rail Operating Metrics
64
Source: Freight Car America Inc, 2nd Annual Frac Sand Conference, Minneapolis 2014
Frac Sand Delivered Cost to Wellsite
65
Source: Raymond James, Global Research Report, August 2014
The Miner = $60/t Revenue - $35/t OC = $25/t EBITDA
- Operates 15 locations across the USA, owns 297 tons of sand reserves including
138 million tons which can processed to produce API spec frac sand. In 2013,
sold 8.16 million tons of sand at average price of $66.90/ton. Portfolio
company of Golden Gate Capital, IPO in 2012; Golden Gate sold out its position
in 2013.
- Was formed by private equity firm Insight Equity in 2012. In May 2013, Emerge
Energy Services was combined with Superior Silica Sands (“SSS”), Allied Energy
Company (“AEC”), and Direct Fuels (“DF”) in a series of transactions that
culminated with the initial public offering of Emerge as LP. In 2013, sold 2.65
million tons of sand at average price of $63.28/ton. Still controlled by Insight
Equity.
- Was formed by private equity firm Avista Capital Partners in 2010. In August
2012, initial public offering of Hi-Crush as LP. In 2013, sold 1.85 million tons of
sand at average price of $82.74/ton. Still controlled by Avista Capital Partners.
Competitive Landscape
66
- Employs over 1,000 people, sold more than 6.0 million tons of sand and value-
added sand products in 2011. Portfolio company of American Securities Capital
Partners. There are rumors that an IPO is forthcoming.
- One of the leading providers of high-quality proppant and related logistics
services to the oil and gas industry in North America. All of Smart Sand’s
facilities are located near major rail transport lines, ensuring reliable, cost-
effective delivery to major shale plays in the U.S. and Canada. Portfolio
company of Clearlake Capital.
- Headquartered in Houston Texas, Cadre Services is a major supplier of API/ISO-
quality Premium Hickory® Sand, with principal operations located in Voca,
Texas. Portfolio company of Denham Capital Management. July 16, 2014
announcement that U.S. Silica Holdings, Inc. to purchase Cadre Services Inc. for
$98 million. Adjusted LTM EBITDA of $11.1 million represents purchase price of
7.6x EBITDA.
- Strategically located in New Auburn, WI and Garland City, AR to meet the
demands of all major shale plays. Wisconsin plant originates on the Union
Pacific railway and has access to Canadian National (CN) and Burlington
Northern Santa Fe (BNSF) railways. Portfolio company of Energy Capital
Partners.
Competitive Landscape
67
Median EBITDA Multiple for Trading Comps:
6.0x (Energy) – 6.8x (Materials) – 7.6x (Cadre)
Conclusion
68
July 16, 2014 announcement that U.S. Silica Holdings, Inc. to purchase Cadre Services Inc. for $98 million.
Adjusted LTM EBITDA of $11.1 million represents purchase price of 7.6x EBITDA
Median Enterprise Value / EBITDA
Target's Sector
Less Than
$500M
Greater
Than $500M
Less Than
$500M
Greater
Than $500M
Less Than
$500M
Greater
Than $500M
Less Than
$500M
Greater
Than $500M
Less Than
$500M
Greater
Than $500M
Consumer Discretionary 11.3x 10.5x 12.7x 8.5x 10.8x 8.5x 9.5x 9.1x 12.8x 9.7x
Consumer Staples 12.7x 9.7x 7.2x 8.2x 9.5x 8.7x 8.7x 12.7x 9.8x 9.7x
Energy 8.4x 9.9x 10.5x 14.9x 7.2x 9.2x 5.4x 13.1x 6.0x 5.5x
Financials 12.7x 10.9x 12.7x 14.4x 11.0x 17.6x 10.3x 15.3x 12.2x 19.4x
Healthcare 10.8x 10.1x 11.9x 12.7x 12.2x 12.1x 10.2x 11.3x 8.1x 14.8x
Industrials 5.7x 9.3x 7.0x 8.8x 8.3x 11.2x 7.2x 9.7x 8.7x 10.3x
Information Technology 8.1x 13.7x 12.6x 14.9x 9.5x 15.7x 12.0x 11.2x 12.6x 18.5x
Materials 9.3x 11.9x 7.2x 10.9x 9.8x 9.7x 7.8x 8.2x 6.8x 11.4x
Telecommunication Services 5.8x 7.3x 5.9x 7.4x 11.5x 8.7x 7.6x 8.4x 11.3x 11.2x
Utilities 9.5x 11.0x 10.3x 11.3x 9.8x 10.7x 14.0x 8.7x 14.0x 9.9x
2010 2011 2012 2013 2014
Last Twelve Months Ending June 30th of:
Recent Transactions
Public Company – Frac Sand Trading Comparables
69
Source: Headwaters Research
1) Metal Prices - cyclical
2) Demand – BRIC countries are the drivers
3) Raw Material Supply
4) Political Risk in the Mining Sector – Fraser Institute
5) Raising Capital – TSX and TSXV
6) Development Stage Gold Companies Value Proposition Timeline
7) Frac Sand Industry Overview
8) Closing Thoughts
Presentation Outline
70
 Exploration is extremely risky with success rates akin to Pharma R&D developing a drug
that can proceeds thru medical trials, expect a large percentage of exploration
companies to be forced out of business
 Recognition that the replacement cost of “risked reserves” are often lower than current
market capitalizations, there will be continued consolidation in the resource sector
especially as a way to “bank” value
 Burgeoning debt of OECD countries (and US municipalities) causes new wave of
“resource taxes”
 Without social license to operate, a positive permitting outcome is problematic
 Any carbon capture initiatives will have a “taxing” effect on the global economy, reduce
demand and GDP
Observations
71
Global Warming – Anthropogenic Carbon Production
Source: Dr. Timothy Gutowski, Department of Engineering at M.I.T., Keynote Address 40th CIRP International
Manufacturing Systems Seminar at Liverpool University, 30 May to June 1 2007
These four components respectively are: 1) population, 2) affluence 3) energy intensity
4) carbon intensity
“Results in reducing emissions to slow global warming reveal that while we are
improving in both of the technology terms (energy intensity & carbon intensity), these
are offset by the growth terms i.e. population and affluence”
72
 OECD economies will continue to grow at slow rates, drag of carbon capture initiatives,
debt load, aging populations and higher taxes
 BRIC countries will extend infrastructure into hinterlands to boost domestic economies,
reduce dependency on exports, and reduce tension between the coastal haves and the
inland have nots
 China will continue to convert US paper assets into ownership of “hard assets” around
the world, to have title to the means of production and security of supply with regard
to raw materials inputs
 For the “mining developers”, Private Equity and its “managed money approach” has
replaced the public stock markets as the go to source of capital in the mining sector
 The Unconventional Shale Revolution has had (and will have) an enormous global
impact and is driving the US economic growth engine
Predictions
73
Real Estate Asset
Bubble Collapse
US Housing Starts & Cement Consumption “Turned” 2 Years Before Dow
74
 SEDAR – official site that provides access to most public securities documents and information filed by
public companies and investment funds with the Canadian Securities Administrators (CSA) in the SEDAR
filing system. www.sedar.com
 Kitco – latest metal news, commentaries, latest company news releases, technical and fundamental
analysis, top performing equities, exchange rates, metal prices and charts. www.kitco.com
 The Northern Miner – global mining newspaper published out of Toronto, print and web editions,
subscription service. www.northernminer.com
 The Fraser Institute – registered non-profit with offices in Canada and the United States with active
research ties with similar independent organizations in more than 70 countries around the world.
Measures and studies the impacts of markets and government interventions on the welfare of
individuals. Produces annual mining policy survey. www.fraserinstitute.org
 USGS Mineral Information – mineral summaries by commodity, country, and state. Excellent source of
long term data series on production, consumption, and pricing.
http://minerals.usgs.gov/minerals/index.html
 Institute of Corporate Directors – pre-eminent organization for directors and recognized as the leading
authority of standards of good governance. Supports director education though ICD education
programs. www.icd.ca
Resources
75
The Headwaters Difference
DEAL OF THE YEAR - TMT
INVESTMENT BANK
OF THE YEAR
INTERNATIONAL DEAL OF THE YEAR
PROFESSIONAL (B2B) SERVICES
INTERNATIONAL DEAL OF THE YEAR
CONSUMER SERVICES
INTERNATIONAL INVESTMENT
BANK OF THE YEAR
76
 Advocacy – unapologetic and conflict free
 Award-winning client advice
 Deep pool of transaction experience (over $265 billion)
 National footprint (7 offices)
 Global reach (25 countries, 50 offices)
 Focused industry coverage (specialists, not generalists)
 Full product/service offering
 #1 investment bank for private wealth in the US
 Proprietary capital: we can invest; unique access to family office capital
 Long history of success
 Teamwork unrivalled in the industry
Capabilities • Culture • Results

Introduction To The Global Mining Industry

  • 1.
    Introduction To TheGlobal Mining Industry Rocky Mountain Mineral Law Foundation – Mining Law Short Course Westminster, Colorado Joel Schneyer – Managing Director November 3, 2014
  • 2.
    Adrian Kingshott 203.489.3682 Ted Kinsman 303.572.6013 LenLaPorta 203.451.7799 Reed Macy 713.876.8030 Jack Maier 202.957.5155 Daniel McBroom 303.951.7128 Ray McCormick 724.933.6600 Gary Moon 650.515.8734 Peter Nam 949.706.8440 John O’Neill 214.870.5040 Tess Oxenstierna 203.524.0888 John Patterson 908.403.2135 Jeff Ackerman 617.275.4401 David Baker 312.466.7677 Bob Balaban 303.792.9400 John Batdorf 415.847.8805 David Brinkley 917.817.0375 Brendan Burke 303.531.4603 Ricardo Campoy 646.382.4000 Vince Cannaliato 917.533.4152 Tyler Comann 415.272.2463 Ian Cookson 617.470.9338 Rick deNey 203.972.9100 Mike Ewing 973.713.1463 National Footprint, Global Reach: Over 25% of Revenue Cross-Border United States International  26 countries  50 offices  300 professionals North America  7 offices  64 professionals  Award winning partners in the UK, France, Germany, Netherlands and India  Long history of success in Spain, Russia, Japan, Brazil, South Africa and Italy  Over 80 languages spoken 2 Horacio Facca 617.312.3420 David Francione 617.419.2040 Grant Garbers 949.706.8444 Gregory Gerard 303.572.6016 Darin Good 303.549.5674 Bill Harrison 917.596.5533 Sam Hill 214.457.4832 CJ Hummel 303.217.5743 Paul Janson 303.572.6012 Rick Jeffrey 917.538.2446 Roger Kahn 917.597.2245 Samrat Karnik 917.733.6022 Russia David Wolfe 12.495.721.1370 Mark Bond 12.495.721.1370 Spain Maarten De Jongh 34.933.426.227 Igor Gorostiaga 34.944.352.311 India Karan Gupta 230.213.6514 Mahesh Singhi 91.22.6634.6666 Japan Owen Hultman 81.3.6895.5521 Masahito Tachikawa 81.3.6895.5521 Mexico Fausto Garcia 52.55.5203.4430 Javier Arce Fernandez 52.55.5208.4430 Poland Michael Harvey 48.22.236.9227 Piotr Olejniczak 48.22.236.9227 South Africa Pieter Veldtman 27.82.566.6352 Pieter Venter 27.82.566.6352 Canada Don Lioutas 416.496.3075 Eric Klein 416.496.3742 South America Leonardo Antunes 55.21.3873.8000 Felipe Monaco 55.11.4114.2047 United Kingdom Mark Humphries 44.20.7881.2990 Mark Wilson 44.121.654.5000 Benelux Jan Willem Jonkman 31.73.623.8774 Ron Belt 31.73.623.8774 France Michel Degryck 33.148.246.300 Jean-Pierre Brice 33.148.246.300 Germany Michael Fabich 49.611.205.4825 Ervin Schellenberg 49.611.205.48.10 Italy Nuccia Cavalieri 39.02.92.88.04.00 Stefano Pastore 39.02.92.88.04.00 Thailand Chayot Vitayanonektavee 66.2664.9100 Jim Vorapon Ponvanit 66.2664.9100 Turkey Omer Unsal 0212.215.52.40 Brian Pietravalle 202.595.4739 Rod Rivera 917.969.4270 Carlos Rodriguez 858.752.4350 Joel Schneyer 303.619.4211 Brad Schreiber 949.706.8440 Phil Seefried 303.572.6004 Kevin Slocum 203.331.5955 Jerry Sturgill 208.287.8903 Mike Swartz 303.531.5009 Doug Usifer 908.432.7792 Bill Young 203.622.1044 Sun Jen Yung 917.297.8716
  • 3.
    1) Prices -Cyclical 2) Demand – BRIC countries are the drivers 3) Raw Material Supply 4) Political Risk in the Mining Sector – Fraser Institute 5) Raising Capital – TSX and TSXV 6) Development Stage Gold Companies Value Proposition Timeline 7) Frac Sand Industry Overview 8) Closing Thoughts Presentation Outline 3
  • 4.
    1) Prices -Cyclical 2) Demand – BRIC countries are the drivers 3) Raw Material Supply 4) Political Risk in the Mining Sector – Fraser Institute 5) Raising Capital – TSX and TSXV 6) Development Stage Gold Companies Value Proposition Timeline 7) Frac Sand Industry Overview 8) Closing Thoughts Presentation Outline 4
  • 5.
  • 6.
    Copper Stocks andCopper Prices – Inverse Relationship Source: International Copper Study Group – 2013 Factbook 6
  • 7.
    Cumulative Production0% 40%60%20% 100%80% Supply demand d1 d2 d3 lower taxes more gov’t spending lower interest rates loose money supply higher taxes less gov’t spending higher interest rates tight money supply substitution Macroeconomics – Supply & Demand 7 Source: Headwaters Research
  • 8.
    World Copper UsePer Capita Source: International Copper Study Group – 2013 Factbook 8
  • 9.
    Intensity Of UseFor Copper – 7 Largest Economies In 2012 Source: ICSG and IMF estimates 9
  • 10.
    1) Prices -cyclical 2) Demand – BRIC countries are the drivers 3) Raw Material Supply 4) Political Risk in the Mining Sector – Fraser Institute 5) Raising Capital – TSX and TSXV 6) Development Stage Gold Companies Value Proposition Timeline 7) Frac Sand Industry Overview 8) Closing Thoughts Presentation Outline 10
  • 11.
    Population in Millions 2014Population Estimate = 7.2 Billion People Source: Internet World Stats – Miniwatts Marketing Group – estimated world population 7.18 billion 11
  • 12.
    Time to SuccessiveBillions in World Population 1800 -2050 Source: US Census Bureau 12
  • 13.
    Population in Millions 2050Population Forecast = 9.1 Billion People Source: Internet World Stats – Miniwatts Marketing Group – US Census Bureau BRIC Countries of Brazil, Russia, India, China = 38% 13
  • 14.
    GDP % AnnualGrowth Rates Source: The World Bank 14
  • 15.
    China Crude SteelApparent Consumption Source: The Globe and Mail, Mysteel 15
  • 16.
    German Exports Source: TheGlobe and Mail, Bloomberg 16
  • 17.
    1) Prices -cyclical 2) Demand – BRIC countries are the drivers 3) Raw Material Supply 4) Political Risk in the Mining Sector – Fraser Institute 5) Raising Capital – TSX and TSXV 6) Development Stage Gold Companies Value Proposition Timeline 7) Frac Sand Industry Overview 8) Closing Thoughts Presentation Outline 17
  • 18.
    Global Sources Supply– Number of Suppliers 18
  • 19.
    Global Sources ofSupply – Limited Number of Suppliers 19
  • 20.
    Global Sources ofChromite – Potential Supply Issues  Global Reserve Base is sufficient to meet conceivable demand for centuries  No substitute for chromium in stainless steel production  South Africa mining industry not meeting its risk adjusted returns on capital  Kazakhstan unreliable supplier 20
  • 21.
    1) Prices -cyclical 2) Demand – BRIC countries are the drivers 3) Raw Material Supply 4) Political Risk in the Mining Sector – Fraser Institute 5) Raising Capital – TSX and TSXV 6) Development Stage Gold Companies Value Proposition Timeline 7) Frac Sand Industry Overview 8) Closing Thoughts Presentation Outline 21
  • 22.
    Difficult Investment Landscapefor Miners Source: Novagold - Presentation San Francisco Gold Conference November 2013 Mexico: New 8% tax on gold profits South America 1. Peru: Construction halted at largest mine due to gov’t review and social unrest. 2. Ecuador: Political obstacles and windfall tax discourage foreign investment in mining. 3. Venezuela: Five mining companies seeking compensation through World Bank’s arbitration court following nationalizations. 4. Bolivia: Nationalization of various natural resources assets. 5. Argentina: Miners required to repatriate revenues from foreign sales, limitations imposed on foreign exchange. Controls on imports of equipment/supplies have also been tightened Africa 6. Ghana: Increase in tariffs on mines and introduced a windfall tax, halting project expansions. 7. Guinea: New law gives government a 35% stake; threat of nationalization. 8. Mali: Recent military coup creating political uncertainty 9. Kenya: Rising mineral royalties and drilling fees for mining. 10. Congo: Plans to revise mining code, raise taxes and increase stake in mining projects 11. Zimbabwe: Gov’t plans to seize control of foreign- owned mines. 12. South Africa: Ongoing dialogue to nationalize mining industry. Russia, Asia & Australia 13.Indonesia: Newly proposed legislation limits foreign ownership of mines to 49%. 14.Philippines: New royalties and taxes being imposed on mining companies. 15.Mongolia: Drafting investment law to restrict foreign ownership. 16.Kyrgyzstan: Parliamentary motion calling for increased government stake in one of its largest mines Heightened Geopolitical/Permitting Risk in North America 22 BC: Mt Polly tailings dam spill Alaska: EPA’s “stoppage” of Pebble Mine under sec 404C of clean water act Quebec: Amendments To Mining Act BC: Canada Supreme Court Tsilhqot’in First Nation Ruling
  • 23.
     Providing valuableinformation to the mining industry and policy makers since 1997 on political risk by examining 13 policy areas such as taxation, regulation, land claims, etc.  Sent to 4,100 executives at exploration, development, and mining consulting companies. Asked to respond only for jurisdictions which they know  Responses from 690 executives, representing $3.4 billion in exploration spending in 2013  A composite index of the policy areas  0 is worst policy; 100 is best www.fraserinstitute.org Fraser Institute 2013 Mining Survey 23
  • 24.
    1) UNCERTAINTY REGARDINGTHE ADMINISTRATION, INTERPRETATION, OR ENFORCEMENT OF EXISTING REGULATIONS 2) UNCERTAINTY CONCERNING ENVIRONMENTAL REGULATIONS 3) REGULATORY DUPLICATION AND INCONSISTENCIES (includes federal/provincial, federal/state, inter-departmental overlap, etc.) 4) TAXATION REGIME (includes personal, corporate, payroll, capital, and other taxes, and complexity of tax compliance) 5) UNCERTAINTY CONCERNING NATIVE / ABORIGINAL LAND CLAIMS 6) UNCERTAINTY CONCERNING WHAT AREAS WILL BE PROTECTED AS WILDERNESS OR PARKS 7) INFRASTRUCTURE (includes access to roads, power availability, etc.) 8) SOCIOECONOMIC AGREEMENTS / COMMUNITY DEVELOPMENT CONDITIONS (includes local purchasing, processing requirements or supplying social infrastructure such as schools or hospitals, etc.) 9) POLITICAL STABILITY 10) LABOUR REGULATIONS / EMPLOYMENT AGREEMENTS 11) QUALITY OF THE GEOLOGICAL DATABASE (includes quality and scale of maps, ease of access to information, etc.) 12) SECURITY (includes physical security due to the threat of attack by terrorists, criminals, guerrilla groups, etc.) 13) AVAILABILITY OF LABOUR / SKILLS The Fraser Institute – Policy Survey 24
  • 25.
    Source: Fraser Institute– 2013 Mining Survey 2013 Fraser Results - Policy Perception Index Top 10 Sweden (best) Finland Alberta Ireland Wyoming Western Australia New Brunswick Nevada Newfoundland/Labrador Norway Bottom 10 Madagascar Indonesia Ivory Coast Zimbabwe Argentina – Mendoza Angola Argentina – La Rioja Philippines Venezuela Kyrgyzstan (worst) 25
  • 26.
    E&Y Top BusinessRisks in Mining Sector 26 Source: E & Y, Business Risks Facing Mining & Metals 2014 - 2015
  • 27.
    1) Metal Prices- cyclical 2) Demand – BRIC countries are the drivers 3) Raw Material Supply 4) Political Risk in the Mining Sector – Fraser Institute 5) Raising Capital – TSX and TSXV 6) Development Stage Gold Companies Value Proposition Timeline 7) Frac Sand Industry Overview 8) Closing Thoughts Presentation Outline 27
  • 28.
    2013 Mining MarketsAt A Glance Source: 28
  • 29.
    Diversity in theIssuer Base – Geographic Focus Source: 29
  • 30.
    Diversity in theIssuer Base – Primary Metals & Location Source: 30
  • 31.
    TSX & TSXV– 3673 Issuers – 44% Mining Source: 31
  • 32.
  • 33.
    Number of MiningCompanies by the Stage of Project Development Source: 33
  • 34.
    Disconnect Between GoldMiner Indexes and Broader Market 34 Source: Headwaters Research
  • 35.
    1) Metal Prices- cyclical 2) Demand – BRIC countries are the drivers 3) Raw Material Supply 4) Political Risk in the Mining Sector – Fraser Institute 5) Raising Capital – TSX and TSXV 6) Development Stage Gold Companies Value Proposition Timeline 7) Frac Sand Industry Overview 8) Closing Thoughts Presentation Outline 35
  • 36.
    Source: MinEx Consulting,Mining Journal Gold Supplement, August 2014 Gold Discovery Cost 36
  • 37.
    0 200 400 600 800 1,000 1,200 2010 2011 20122013 Total Cash Total Production All-In Sustaining $739$713$624 Source: Metals Focus $548 $1,066 $1,045 $/oz Mining Cost Inflation 37
  • 38.
    Source: Metals Focus $/oz -200 0 200 400 600 800 1,000 1,200 1,400 1,600 1,800 2,000 2,200 2,400 -200 0 200 400 600 800 1,000 1,200 1,400 1,600 1,800 2,000 2,200 2,400 025 50 75 100 Cumulative Gold Production (%) Total Cash Cost H1 14 Av. H1 14 Gold Price Total Cash Cost H1 13 Av. H1 13 Gold Price Industry Cash Cost Curve H1 2014 38
  • 39.
    Source: Metals Focus -200 0 200 400 600 800 1,000 1,200 1,400 1,600 1,800 2,000 2,200 2,400 -200 0 200 400 600 800 1,000 1,200 1,400 1,600 1,800 2,000 2,200 2,400 025 50 75 100 Cumulative Gold Production (%) All-In Sustaining Cost H1 14 Av. H1 14 Gold Price All-In Sustaining Cost H1 13 Av. H1 13 Gold Price Industry All-In Sustainable Cost H1 14 39
  • 40.
    0 200 400 600 800 1,000 1,200 1,400 1,600 1,800 Q1 13 Q213 Q3 13 Q4 13 Q1 14 Q2 14 Total Cash Cost All-In Sustaining Cost Gold Price $301/oz $292/oz$312/oz $338/oz $321/oz Source: Metals Focus $/oz $535/oz Margins Under Pressure 40
  • 41.
    SNL Pipeline ActivityIndex Source: SNL Metals & Mining 2014 41
  • 42.
    SNL Significant GoldDrill Results Announced Source: SNL Metals & Mining 2014 42
  • 43.
    43 The Institutional Moneyhas lost confidence … ˗ that costs can be controlled ˗ that capital discipline will occur ˗ that restructurings can deliver on promises ˗ that returns on capital employed will improve ˗ that the industry won’t pile back into too many new projects or expensive deals when prices rebound ˗ that resource nationalism will not overwhelm the industry ˗ that commodity prices will not collapse ˗ that “stuckholders” have an exit … and the markets reflect this loss of confidence Institutional Money Is Not Buying Gold Exploration Lottery Tickets
  • 44.
    Why Buy AnIlliquid Share When You Can Buy An ETF? 44 Source: Yahoo Finance
  • 45.
     No control– generally passive  Upfront payment for metal – generally passive, much more important financing source today  Rise of PE as active investors and generally absolute control  May have board representation, early toehold in projects  The rise of state backed investments (e.g. China and Korea) 45 Company Project Retail Sovereign Wealth InstitutionalMoney Private Equity Streaming & Royalty Strategics Merchant Traders Mutual Funds Major Shift In How Institutional Money Invests In Sector
  • 46.
    46 Development Stage GoldCompanies trade at an Enterprise Value of $16 per ounce of M, I, & I (NI 43-101) with average estimated project development costs of $91 per ounce *EV = (share price x # shares) – current assets + total liabilities **9/29/2014 share prices at close Au=$1219.50/oz, Ag=$17.58/oz However The Development Stage Business Model Looks To Be Unsustainable
  • 47.
    47 Once the Projectenters the Development Investment Analysis Phase (PEA – Prefeasibility – Feasibility), companies see a long period of share price erosion as studies, permitting and de-risking drag on. Life Cycle of a Gold Mining Share – Dec 2013 119th Annual Meeting De-risking &
  • 48.
    48 Once the Projectenters the Development Investment Analysis Phase (PEA – Prefeasibility – Feasibility), companies see a long period of share price erosion as studies, permitting and de-risking drag on. Life Cycle of a Gold Mining Share – Dec 2014 120th Annual Meeting
  • 49.
    Donlin Gold Project– Advancing Toward a Production Decision Source: NovaGold 2nd Q & Project Update Presentation, July 2014 49
  • 50.
    50 Development Stage GoldCompanies Trade on Average at $16/oz Resource Costs to Complete Drilling, Feasibility & Permitting ~$10/oz Resource Capital Development Costs $91/oz Resource Owners Costs Not in Feasibility (25%) $23/oz Resource Total $140/oz Resource Actual Trading Market Multiples • Small Gold Producers $71/oz Resource • Intermediate Gold Producers $70/oz Resource • Large Gold Producers $129/oz Resource • Silver Producers $128/oz Resource So What Is the Problem?
  • 51.
    Focus On SustainableDevelopment And What You Can Control  Mining investors are increasingly focused on investment returns. Focus less on project IRR’s and more on Project rank on cost curve Attractive Returns & Economic 51 Staged Development Low Political Risk Available Workforce  To minimize capital risk, design around an initial high grade starter pit with scaled expansion & investigate the lower cap intensity heap leach option  Conventional process circuit. Will take project thru “detailed engineering” before seeking project finance  Favorable jurisdiction with long established mining laws  Host jurisdiction has available trained and or trainable work force, only need modest number of expatriate supervisors Permitting & Social Issues  Have local stakeholders (partners) with financial stake that are on record supporting project and EIS process Completion & Overrun Risk
  • 52.
    1) Metal Prices- cyclical 2) Demand – BRIC countries are the drivers 3) Raw Material Supply 4) Political Risk in the Mining Sector – Fraser Institute 5) Raising Capital – TSX and TSXV 6) Development Stage Gold Companies Value Proposition Timeline 7) Frac Sand Industry Overview 8) Closing Thoughts Presentation Outline 52
  • 53.
    Industry Observations –The Unconventional Shale Plays 53
  • 54.
    Industry Observations –Sand Market Overview 54 Major Dynamics Demand Supply Competition Pricing  Demand is increasing faster than supply  Logistics capabilities are no longer a competitive advantage but still a necessity  There is rapidly growing need for high quality frac sand - more wells per section, more stages per well, more sand per stage  Exponential decline of unconventional shale plays requires continued drilling to keep production levels up  Permitting is becoming harder (NIMBY)  Economic and mineable deposits of Northern White sand hard to find  Not much of an issue in an “expanding” market  The consolidation in the industry is just beginning  Long-term contract pricing of $50 to 65 per ton (20/70) FOB Mine  Prices for 100 mesh have found strength
  • 55.
    Industry Observations –Secular Demand Drivers for Proppant 55 Proppant demand is expected to increase over the next several years  Proppant growth has outpaced rig count due to high service intensity and increased horizontal drilling  Pressure pumpers are increasing, facing efficiencies and completing jobs faster  Down spacing creates more locations to drill  Use of cemented liners versus sliding sleeves increases sand usage  Overall increase in frac sizes per stage  Increased number of frac stages per well
  • 56.
    Proppant Market Differentiation 56 Source:Emerge Energy Services, Investor Presentation, April 2014 The quality of proppants produced from St Peter Sandstone often is a function of the process flowsheet utilized and careful attention to cleaning, not differences in the raw sand quality
  • 57.
    Economics of theUnconventional Plays 57 Source: Benteck Energy, 2nd Annual Frac Sand Conference, Minneapolis 2014
  • 58.
    Oil and NGLPlays Earning the Highest Returns 58 Source: Benteck Energy, 2nd Annual Frac Sand Conference, Minneapolis 2014
  • 59.
    Frac Sand Demand– Regional Sand Consumption (billion lbs) 59 Source: PacWest Consulting, Frac Sand Logistics Conference – San Antonio, August 2014
  • 60.
    Industry Observations –Proppant Demand Expected to Remain Strong 60 1.8 7.0 29.6 51.2 78.5 $40 $48 $58 $68 $80 $25 $35 $45 $55 $65 $75 $85 0 20 40 60 80 100 2002 2007 2012 2017 2022 Raw Frac Sand Resin-Coated Sand, Ceramics, Other Raw Frac Sand Price (S/ton) (Millions of Tons) (S/Ton) Historical and Projected Industry Proppant Demand Source: Hi-Crush Partners Company Presentation, Freedonia Group
  • 61.
    Frac Sand ShippingFlows 61 Source: PLG Consulting, 2nd Annual Frac Sand Conference, Minneapolis 2014
  • 62.
    Regulatory Authority andControl Nonmetallic Mining in Wisconsin 62 Source: GZA Environmental, 2nd Annual Frac Sand Conference, Minneapolis 2014
  • 63.
    Frac Sand HandledBy Railroads 63 Source: PLG Consulting, 2nd Annual Frac Sand Conference, Minneapolis 2014
  • 64.
    Rail Operating Metrics 64 Source:Freight Car America Inc, 2nd Annual Frac Sand Conference, Minneapolis 2014
  • 65.
    Frac Sand DeliveredCost to Wellsite 65 Source: Raymond James, Global Research Report, August 2014 The Miner = $60/t Revenue - $35/t OC = $25/t EBITDA
  • 66.
    - Operates 15locations across the USA, owns 297 tons of sand reserves including 138 million tons which can processed to produce API spec frac sand. In 2013, sold 8.16 million tons of sand at average price of $66.90/ton. Portfolio company of Golden Gate Capital, IPO in 2012; Golden Gate sold out its position in 2013. - Was formed by private equity firm Insight Equity in 2012. In May 2013, Emerge Energy Services was combined with Superior Silica Sands (“SSS”), Allied Energy Company (“AEC”), and Direct Fuels (“DF”) in a series of transactions that culminated with the initial public offering of Emerge as LP. In 2013, sold 2.65 million tons of sand at average price of $63.28/ton. Still controlled by Insight Equity. - Was formed by private equity firm Avista Capital Partners in 2010. In August 2012, initial public offering of Hi-Crush as LP. In 2013, sold 1.85 million tons of sand at average price of $82.74/ton. Still controlled by Avista Capital Partners. Competitive Landscape 66
  • 67.
    - Employs over1,000 people, sold more than 6.0 million tons of sand and value- added sand products in 2011. Portfolio company of American Securities Capital Partners. There are rumors that an IPO is forthcoming. - One of the leading providers of high-quality proppant and related logistics services to the oil and gas industry in North America. All of Smart Sand’s facilities are located near major rail transport lines, ensuring reliable, cost- effective delivery to major shale plays in the U.S. and Canada. Portfolio company of Clearlake Capital. - Headquartered in Houston Texas, Cadre Services is a major supplier of API/ISO- quality Premium Hickory® Sand, with principal operations located in Voca, Texas. Portfolio company of Denham Capital Management. July 16, 2014 announcement that U.S. Silica Holdings, Inc. to purchase Cadre Services Inc. for $98 million. Adjusted LTM EBITDA of $11.1 million represents purchase price of 7.6x EBITDA. - Strategically located in New Auburn, WI and Garland City, AR to meet the demands of all major shale plays. Wisconsin plant originates on the Union Pacific railway and has access to Canadian National (CN) and Burlington Northern Santa Fe (BNSF) railways. Portfolio company of Energy Capital Partners. Competitive Landscape 67
  • 68.
    Median EBITDA Multiplefor Trading Comps: 6.0x (Energy) – 6.8x (Materials) – 7.6x (Cadre) Conclusion 68 July 16, 2014 announcement that U.S. Silica Holdings, Inc. to purchase Cadre Services Inc. for $98 million. Adjusted LTM EBITDA of $11.1 million represents purchase price of 7.6x EBITDA Median Enterprise Value / EBITDA Target's Sector Less Than $500M Greater Than $500M Less Than $500M Greater Than $500M Less Than $500M Greater Than $500M Less Than $500M Greater Than $500M Less Than $500M Greater Than $500M Consumer Discretionary 11.3x 10.5x 12.7x 8.5x 10.8x 8.5x 9.5x 9.1x 12.8x 9.7x Consumer Staples 12.7x 9.7x 7.2x 8.2x 9.5x 8.7x 8.7x 12.7x 9.8x 9.7x Energy 8.4x 9.9x 10.5x 14.9x 7.2x 9.2x 5.4x 13.1x 6.0x 5.5x Financials 12.7x 10.9x 12.7x 14.4x 11.0x 17.6x 10.3x 15.3x 12.2x 19.4x Healthcare 10.8x 10.1x 11.9x 12.7x 12.2x 12.1x 10.2x 11.3x 8.1x 14.8x Industrials 5.7x 9.3x 7.0x 8.8x 8.3x 11.2x 7.2x 9.7x 8.7x 10.3x Information Technology 8.1x 13.7x 12.6x 14.9x 9.5x 15.7x 12.0x 11.2x 12.6x 18.5x Materials 9.3x 11.9x 7.2x 10.9x 9.8x 9.7x 7.8x 8.2x 6.8x 11.4x Telecommunication Services 5.8x 7.3x 5.9x 7.4x 11.5x 8.7x 7.6x 8.4x 11.3x 11.2x Utilities 9.5x 11.0x 10.3x 11.3x 9.8x 10.7x 14.0x 8.7x 14.0x 9.9x 2010 2011 2012 2013 2014 Last Twelve Months Ending June 30th of: Recent Transactions
  • 69.
    Public Company –Frac Sand Trading Comparables 69 Source: Headwaters Research
  • 70.
    1) Metal Prices- cyclical 2) Demand – BRIC countries are the drivers 3) Raw Material Supply 4) Political Risk in the Mining Sector – Fraser Institute 5) Raising Capital – TSX and TSXV 6) Development Stage Gold Companies Value Proposition Timeline 7) Frac Sand Industry Overview 8) Closing Thoughts Presentation Outline 70
  • 71.
     Exploration isextremely risky with success rates akin to Pharma R&D developing a drug that can proceeds thru medical trials, expect a large percentage of exploration companies to be forced out of business  Recognition that the replacement cost of “risked reserves” are often lower than current market capitalizations, there will be continued consolidation in the resource sector especially as a way to “bank” value  Burgeoning debt of OECD countries (and US municipalities) causes new wave of “resource taxes”  Without social license to operate, a positive permitting outcome is problematic  Any carbon capture initiatives will have a “taxing” effect on the global economy, reduce demand and GDP Observations 71
  • 72.
    Global Warming –Anthropogenic Carbon Production Source: Dr. Timothy Gutowski, Department of Engineering at M.I.T., Keynote Address 40th CIRP International Manufacturing Systems Seminar at Liverpool University, 30 May to June 1 2007 These four components respectively are: 1) population, 2) affluence 3) energy intensity 4) carbon intensity “Results in reducing emissions to slow global warming reveal that while we are improving in both of the technology terms (energy intensity & carbon intensity), these are offset by the growth terms i.e. population and affluence” 72
  • 73.
     OECD economieswill continue to grow at slow rates, drag of carbon capture initiatives, debt load, aging populations and higher taxes  BRIC countries will extend infrastructure into hinterlands to boost domestic economies, reduce dependency on exports, and reduce tension between the coastal haves and the inland have nots  China will continue to convert US paper assets into ownership of “hard assets” around the world, to have title to the means of production and security of supply with regard to raw materials inputs  For the “mining developers”, Private Equity and its “managed money approach” has replaced the public stock markets as the go to source of capital in the mining sector  The Unconventional Shale Revolution has had (and will have) an enormous global impact and is driving the US economic growth engine Predictions 73
  • 74.
    Real Estate Asset BubbleCollapse US Housing Starts & Cement Consumption “Turned” 2 Years Before Dow 74
  • 75.
     SEDAR –official site that provides access to most public securities documents and information filed by public companies and investment funds with the Canadian Securities Administrators (CSA) in the SEDAR filing system. www.sedar.com  Kitco – latest metal news, commentaries, latest company news releases, technical and fundamental analysis, top performing equities, exchange rates, metal prices and charts. www.kitco.com  The Northern Miner – global mining newspaper published out of Toronto, print and web editions, subscription service. www.northernminer.com  The Fraser Institute – registered non-profit with offices in Canada and the United States with active research ties with similar independent organizations in more than 70 countries around the world. Measures and studies the impacts of markets and government interventions on the welfare of individuals. Produces annual mining policy survey. www.fraserinstitute.org  USGS Mineral Information – mineral summaries by commodity, country, and state. Excellent source of long term data series on production, consumption, and pricing. http://minerals.usgs.gov/minerals/index.html  Institute of Corporate Directors – pre-eminent organization for directors and recognized as the leading authority of standards of good governance. Supports director education though ICD education programs. www.icd.ca Resources 75
  • 76.
    The Headwaters Difference DEALOF THE YEAR - TMT INVESTMENT BANK OF THE YEAR INTERNATIONAL DEAL OF THE YEAR PROFESSIONAL (B2B) SERVICES INTERNATIONAL DEAL OF THE YEAR CONSUMER SERVICES INTERNATIONAL INVESTMENT BANK OF THE YEAR 76  Advocacy – unapologetic and conflict free  Award-winning client advice  Deep pool of transaction experience (over $265 billion)  National footprint (7 offices)  Global reach (25 countries, 50 offices)  Focused industry coverage (specialists, not generalists)  Full product/service offering  #1 investment bank for private wealth in the US  Proprietary capital: we can invest; unique access to family office capital  Long history of success  Teamwork unrivalled in the industry Capabilities • Culture • Results