Download as PDF, PPTX


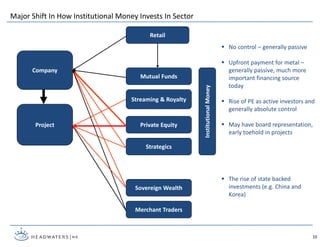
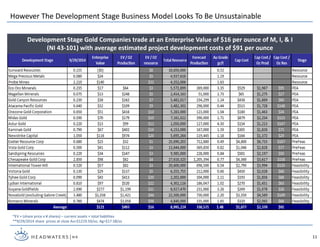
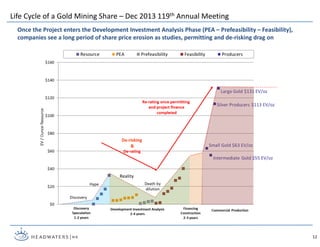
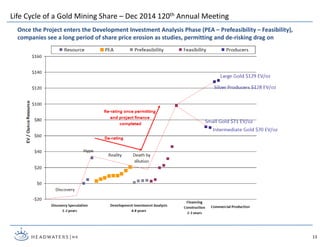
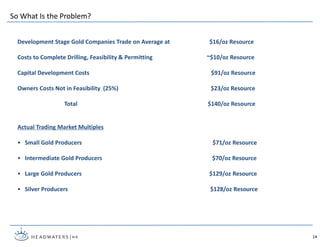
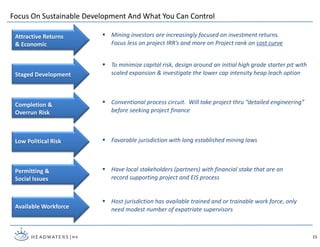

This document summarizes the challenges facing development stage gold mining companies. It notes that these companies currently trade at an enterprise value of $16 per ounce of resources, but that average development costs are $91 per ounce. It also discusses how institutional investors have lost confidence in the sector due to issues like cost overruns and resource nationalism. The document advocates focusing on sustainable development approaches that emphasize attractive investment returns, staged development, and low political risk.


