The document provides an overview of econometric analysis using Stata, detailing its features such as data management, statistical analysis, and graphical capabilities. It includes instructions for both interactive and batch modes, demonstrates various do files for analyzing datasets, and highlights essential commands for effective data manipulation and statistical testing. Overall, it serves as a guide for utilizing Stata in time series and panel data analysis.


![demo2.do
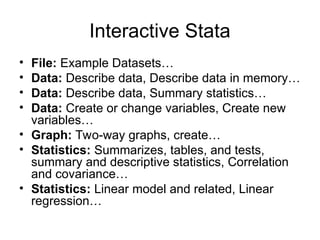
* Demo of do file #2
clear
infile year gasexp pop gasp income pnc puc ppt pd pn ps ///
using "c:course13ec570datagasoline.txt"
label data "Greene [2008], Table F2.2: The U.S. Gasoline Market"
label variable year "Year, 1953-2004"
label variable gasexp "Total U.S. gasoline expenditure"
label variable pop "U.S. total population in thousands"
label variable gasp "Price index for gasoline"
label variable income "Per capita disposable income"
label variable pnc "Price index for new cars"
label variable puc "Price index for used cars"
label variable ppt "Price index for public transportation"
label variable pd "Aggregate price index for consumer durables"
label variable pn "Aggregate price index for consumer nondurables"
label variable ps "Aggregate price index for consumer services"
describe
summarize
* save it as a Stata dataset
save "c:course12ec570datagasoline", replace
/*
generate g=ln(gasexp/pop) // log-per-capita gas consumption
generate y=ln(income/pop) // log-per-capita income
generate pg=ln(gasp) // log price of gas
generate pnew=ln(pnc) // log price of new cars
generate pused=ln(puc) // log price of used cars
regress g y pg pnew pused
*/](https://image.slidesharecdn.com/stataintro1-241115100620-3d80b13c/85/Introduction-to-Stata-data-management-and-analytic-techniques-8-320.jpg)
![demo3.do
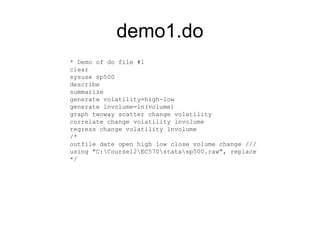
* Demo of do file #3
set more off
clear
//use "c:course13ec570datagasoline"
use http://web.pdx.edu/~crkl/ec570/data/gasoline
describe
summarize
generate g=ln(gasexp/pop) // log-per-capita gas consumption
generate y=ln(income/pop) // log-per-capita income
generate pg=ln(gasp) // log price of gas
generate pnew=ln(pnc) // log price of new cars
generate pused=ln(puc) // log price of used cars
regress g y pg pnew pused
// dynamic model with lagged variables
generate g1=g[_n-1]
regress g y pg pnew pused g1
// hypothesis testing
test pnew pused
test pnew+pused=0
// prediction
predict e, residual
predict ghat, xb
twoway scatter e ghat
// structural break](https://image.slidesharecdn.com/stataintro1-241115100620-3d80b13c/85/Introduction-to-Stata-data-management-and-analytic-techniques-9-320.jpg)