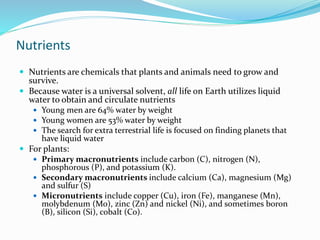
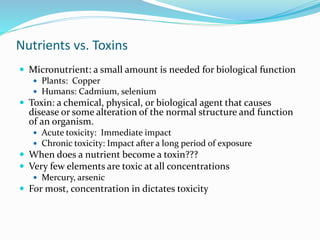
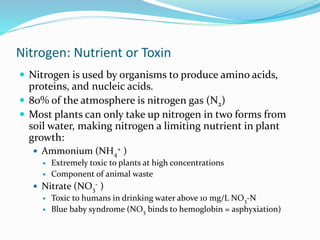
1. Nutrients are essential for plant and animal growth but can become toxic at high concentrations. Nitrogen is particularly complex as it can be both a nutrient and toxin depending on its form and concentration.
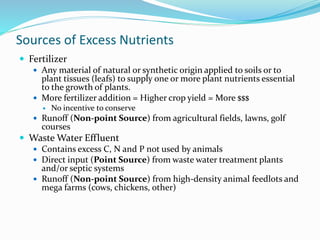
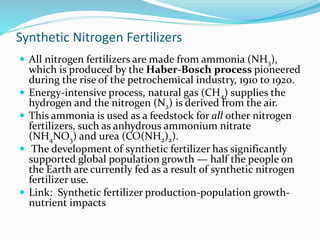
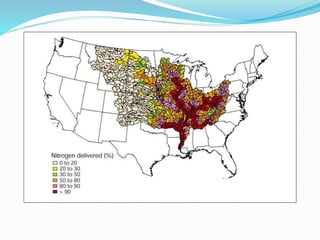
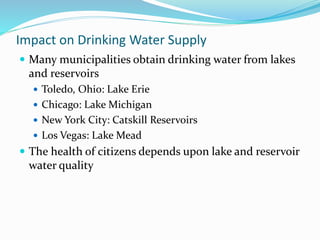
2. Excess nutrients from fertilizer, wastewater, and animal waste can lead to algal blooms, hypoxia, and eutrophication in waterbodies. This degrades water quality, harms ecosystems and fisheries, and impacts drinking water supplies.
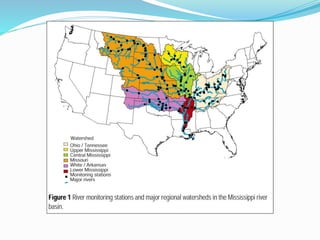
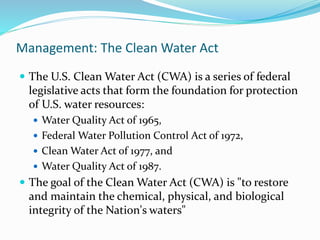
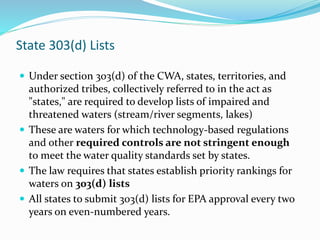
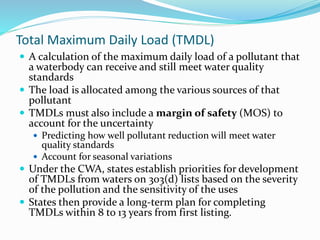
3. The Clean Water Act established water quality standards and requires states to monitor impaired waters and develop nutrient reduction plans called Total Maximum Daily Loads to restore water quality.