Downloaded 10 times
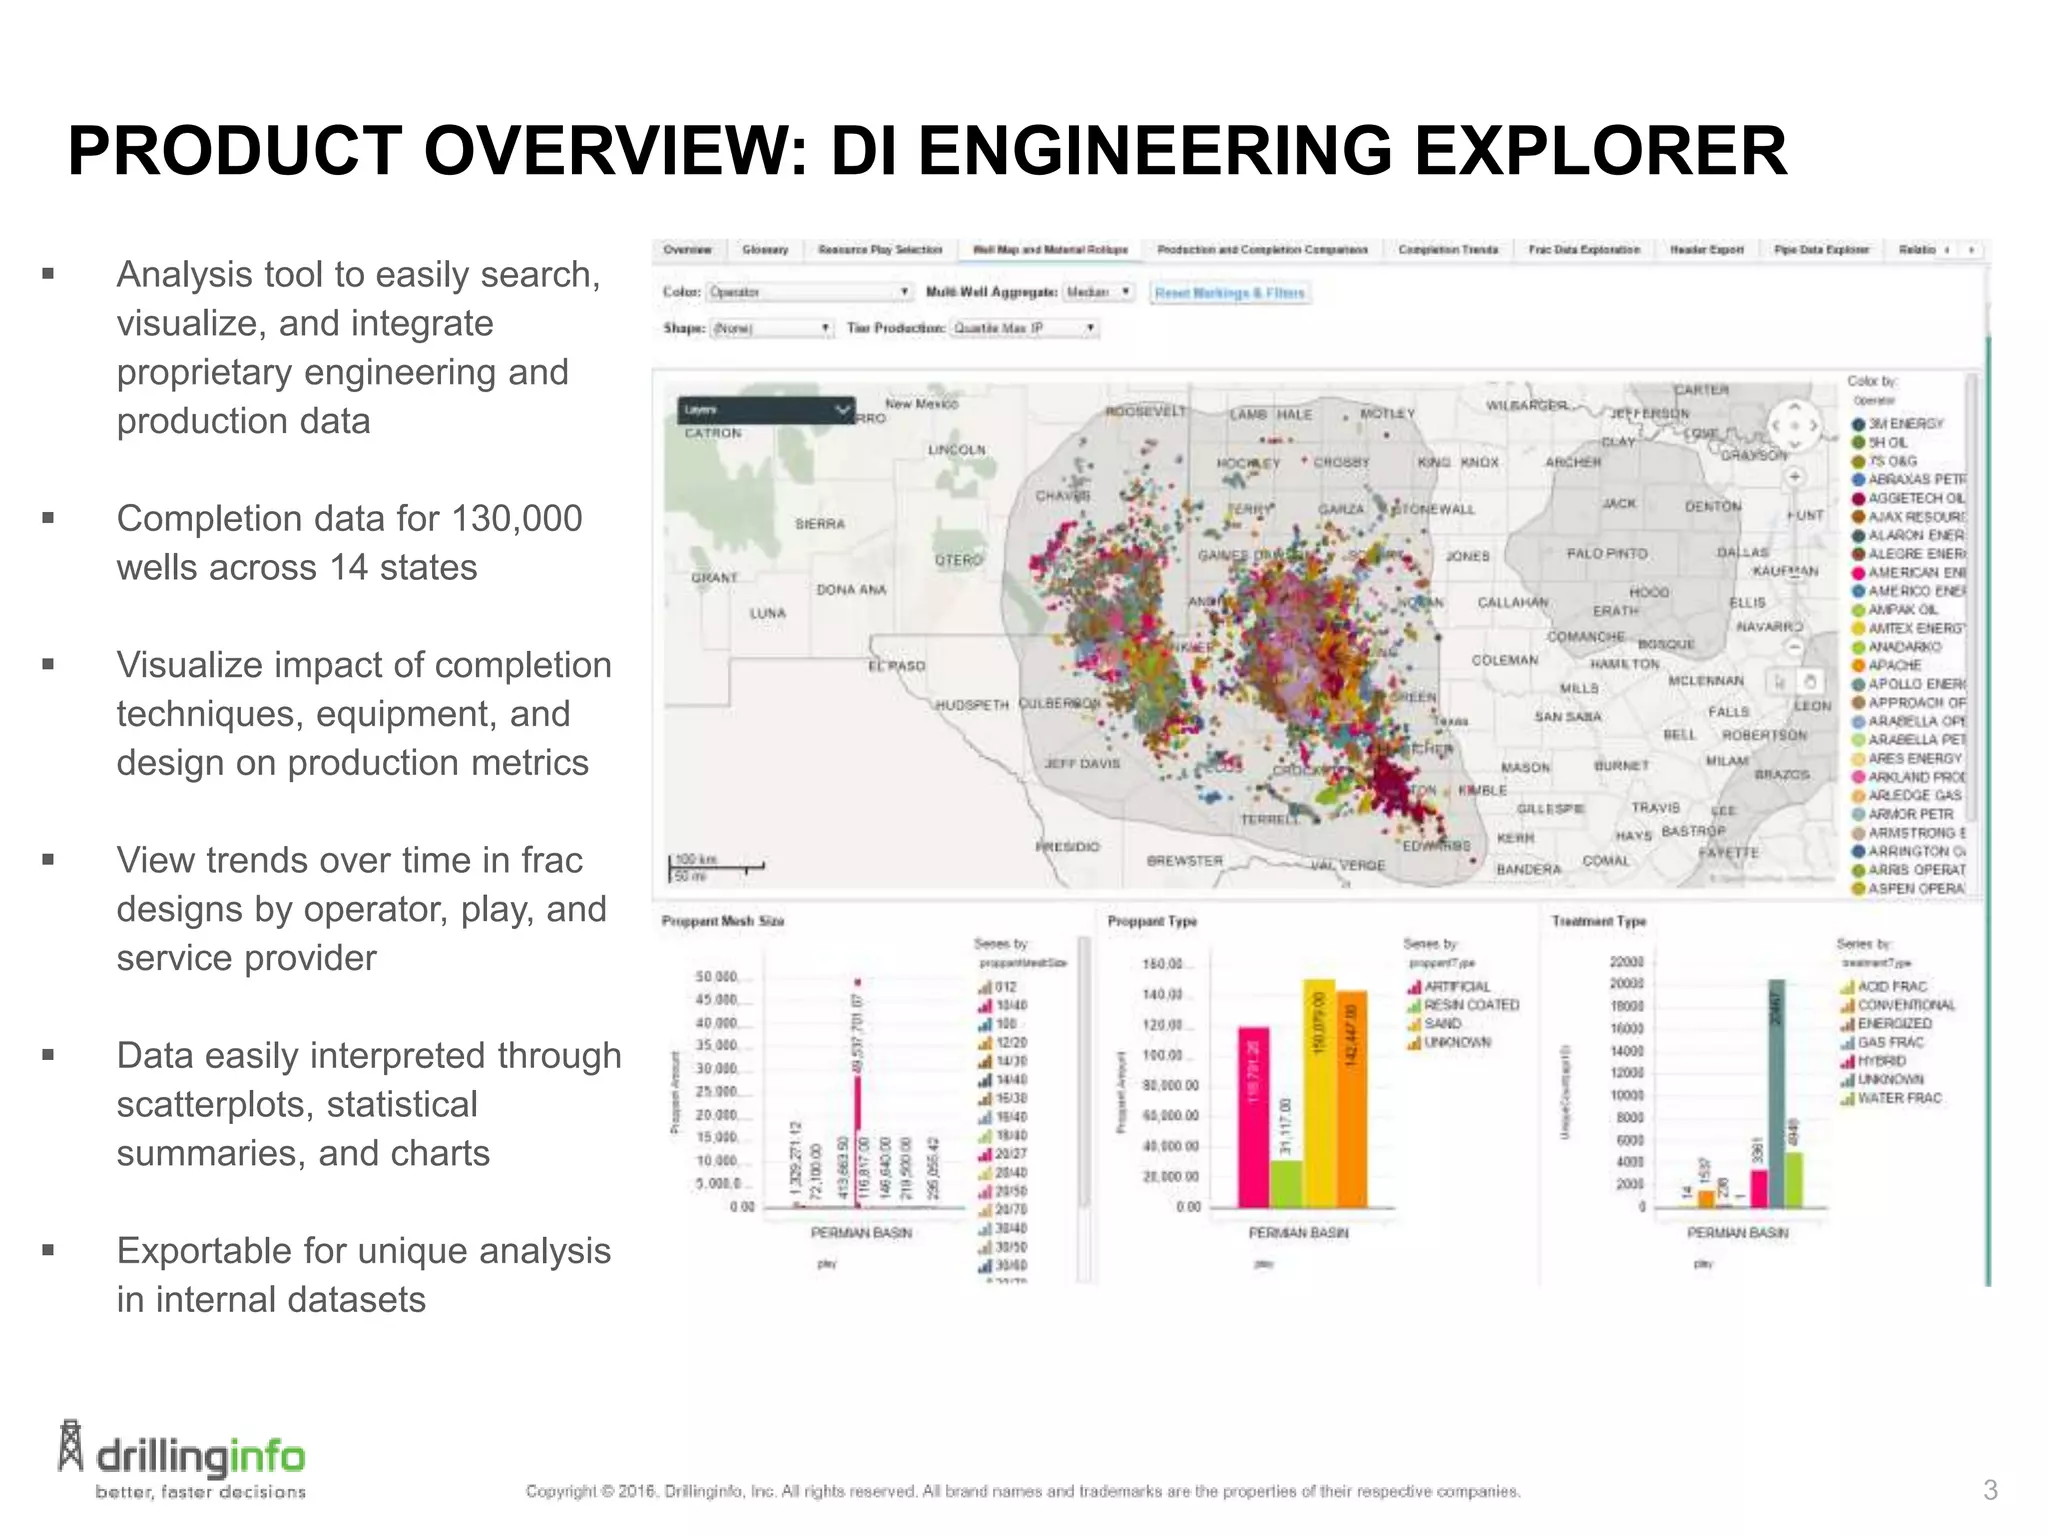
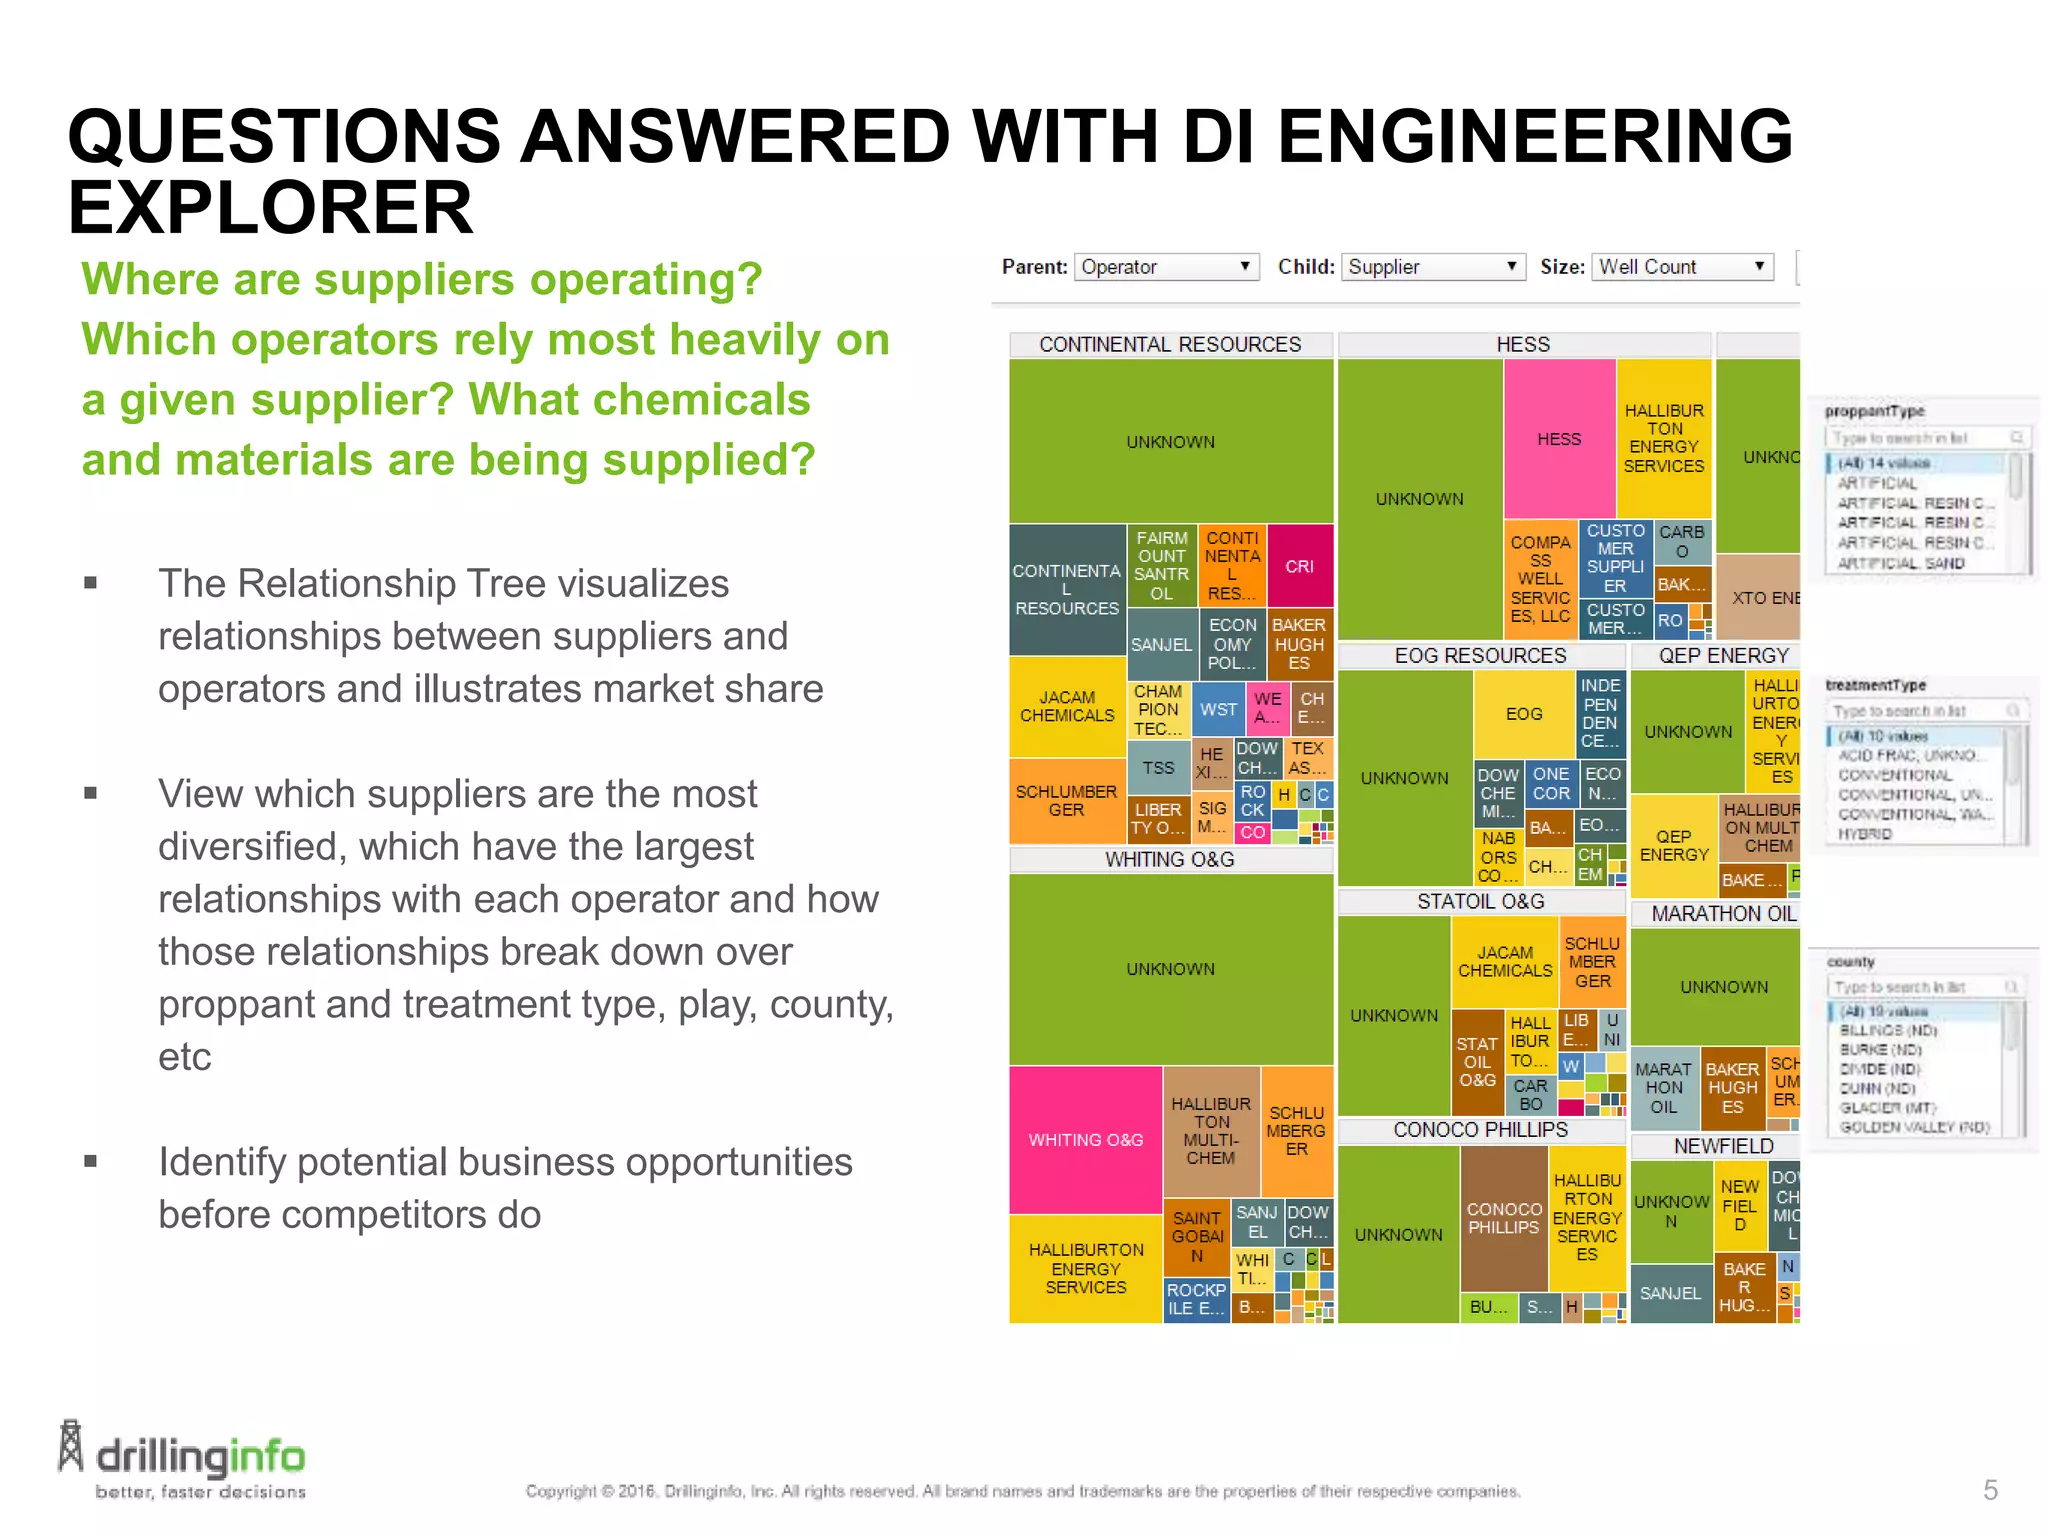
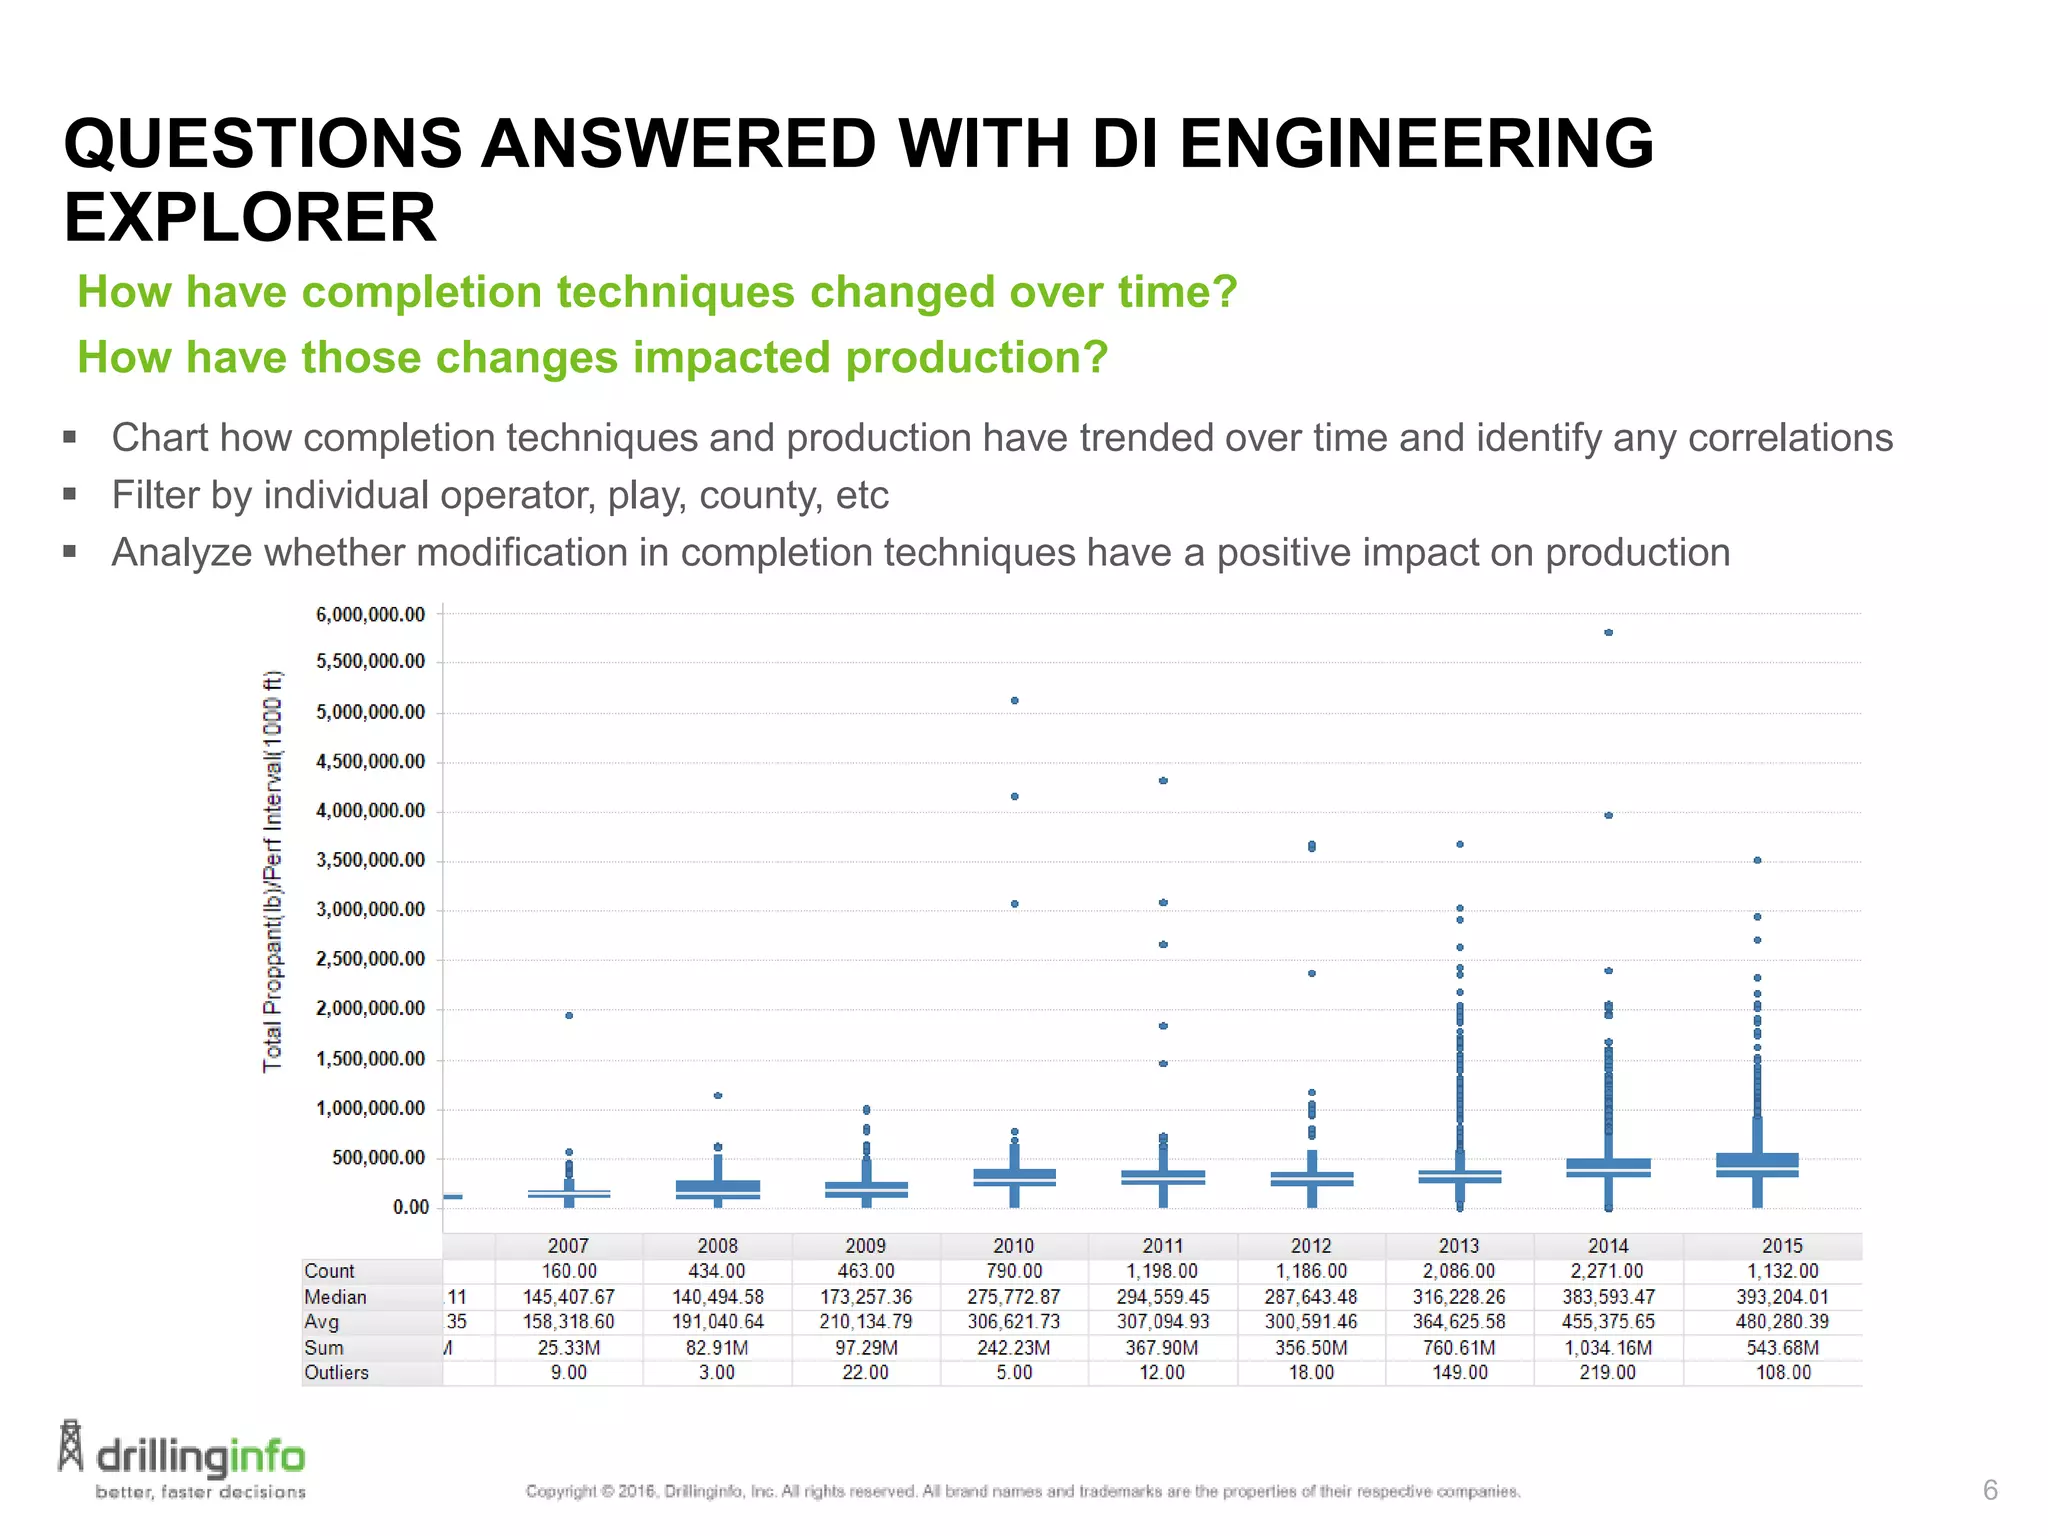
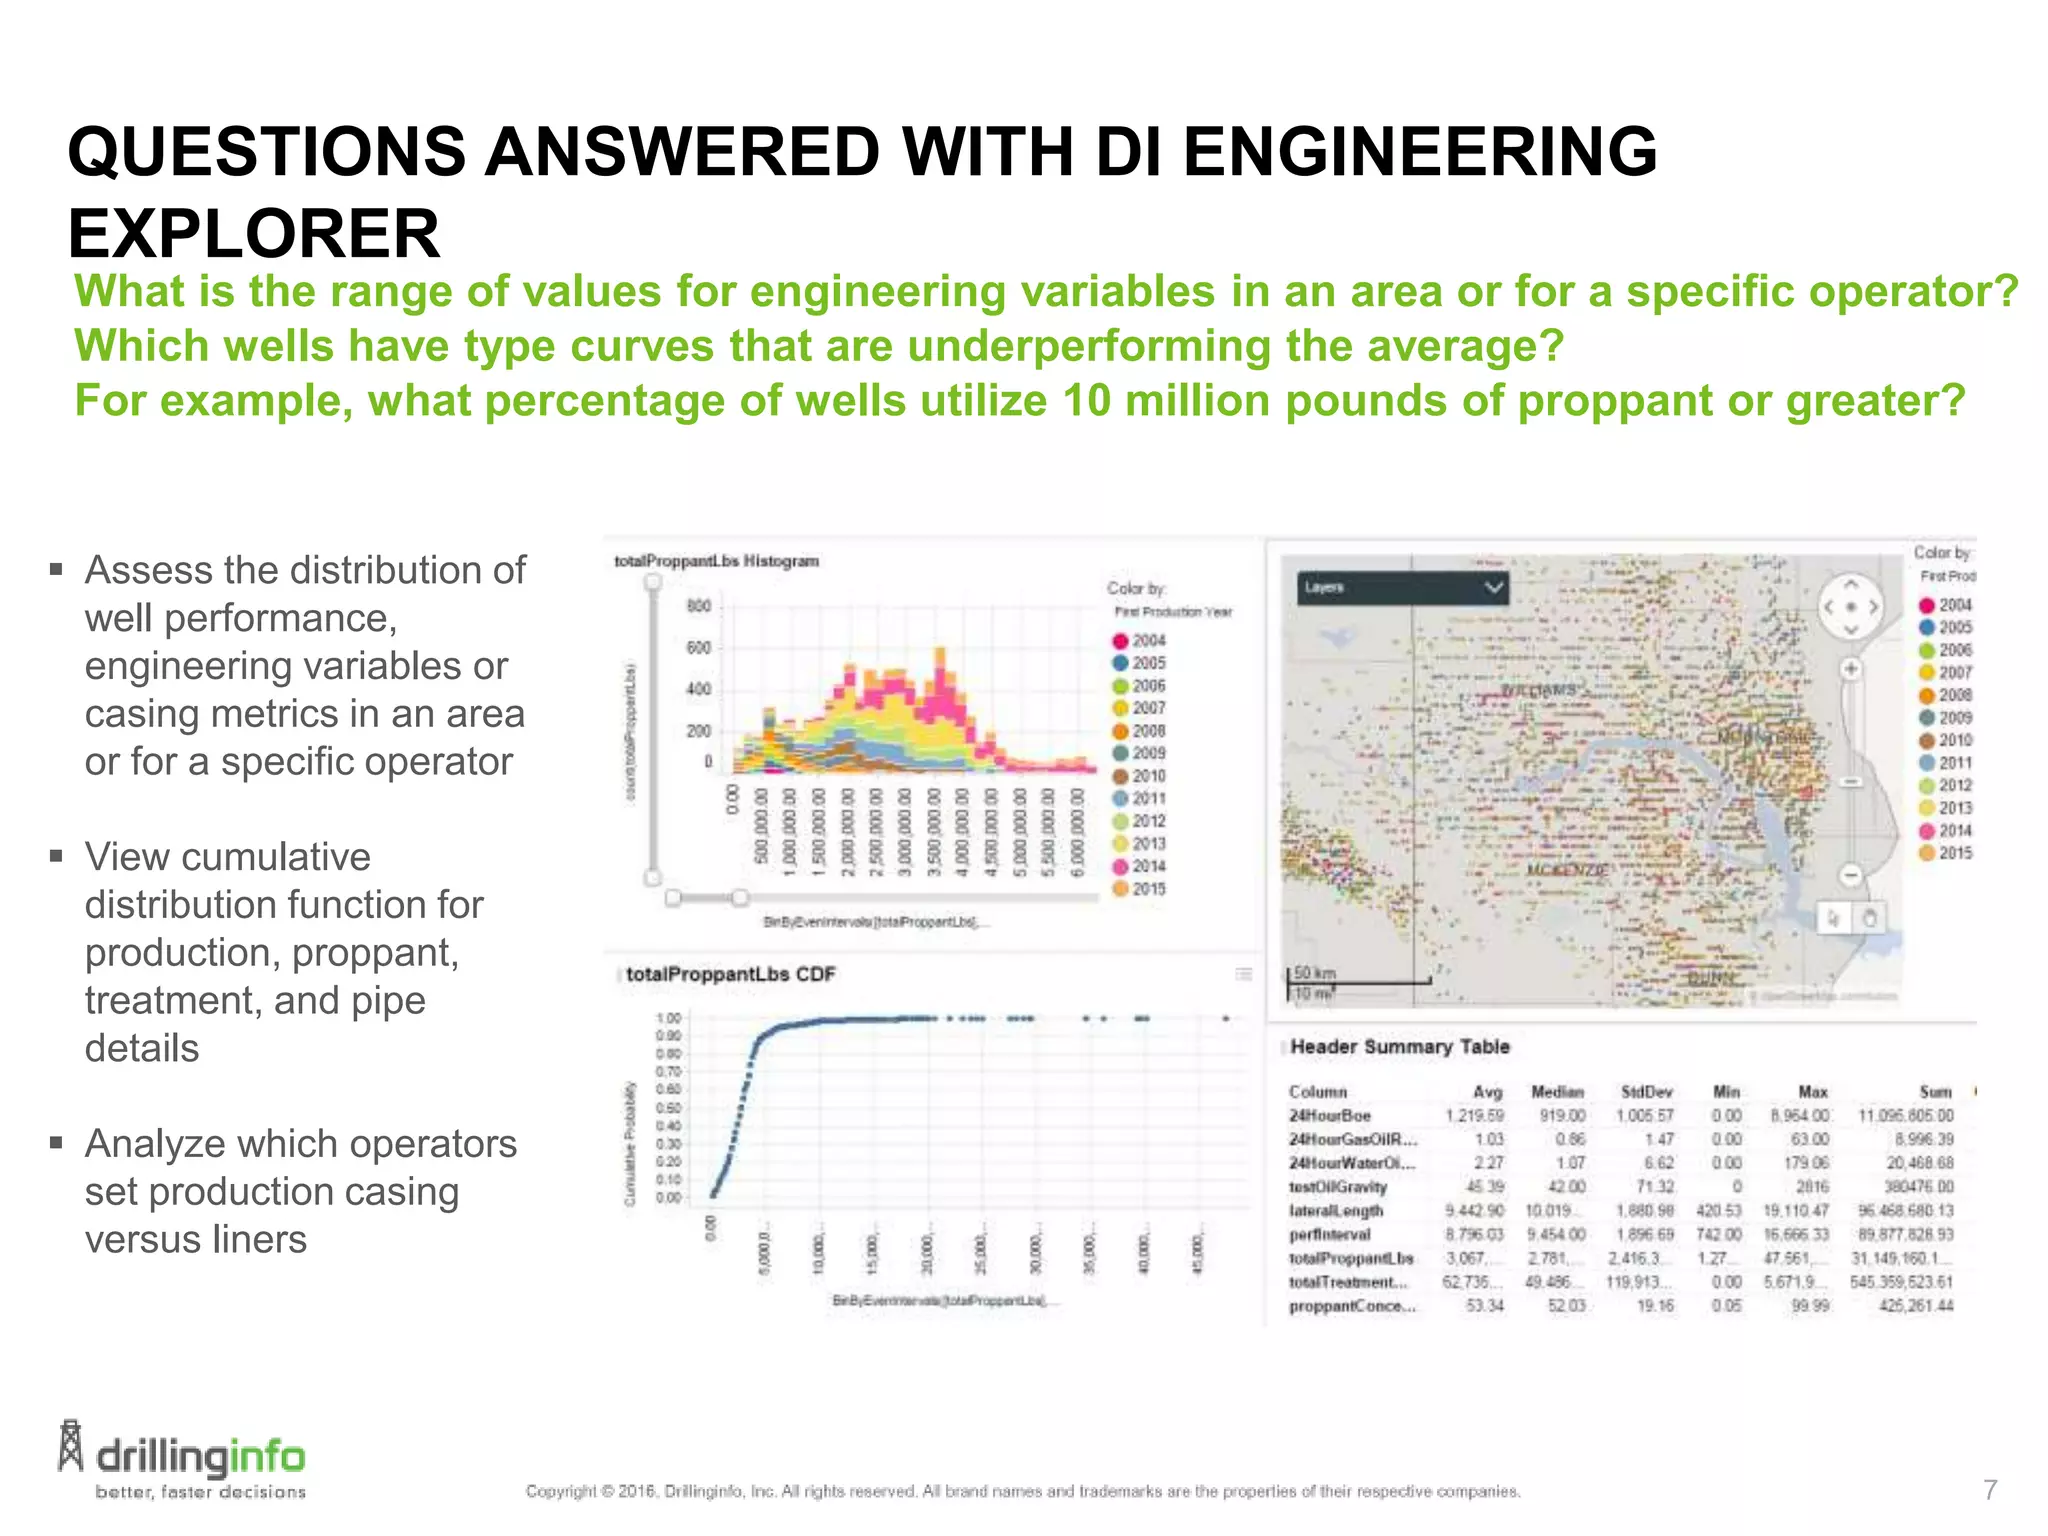
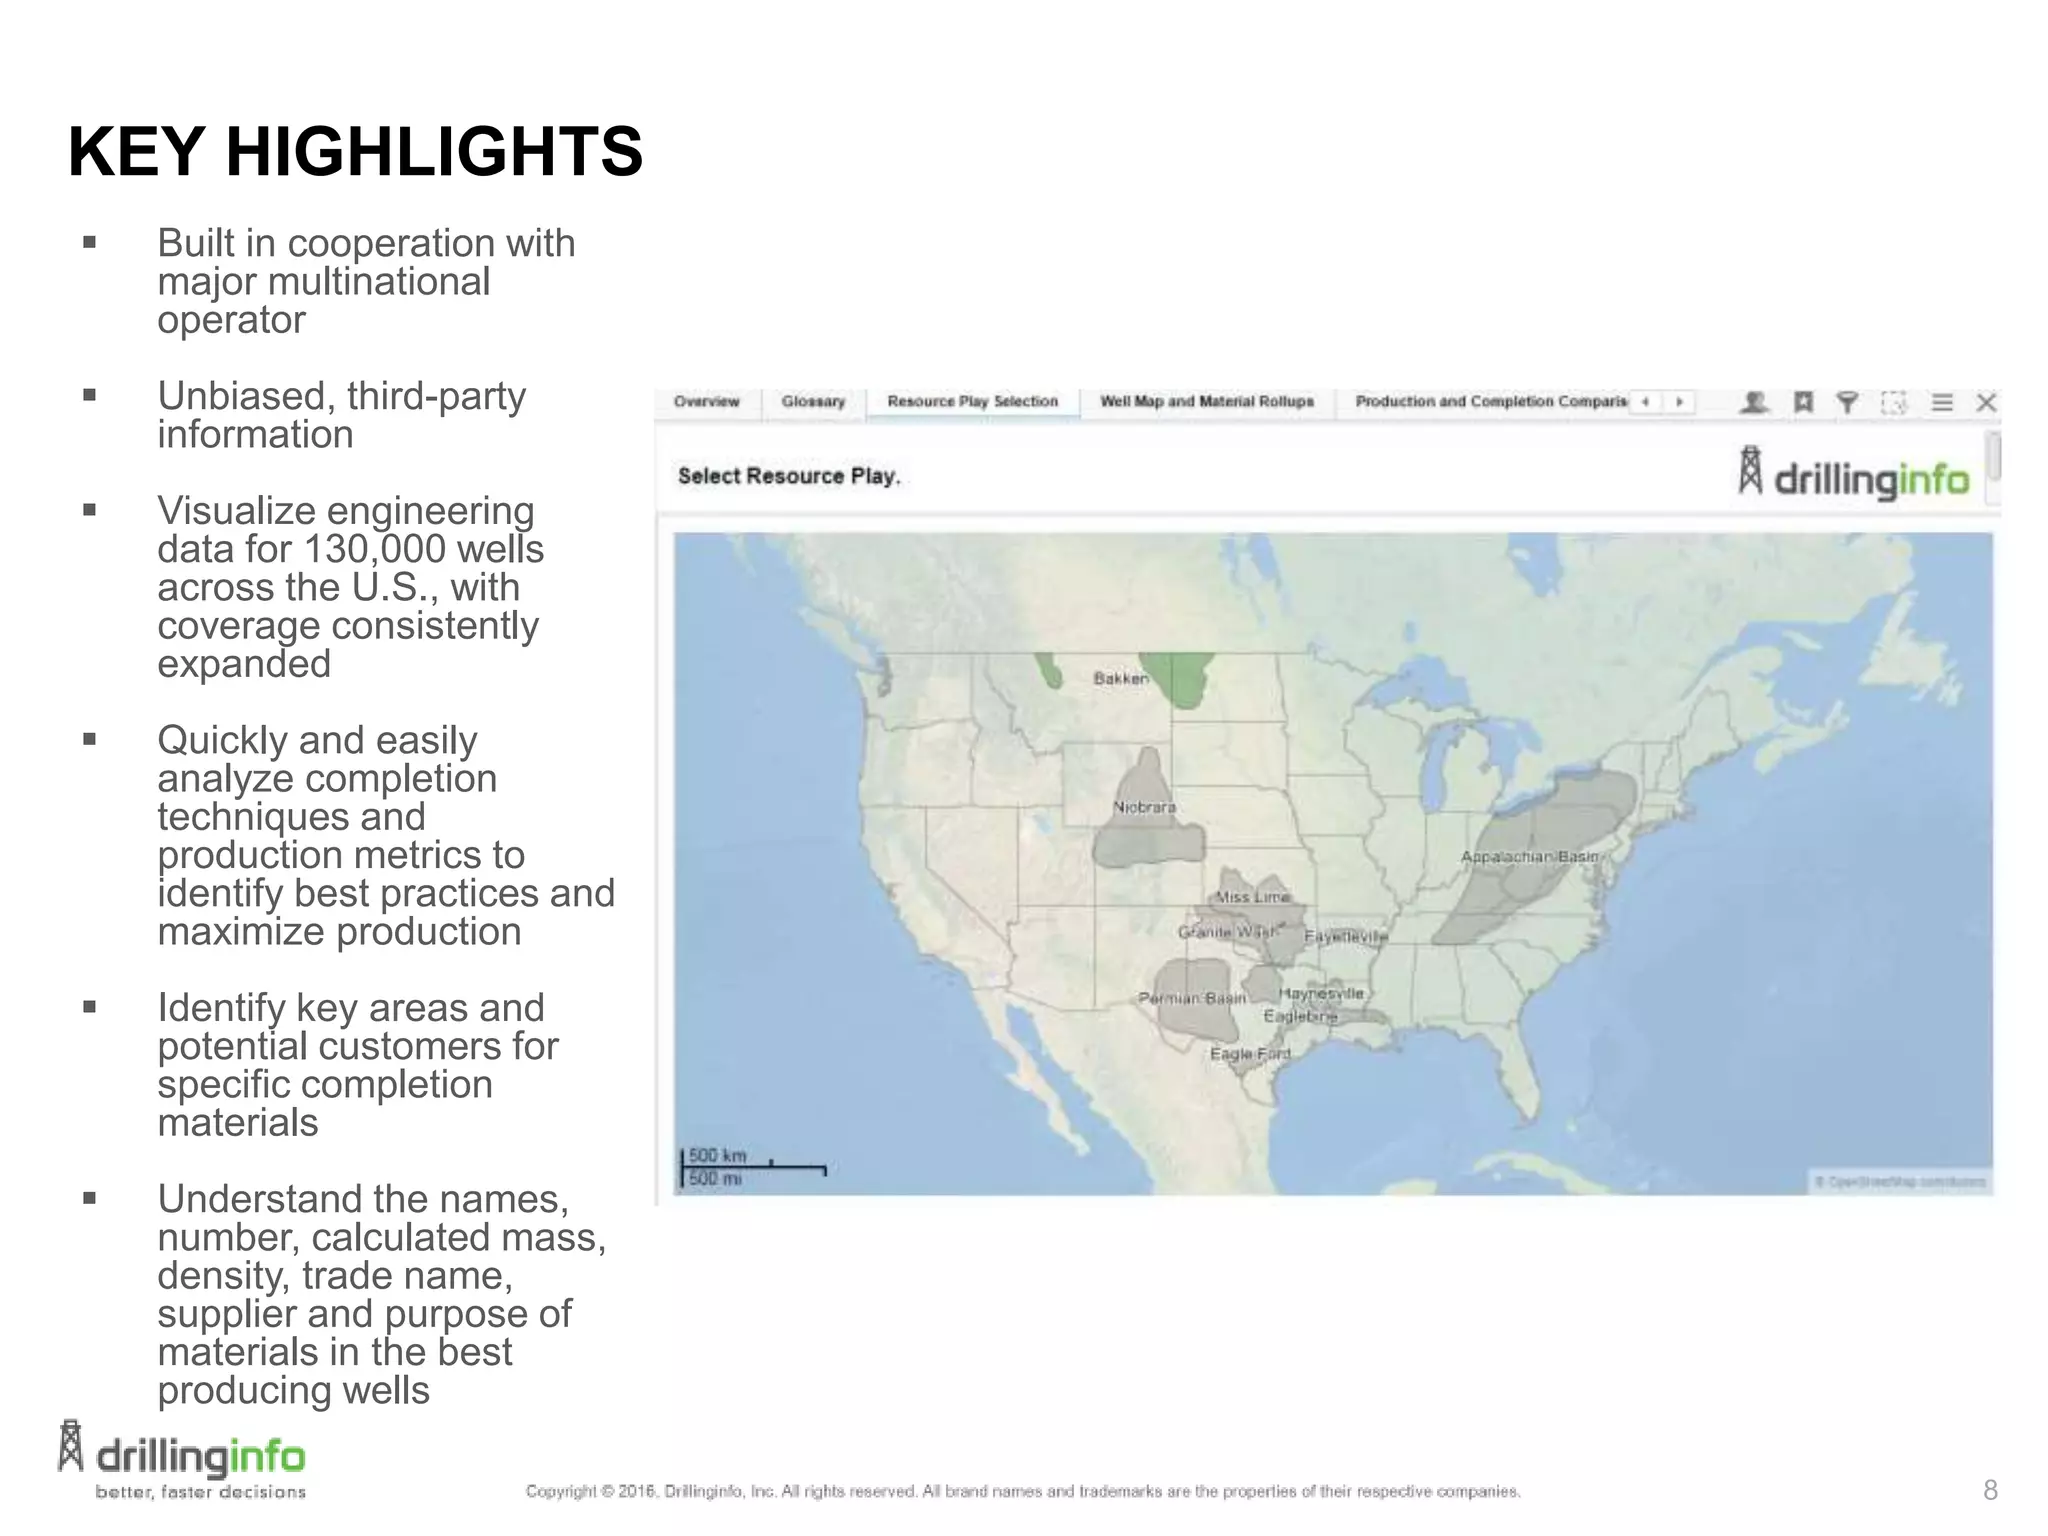

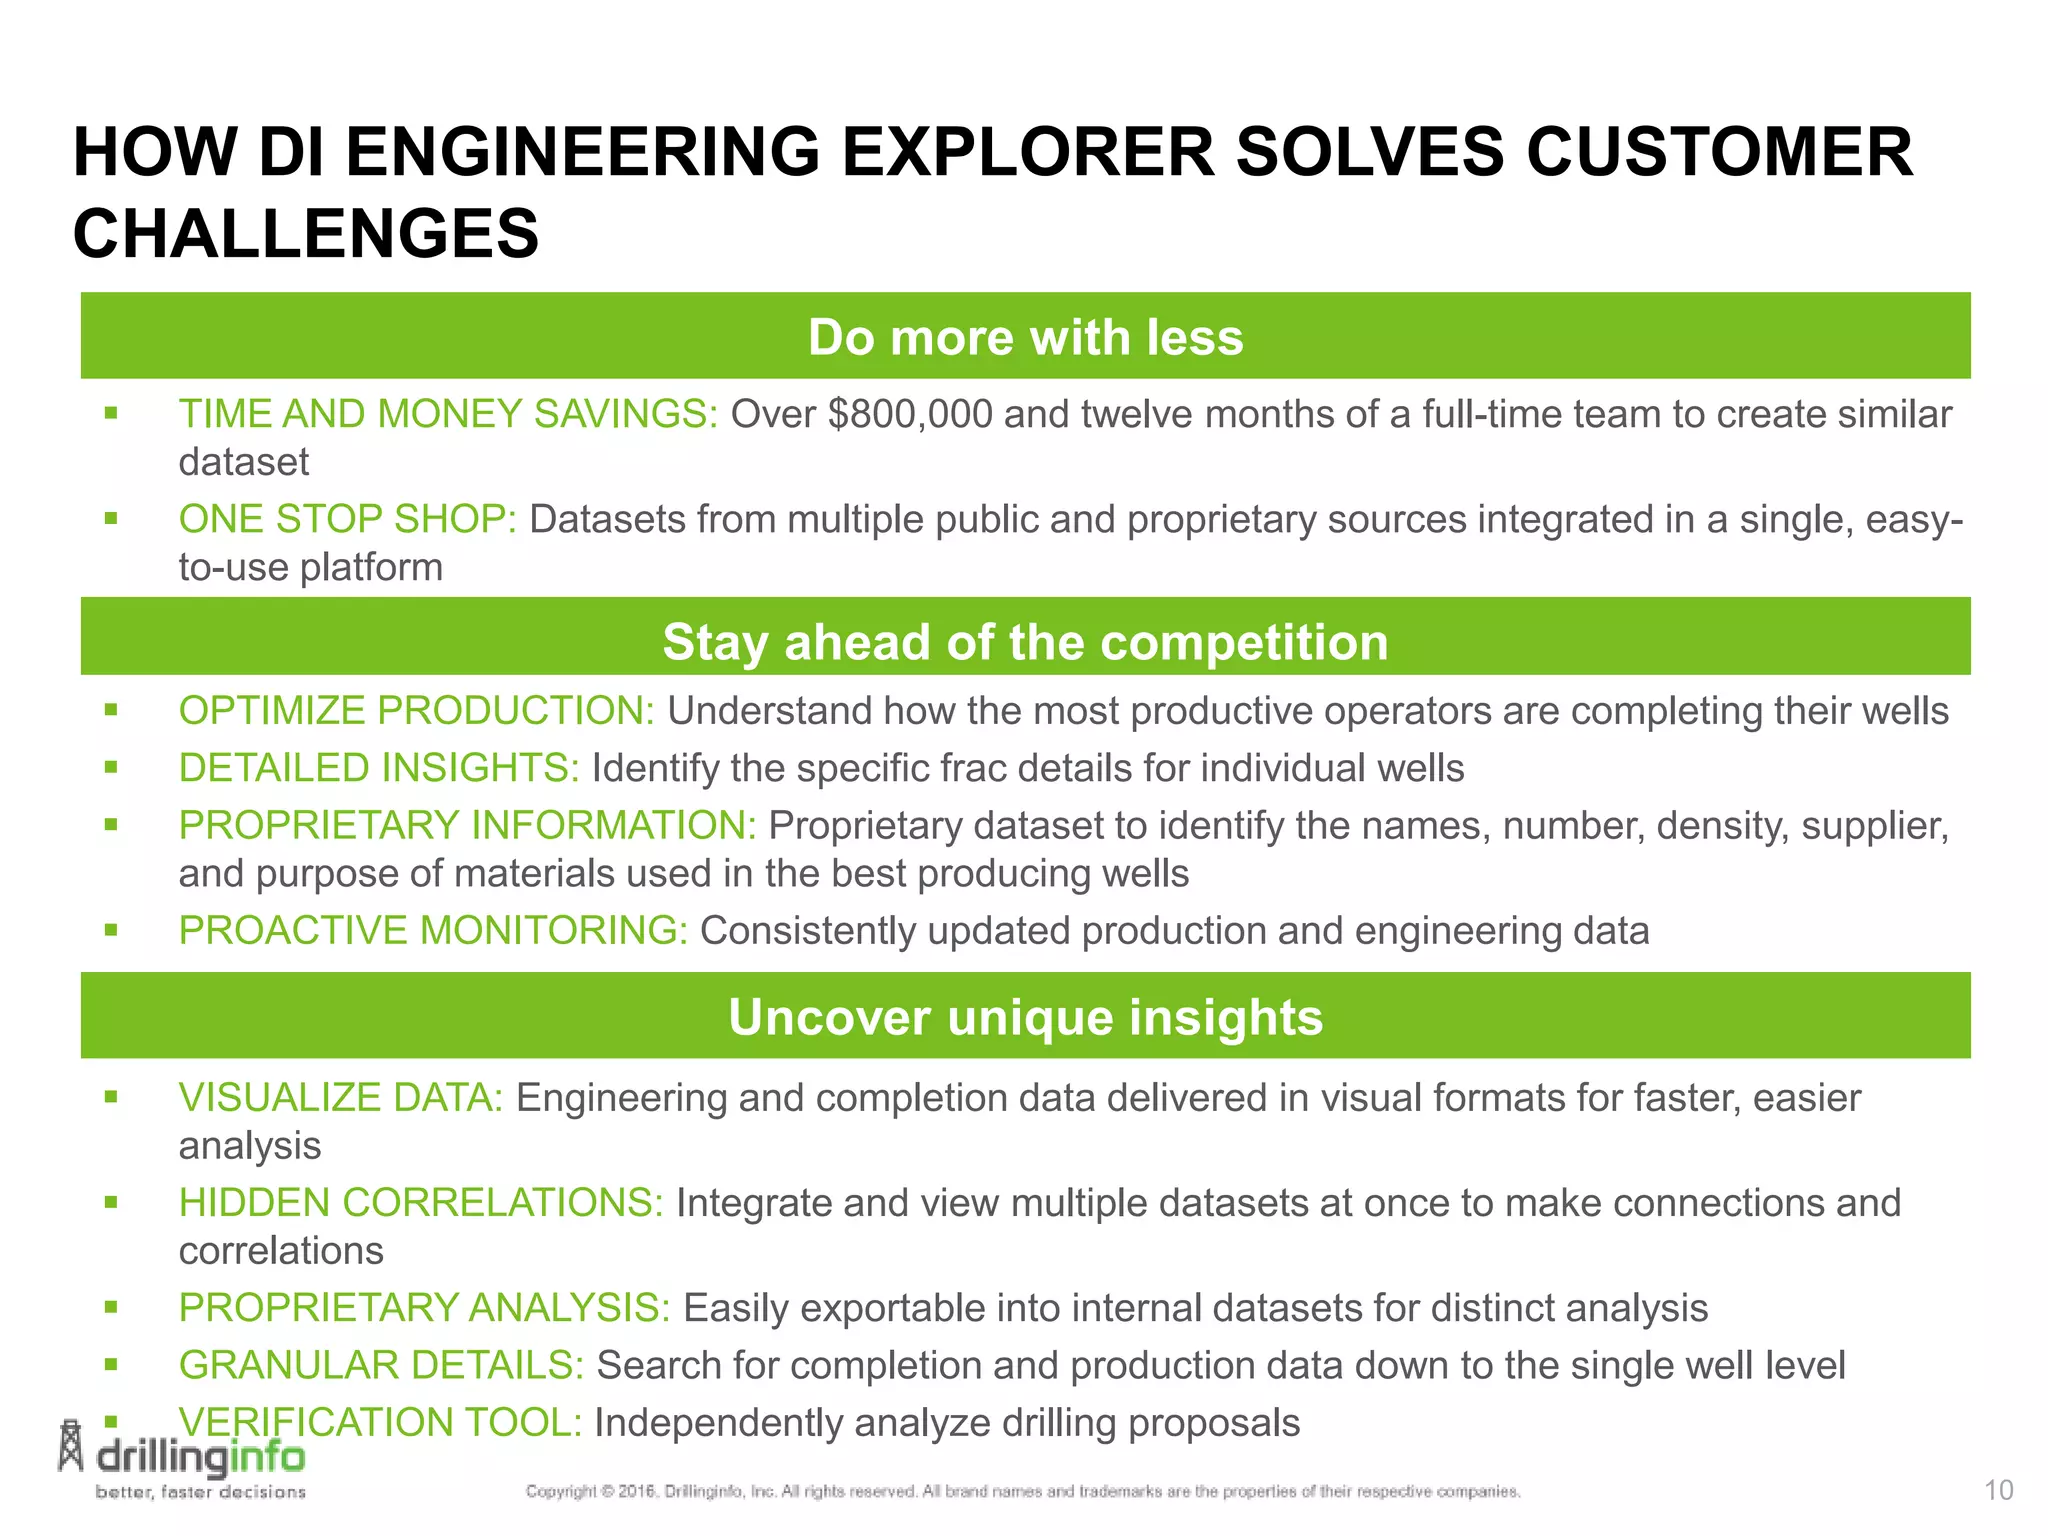
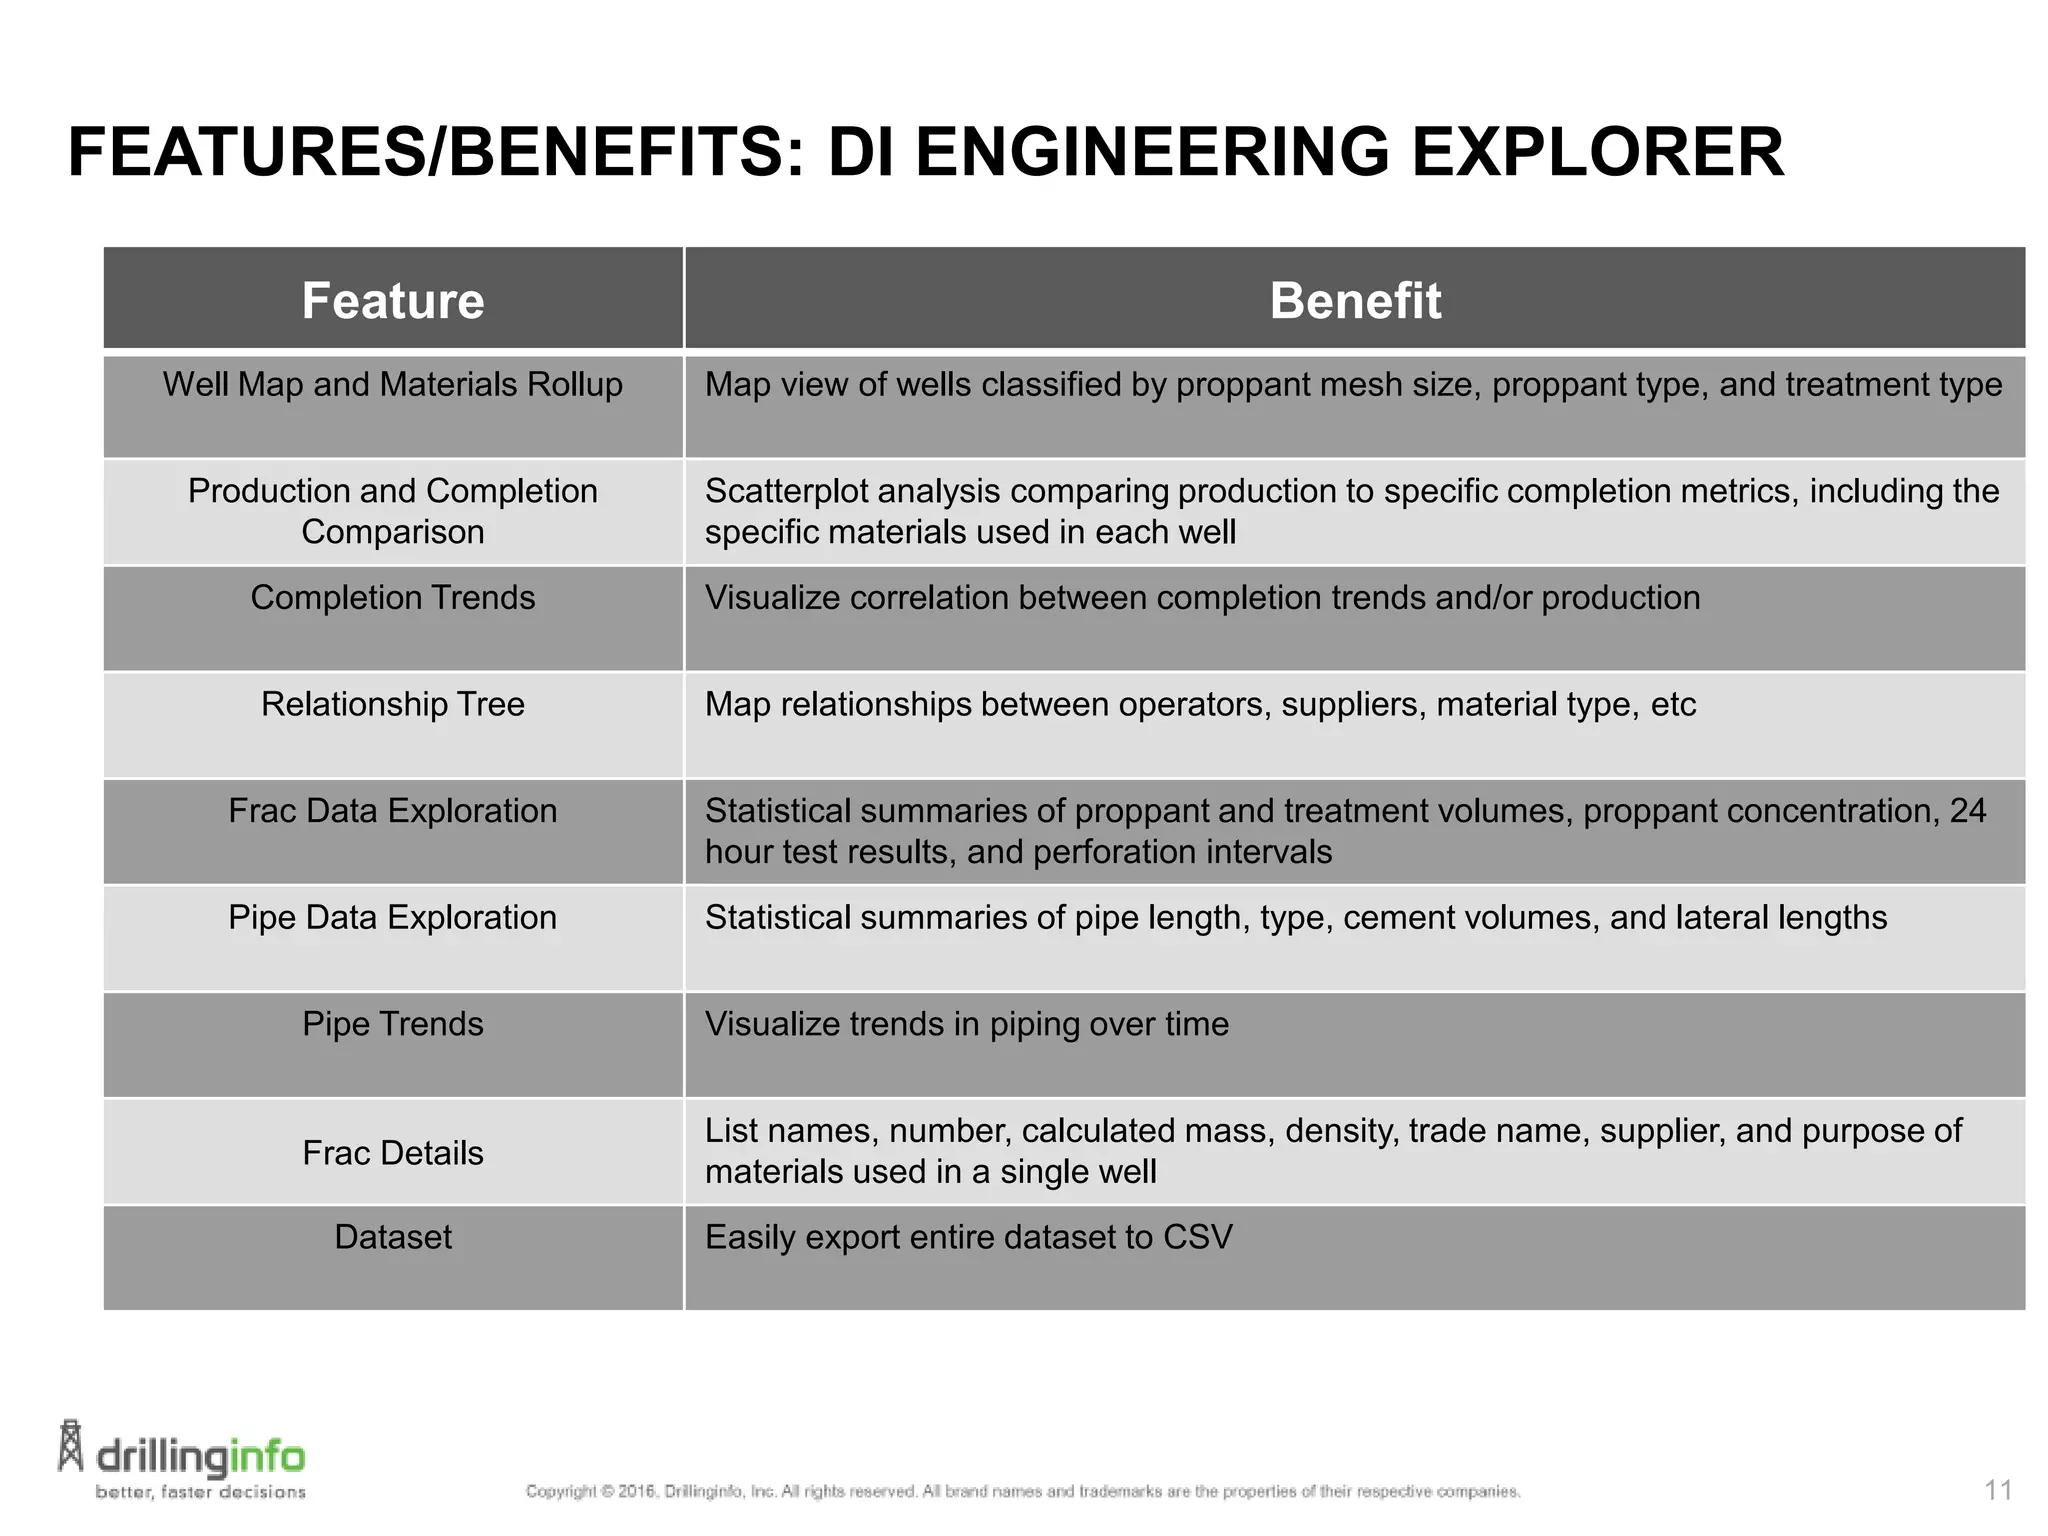


DI Engineering Explorer is a proprietary tool that allows users to visualize completion and production data from over 130,000 wells across 14 states. It saves customers over $800,000 and a year of man-hours by providing well-level analysis and insights. The tool finds correlations between completion techniques and production metrics and identifies the specific materials used in the highest producing wells. It helps users find the most profitable opportunities by understanding what completion strategies are most effective.


![[IJET-V1I2P10] Authors :L. O. Osuman, A. Dosunmu , B .S. Odagme](https://cdn.slidesharecdn.com/ss_thumbnails/ijet-v1i2p10-150506100610-conversion-gate02-thumbnail.jpg?width=640&height=640&fit=bounds)


![Coded Agents – with UiPath SDK + LangGraph [Virtual Hands-on Workshop]](https://cdn.slidesharecdn.com/ss_thumbnails/codedagentsdeck-251215155422-5497c599-thumbnail.jpg?width=640&height=640&fit=bounds)

![Vibe Coding vs. Spec-Driven Development [Free Meetup]](https://cdn.slidesharecdn.com/ss_thumbnails/vibecodingvsspecdrivendevelopment-251209105622-43f455e7-thumbnail.jpg?width=640&height=640&fit=bounds)


