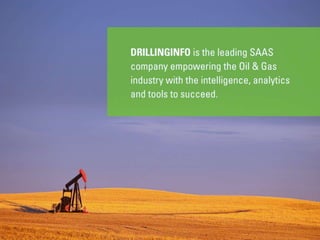
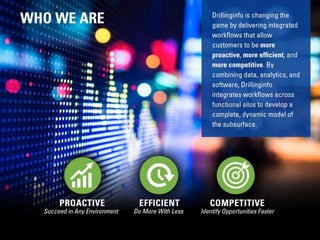
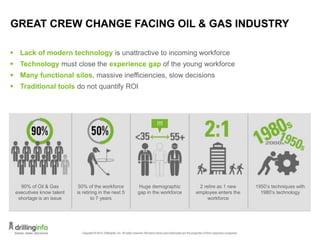
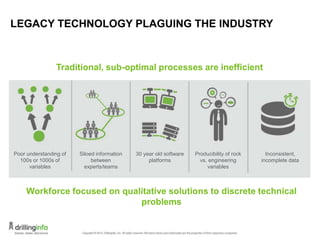
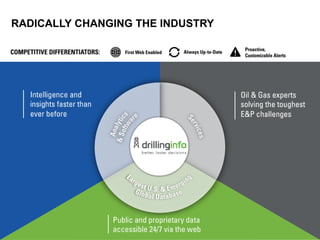
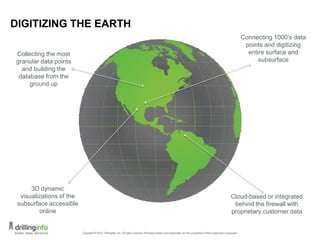
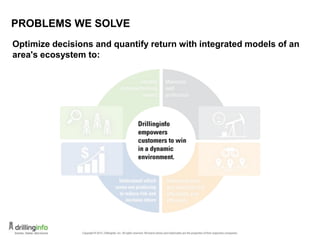
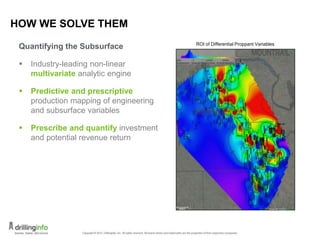
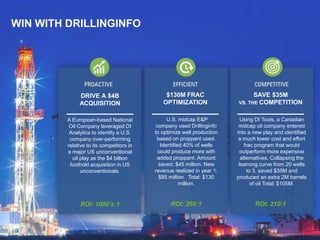
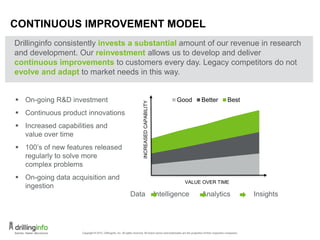
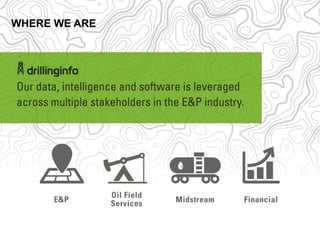
Q4 2015
CORPORATE PRESENTATION
2
INDUSTRY DYNAMICS
GREAT CREW CHANGE FACING OIL & GAS INDUSTRY
 Lack of modern technology is unattractive to incoming workforce
 Technology must close the experience gap of the young workforce
 Many functional silos, massive inefficiencies, slow decisions
 Traditional tools do not quantify ROI
90% of Oil & Gas
executives know talent
shortage is an issue
50% of the workforce
is retiring in the next 5
to 7 years
Huge demographic
gap in the workforce
2 retire as 1 new
employee enters the
workforce
1950’s techniques with
1980’s technology
LEGACY TECHNOLOGY PLAGUING THE INDUSTRY
Poor understanding of
100s or 1000s of
variables
Siloed information
between
experts/teams
30 year old software
platforms
Producibility of rock
vs. engineering
variables
Inconsistent,
incomplete data
Traditional, sub-optimal processes are inefficient
Workforce focused on qualitative solutions to discrete technical
problems
WHY DRILLINGINFO
RADICALLY CHANGING THE INDUSTRY
DIGITIZING THE EARTH
Collecting the most
granular data points
and building the
database from the
ground up
Connecting 1000’s data
points and digitizing
entire surface and
subsurface
3D dynamic
visualizations of the
subsurface accessible
online
Cloud-based or integrated
behind the firewall with
proprietary customer data
PROBLEMS WE SOLVE
Optimize decisions and quantify return with integrated models of an
area's ecosystem to:
HOW WE SOLVE THEM
Quantifying the Subsurface
 Industry-leading non-linear
multivariate analytic engine
 Predictive and prescriptive
production mapping of engineering
and subsurface variables
 Prescribe and quantify investment
and potential revenue return
ROI of Differential Proppant Variables
Using DI Tools, a Canadian
midcap oil company entered
into a new play and identified
a much lower cost and effort
frac program that would
outperform more expensive
alternatives. Collapsing the
learning curve from 20 wells
to 3, saved $35M and
produced an extra 2M barrels
of oil Total: $105M.
SAVE $35M
VS. THE COMPETITION
A European-based National
Oil Company leveraged DI
Analytics to identify a U.S.
company over-performing
relative to its competitors in
a major US unconventional
oil play as the $4 billion
foothold acquisition in US
unconventionals.
DRIVE A $4B
ACQUISITION
U.S. midcap E&P
company used Drillinginfo
to optimize well production
based on proppant used.
Identified 40% of wells
could produce more with
added proppant. Amount
saved: $45 million. New
revenue realized in year 1:
$85 million. Total: $130
million.
$130M FRAC
OPTIMIZATION
WIN WITH DRILLINGINFO
ROI: 1000’s:1 ROI: 260:1 ROI: 210:1
CONTINUOUS IMPROVEMENT MODEL
Data Intelligence Analytics Insights
 On-going R&D investment
 Continuous product innovations
 Increased capabilities and
value over time
 100’s of new features released
regularly to solve more
complex problems
 On-going data acquisition and
ingestion
Good Better Best
INCREASEDCAPABILITY
VALUE OVER TIME
Drillinginfo consistently invests a substantial amount of our revenue in research
and development. Our reinvestment allows us to develop and deliver
continuous improvements to customers every day. Legacy competitors do not
evolve and adapt to market needs in this way.
CUSTOMER BASE
WHERE WE ARE
CUSTOMER PORTFOLIO
E&P RegulatoryFinancial
Serving E&P companies and expanding into adjacent markets
Oilfield
Services
THANK YOU

DI Corporate Presentation

  • 1.
  • 2.
  • 4.
  • 6.
    GREAT CREW CHANGEFACING OIL & GAS INDUSTRY  Lack of modern technology is unattractive to incoming workforce  Technology must close the experience gap of the young workforce  Many functional silos, massive inefficiencies, slow decisions  Traditional tools do not quantify ROI 90% of Oil & Gas executives know talent shortage is an issue 50% of the workforce is retiring in the next 5 to 7 years Huge demographic gap in the workforce 2 retire as 1 new employee enters the workforce 1950’s techniques with 1980’s technology
  • 7.
    LEGACY TECHNOLOGY PLAGUINGTHE INDUSTRY Poor understanding of 100s or 1000s of variables Siloed information between experts/teams 30 year old software platforms Producibility of rock vs. engineering variables Inconsistent, incomplete data Traditional, sub-optimal processes are inefficient Workforce focused on qualitative solutions to discrete technical problems
  • 8.
  • 9.
  • 10.
    DIGITIZING THE EARTH Collectingthe most granular data points and building the database from the ground up Connecting 1000’s data points and digitizing entire surface and subsurface 3D dynamic visualizations of the subsurface accessible online Cloud-based or integrated behind the firewall with proprietary customer data
  • 11.
    PROBLEMS WE SOLVE Optimizedecisions and quantify return with integrated models of an area's ecosystem to:
  • 12.
    HOW WE SOLVETHEM Quantifying the Subsurface  Industry-leading non-linear multivariate analytic engine  Predictive and prescriptive production mapping of engineering and subsurface variables  Prescribe and quantify investment and potential revenue return ROI of Differential Proppant Variables
  • 13.
    Using DI Tools,a Canadian midcap oil company entered into a new play and identified a much lower cost and effort frac program that would outperform more expensive alternatives. Collapsing the learning curve from 20 wells to 3, saved $35M and produced an extra 2M barrels of oil Total: $105M. SAVE $35M VS. THE COMPETITION A European-based National Oil Company leveraged DI Analytics to identify a U.S. company over-performing relative to its competitors in a major US unconventional oil play as the $4 billion foothold acquisition in US unconventionals. DRIVE A $4B ACQUISITION U.S. midcap E&P company used Drillinginfo to optimize well production based on proppant used. Identified 40% of wells could produce more with added proppant. Amount saved: $45 million. New revenue realized in year 1: $85 million. Total: $130 million. $130M FRAC OPTIMIZATION WIN WITH DRILLINGINFO ROI: 1000’s:1 ROI: 260:1 ROI: 210:1
  • 14.
    CONTINUOUS IMPROVEMENT MODEL DataIntelligence Analytics Insights  On-going R&D investment  Continuous product innovations  Increased capabilities and value over time  100’s of new features released regularly to solve more complex problems  On-going data acquisition and ingestion Good Better Best INCREASEDCAPABILITY VALUE OVER TIME Drillinginfo consistently invests a substantial amount of our revenue in research and development. Our reinvestment allows us to develop and deliver continuous improvements to customers every day. Legacy competitors do not evolve and adapt to market needs in this way.
  • 15.
  • 16.
  • 17.
    CUSTOMER PORTFOLIO E&P RegulatoryFinancial ServingE&P companies and expanding into adjacent markets Oilfield Services
  • 18.

Editor's Notes

  • #2 Copyright © 2015, Drillinginfo, Inc. All rights reserved. All brand names and trademarks are the properties of their respective companies.
  • #3 Copyright © 2015, Drillinginfo, Inc. All rights reserved. All brand names and trademarks are the properties of their respective companies.
  • #4 Copyright © 2015, Drillinginfo, Inc. All rights reserved. All brand names and trademarks are the properties of their respective companies.
  • #5 Copyright © 2015, Drillinginfo, Inc. All rights reserved. All brand names and trademarks are the properties of their respective companies.
  • #6 Copyright © 2015, Drillinginfo, Inc. All rights reserved. All brand names and trademarks are the properties of their respective companies.
  • #9 Copyright © 2015, Drillinginfo, Inc. All rights reserved. All brand names and trademarks are the properties of their respective companies.
  • #11 Breakthrough technologies to solving industry problems Immediately implement actionable insights
  • #13 Two MvStats models were created. One with 700 lbs/ft of proppant and another with 400 lbs/ft. This map shows the ROI if we assume (10k laterals, 20 cents/lb of proppant, and $40 overall net revenue per barrel of oil. In some areas, the ROI is positive – over $2MM return in the first year alone. In some areas there is a net loss. Shows the importance of running engineering optimization within a geological framework as differences in rock properties may respond differently to increased proppant. Based on tier 2 Dunn & McKenzie non-linear regression Model This shows the revenue difference between the 700 lbs/ft model and the 400 lbs/ft model Assuming: 10,000 ft laterals $0.20/lb of proppant $40/bbl return for oil
  • #14 Copyright © 2015, Drillinginfo, Inc. All rights reserved. All brand names and trademarks are the properties of their respective companies.
  • #16 Copyright © 2015, Drillinginfo, Inc. All rights reserved. All brand names and trademarks are the properties of their respective companies.
  • #17 Copyright © 2015, Drillinginfo, Inc. All rights reserved. All brand names and trademarks are the properties of their respective companies. Downstream? Data-powered SAAS "Cognitive computing" Multiple stakeholders in the E&P Industry Unstructured to highly structured meta data and data created by the experts to optimize drilling See patterns, complete a well Deterministic predictions, rapidly experimenting
  • #19 Copyright © 2015, Drillinginfo, Inc. All rights reserved. All brand names and trademarks are the properties of their respective companies.