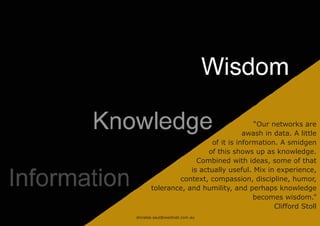
“Our networks are
                                     awash in data. A little
                          of it is information. A smidgen
                         of this shows up as knowledge.
                     Combined with ideas, some of that
                   is actually useful. Mix in experience,
               context, compassion, discipline, humor,
       tolerance, and humility, and perhaps knowledge
                                        becomes wisdom.”
                                              Clifford Stoll
shiralee.saul@westnet.com.au
When Al Gore rode a scissor crane up to the top of the CO2 emissions
graph in the film An Inconvenient Truth, he became a superstar of visual
communications. He compellingly used graphs to tell the story of global
warming, which helped public opinion in America to finally reach the tipping
point.
                           shiralee.saul@westnet.com.au
data vizualisation
The goal of visualization is to aid our understanding
of data by leveraging the human visual system’s
highly-tuned ability to see patterns, spot trends, and
identify outliers.


Well-designed visual representations can replace
cognitive calculations with simple perceptual
inferences and improve comprehension, memory,
and decision making.


By making data more accessible and appealing,
visual representations may also help engage more
diverse audiences in exploration and analysis.


The challenge is to create effective and engaging
visualizations that are appropriate to the data.

                             shiralee.saul@westnet.com.au
Modern data graphics can do much
           more than simply substitute for small
           statistical tables. At their best, graphics
           are instruments for reasoning about
           quantitative information. Often the most
           effective way to describe, explore, and
           summarize a set of numbers -- even a very
           large set -- is to look at pictures of those
           numbers. Furthermore, of all methods for
           analyzing and communicating statistical
           information, well-designed data graphics
           are usually the simplest and at the same
           time the most powerful.
           The Visual Display of Quantitative
           Information, Edward R. Tufte, Graphics
           Press: Cheshire, CT 1983, Introduction


shiralee.saul@westnet.com.au
Edward Tufte:
The Visual Display of
Quantitative Information
Graphical Displays Should :
    • show the data.
    • tell the truth.
    • help the viewer think about
      the information rather than
      the design.
    • encourage the eye to
      compare the data.
    • make large data sets
      coherent.


http://www.edwardtufte.com/tufte/
                               shiralee.saul@westnet.com.au
shiralee.saul@westnet.com.au
Why should we be interested in visualization? Because
the human visual system is a pattern seeker of enormous
power and subtlety. The eye and the visual cortex of the
brain form a massively parallel processor that provides the
highest-bandwidth channel into human cognitive centers.
At higher levels of processing, perception and cognition
are closely interelated, which is the reason why the words
‘understanding’ and ‘seeing’ are synonymous.

However, the visual system has its own rules. We can easily
see patterns presented in certain ways, but if they are
presented in other ways, they become invisible... If we can
understand how perception works, our knowledge can be
translated into rules for displaying information. Following
perception-based rules, we can present our data in such a
way that the important and informative patterns stand out.
If we disobey the rules, our data will be incomprehensible or
misleading.

Information Visualization, Second Edition, Colin Ware, Morgan
Kaufmann Publishers, 2004, page xxi

                       shiralee.saul@westnet.com.au
Good data visualisations bring pattern,
trends and exceptions to light.


                 shiralee.saul@westnet.com.au
shiralee.saul@westnet.com.au
Graph Design IQ Test
http://www.perceptualedge.com/files/GraphDesignIQ.html


               shiralee.saul@westnet.com.au

Introduction to Data Visualisation

  • 1.
    “Our networks are awash in data. A little of it is information. A smidgen of this shows up as knowledge. Combined with ideas, some of that is actually useful. Mix in experience, context, compassion, discipline, humor, tolerance, and humility, and perhaps knowledge becomes wisdom.” Clifford Stoll shiralee.saul@westnet.com.au
  • 2.
    When Al Gorerode a scissor crane up to the top of the CO2 emissions graph in the film An Inconvenient Truth, he became a superstar of visual communications. He compellingly used graphs to tell the story of global warming, which helped public opinion in America to finally reach the tipping point. shiralee.saul@westnet.com.au
  • 3.
    data vizualisation The goalof visualization is to aid our understanding of data by leveraging the human visual system’s highly-tuned ability to see patterns, spot trends, and identify outliers. Well-designed visual representations can replace cognitive calculations with simple perceptual inferences and improve comprehension, memory, and decision making. By making data more accessible and appealing, visual representations may also help engage more diverse audiences in exploration and analysis. The challenge is to create effective and engaging visualizations that are appropriate to the data. shiralee.saul@westnet.com.au
  • 4.
    Modern data graphicscan do much more than simply substitute for small statistical tables. At their best, graphics are instruments for reasoning about quantitative information. Often the most effective way to describe, explore, and summarize a set of numbers -- even a very large set -- is to look at pictures of those numbers. Furthermore, of all methods for analyzing and communicating statistical information, well-designed data graphics are usually the simplest and at the same time the most powerful. The Visual Display of Quantitative Information, Edward R. Tufte, Graphics Press: Cheshire, CT 1983, Introduction shiralee.saul@westnet.com.au
  • 5.
    Edward Tufte: The VisualDisplay of Quantitative Information Graphical Displays Should : • show the data. • tell the truth. • help the viewer think about the information rather than the design. • encourage the eye to compare the data. • make large data sets coherent. http://www.edwardtufte.com/tufte/ shiralee.saul@westnet.com.au
  • 6.
  • 7.
    Why should webe interested in visualization? Because the human visual system is a pattern seeker of enormous power and subtlety. The eye and the visual cortex of the brain form a massively parallel processor that provides the highest-bandwidth channel into human cognitive centers. At higher levels of processing, perception and cognition are closely interelated, which is the reason why the words ‘understanding’ and ‘seeing’ are synonymous. However, the visual system has its own rules. We can easily see patterns presented in certain ways, but if they are presented in other ways, they become invisible... If we can understand how perception works, our knowledge can be translated into rules for displaying information. Following perception-based rules, we can present our data in such a way that the important and informative patterns stand out. If we disobey the rules, our data will be incomprehensible or misleading. Information Visualization, Second Edition, Colin Ware, Morgan Kaufmann Publishers, 2004, page xxi shiralee.saul@westnet.com.au
  • 8.
    Good data visualisationsbring pattern, trends and exceptions to light. shiralee.saul@westnet.com.au
  • 9.
  • 10.
  • 11.
    Graph Design IQTest http://www.perceptualedge.com/files/GraphDesignIQ.html shiralee.saul@westnet.com.au