Data Science
IT3ED07 (3-0-0)
2
Course Learning Objectives (CLOs)
CLO01 To Understand the importance of Data Science in real world
CLO02 To learn the importance of Probability and statistic in Data Science
CLO03 To Learn Why we analysis of Data before applied Data Science Process
CLO04 To Learn the importance of Data Visualization in Real world and Data Science
CLO05 To Learn the Importance of Python as a Data Science Tool
3
Syllabus
Unit-I:
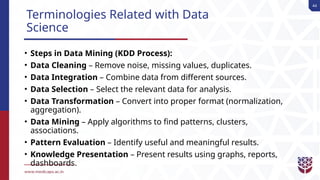
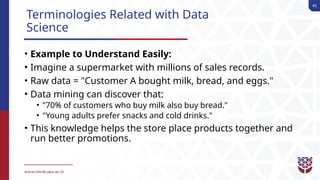
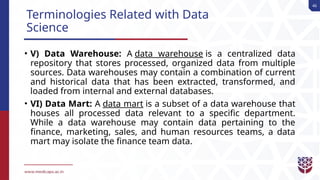
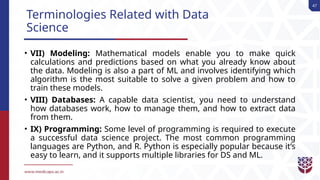
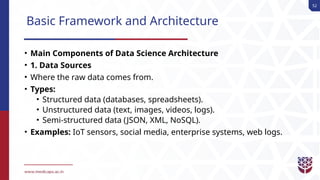
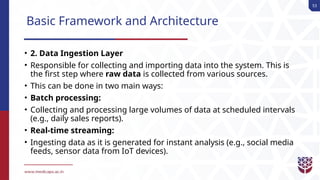
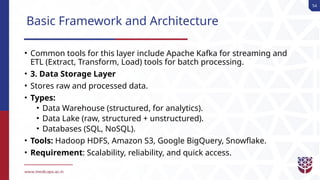
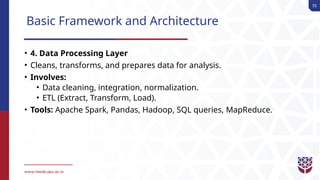
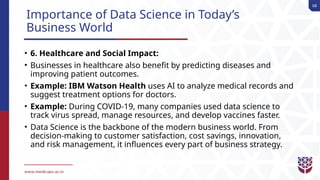
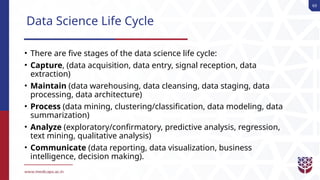
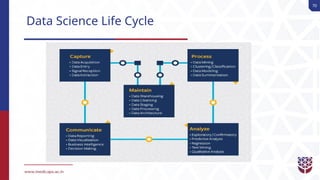
Introduction to Data Science, Definition and Description of Data
Science, History and Development of Data Science, Terminologies
Related with Data Science, Basic Framework and Architecture,
Importance of Data Science in Today’s Business World, Primary
Components of Data Science, Users of Data Science and its Hierarchy,
Overview of Different Data Science Techniques.
4
Syllabus
Unit-II
Sample Spaces, Events, Conditional Probability and Independence.
Random Variables. Discrete and Continuous Random Variables,
Densities and Distributions, Normal Distribution and its Properties,
Introduction to Markov Chains, Random Walks, Descriptive, Predictive
and Prescriptive Statistics, Statistical Inference, Populations and
Samples, Statistical Modeling
5
Syllabus
Unit-III
Exploratory Data Analysis and the Data Science Process - Basic Tools
(Plots, Graphs and Summary Statistics) of EDA - Philosophy of EDA - The
Data Science Process - Case Study
Unit-IV
Data Visualization: Basic Principles, Ideas and Tools for Data
Visualization, Examples of Inspiring (Industry) Projects, Exercise: Create
Your Own Visualization of a Complex Dataset
6
Syllabus
Unit-V
NoSQL, Use of Python as a Data Science Tool, Python Libraries: SciPy
and sci-kitLearn, PyBrain, Pylearn, Matplotlib, Challenges and Scope of
Data Science Project Management.
7
Text Books
1. Joel Grus, Data Science from Scratch: First Principles with
Python,O’RIELLY
2. Sinan Ozdemir, Principles of Data Science, PACKT.
3. Joke Vanderplas, Python Data Science Hand Book, O’Reilly
Publication.
8
Reference Books
1. Lillian Pierson, Data Science for Dummies,WILEY
2. Foster Provost, Tom Fawcett, Data Science for Business: What You
Need to Know about Data Mining and Data-Analytic Thinking
3. Field Cady The Data Science Hand Book, Wiley Publication
9
Course Outcomes (COs)
After completion of this course the students shall be able to:
CO01 Students will able to learn importance of Data Scientist and Data Science
Technique
CO02 Students will able to learn Probability and Statistical Modeling
CO03 Students will able to learn Exploratory Data Analysis in Data Science
CO04 Student will able to learn Data Visualization of Data with example of Inspiring
Industry Projects
CO05 Students will apply data science concepts and methods to solve problems in real-
world contexts and will communicate these solutions effectively with the help of
Python as a Data Science tool
10
What is Data Science?
Data Science is a combination of multiple disciplines that uses
statistics, data analysis, and machine learning to analyze data and to
extract knowledge and insights from it.
Data Science is also known as data-driven science.
Data Science uses the most advanced hardware, programming
systems, and algorithms to solve problems that have to do with data.
Data Science is about data gathering, analysis and decision-making.
Data Science is about finding patterns in data, through analysis, and
make future predictions.
11
What is Data Science?
12
What is Data Science?
• By using Data Science, companies are able to make:
• Better decisions (should we choose A or B)
• Predictive analysis (what will happen next?)
• Pattern discoveries (find pattern, or maybe hidden information in the
data)
13
Where is Data Science Needed?
• Data Science is used in many industries in the world today, e.g.
banking, consultancy, healthcare, and manufacturing.
• Examples of where Data Science is needed:
• For route planning: To discover the best routes
• To create promotional offers
• To find the best suited time to deliver goods
• To forecast the next years revenue for a company
• To analyze health benefit of training
• To predict who will win elections
14
Where is Data Science Needed?
• Data Science can be applied in nearly every part of a business where
data is available.
Examples are:
• Consumer goods
• Stock markets
• Industry
• Politics
• Logistic companies
• E-commerce
15
Where is Data Science Needed?
• Data Science can be applied in nearly every part of a business where
data is available.
Examples are:
• Consumer goods
• Stock markets
• Industry
• Politics
• Logistic companies
• E-commerce
What is Data?
• Data is collection of unprocessed items that may consists of
text, numbers, images and video.
• One purpose of Data Science is to structure data, making it
interpretable and easy to work with.
• Today, data can be represented in various forms like sound,
images and video.
Structured: numbers, text etc.
Unstructured: images, video etc.
What is Data?
• Unstructured Data: Unstructured data is not organized. We
must organize the data for analysis purposes.
What is Data?
• Structured Data: Structured data is organized and easier to
work with.
What is Information?
• Meaningful data is called information.
• Information refers to the data that have been processed in
such a way that the knowledge of the person who uses the
data is increased.
• Example:- 1A$ - Data (No meaning)
1$ - Information (Currency)
• For the decision to be meaningful, the processed data must
qualify for the following characteristics −
• Timely Information should be available when required.
−
• Accuracy Information should be accurate.
−
• Completeness Information should be complete.
−
What is Metadata?
• Metadata describes other data.
• Data about data,
• For example - an image may include metadata that describes
how large the picture is, the color depth, the image resolution,
when the image was created, and other data.
• A text document's metadata may contain information about
how long the document is, who the author is, when the
document was written, and a short summary of the
document.
1) Operational Metadata
2) Extraction and Transformation Metadata
3) End User Metadata
What is Database and DBMS?
• Database is a collection of inter-related data which helps in
efficient retrieval, insertion and deletion of data from
database and organizes the data in the form of tables.
• The software which is used to manage database is called
Database Management System (DBMS).
• A database management system stores data in such a way
that it becomes easier to retrieve, manipulate, and produce
information.
• For Example, MySQL, Oracle etc. are popular commercial
DBMS used in different applications.
22
Introduction to Data Science
• Commonly referred to as the “oil of the 21st century,” our digital data
carries the most importance in the field.
• It has incalculable benefits in business, research and our everyday
lives.
• Your route to work, your most recent Google search for the nearest
coffee shop, your Instagram post about what you ate, and even the
health data from your fitness tracker are all important to different
data scientists in different ways.
• Sifting through massive lakes of data, looking for connections and
patterns, data science is responsible for bringing us new products,
delivering breakthrough insights and making our lives more
convenient.
23
Definition Data Science
• Data science is a field that uses scientific methods, processes,
algorithms, and systems to extract knowledge and insights from
structured and unstructured data.
• For example, when you visit an e-commerce site and look at a few
categories and products before making a purchase, you are creating
data.
• It involves different disciplines like mathematical and statistical
modelling, extracting data from its source and applying data
visualization techniques. hat Analysts can use to figure out how you
make purchases.
24
Description of Data Science
• Interdisciplinary nature: Combines statistics, computer science,
mathematics, and domain knowledge.
• Goal: To understand data, find patterns, and make data-driven
decisions.
• Process: Involves collecting, cleaning, analyzing, visualizing, and
modeling data.
• Scope: Used in almost every industry — finance, healthcare, retail,
manufacturing, education, entertainment, and technology.
• Output: Actionable insights, predictions, and automation that support
better decision-making.
25
Why is Data Science Important ?
• “By 2025, global data generation is projected to hit 175 zettabytes—
that's 175 trillion gigabytes. If the current exponential growth
continues, by 2030 we could be generating over 200 zettabytes
annually.
• The volume of data continues to grow exponentially, creating vast
opportunities and challenges in the field of Data Science.
• Simple data analysis can handle information from a single source or a
limited dataset. However, with today’s massive and diverse datasets,
advanced Data Science tools are essential for making sense of big
data collected from multiple sources.
• Data Science enables businesses to process both structured and
unstructured data to uncover meaningful patterns and insights.
26
Examples of Data Science
• Examples:
• Netflix, YouTube, and Spotify use Data Science for recommendation
systems (suggesting movies, videos, or songs).
• Social media platforms (Instagram, Snapchat) analyze your activity to
show you personalized content.
• Fraud detection: Banks flag suspicious transactions in real time.
• Credit scoring: Loan approval decisions are made using Data Science
models.
• Stock market predictions and algorithmic trading.
• Predicting diseases (like diabetes or heart problems) based on
patient records.
27
History of Data Science
• In its early days in the 60s, the term data science was often used as an
alternative to computer science.
• It was probably used for the first time by Peter Naur in 1960 and later
published by him in 1974 in Concise Survey of Computer Methods.
• However, it was used for the first time officially at the Kobe Conference
in 1996 of the International Federation of Classification Societies,
where it was actually used to define the event itself.
28
History of Data Science
• 1960s–1970s: Foundations
• 1962 – John W. Tukey introduced the term “data analysis” in his paper
The Future of Data Analysis, emphasizing exploration beyond classical
statistics.
• 1974 – Peter Naur used the term “Data Science” in his book Concise
Survey of Computer Methods.
• 1980s–1990s: Growth of Computing & Databases
• 1989 – The term “Knowledge Discovery in Databases (KDD)” was
introduced, focusing on extracting patterns from large datasets.
• 1990s – Rapid rise of databases, data warehouses, and statistical
computing (SAS, SPSS, R).
29
History of Data Science
• 2000s: Data Science Emerges
• 2001 – William S. Cleveland formally proposed Data Science as an
independent discipline, combining statistics, computer science, and
domain expertise.
• The explosion of internet data, search engines, and social media
created demand for handling massive information.
• 2010s: Big Data & Machine Learning Era
• 2010 – The term “Big Data” gained popularity as global data volume
surged.
• Development of Hadoop, Spark, TensorFlow enabled large-scale data
processing.
30
History of Data Science
• 2012 – Harvard Business Review called “Data Scientist: The Sexiest Job of
the 21st Century.”
• AI & ML began powering recommendations, fraud detection,
autonomous systems.
• 2020s & Beyond: AI-Driven Data Science
• Integration of Deep Learning, Generative AI, and Cloud Computing.
• Data Science + AI driving self-driving cars, personalized medicine,
and smart assistants.
• By 2030, global datasphere projected to surpass 200 zettabytes,
making Data Science even more critical.
31
Terminologies Related with Data
Science
• Data science terminology refers to the specific vocabulary and
concepts used within the field of data science to describe its
techniques, tools, and processes.
32
Terminologies Related with Data
Science
• Core Concepts
• Data: Raw facts and figures collected from different sources. Data can
be numbers, text, images, audio, or video. For example: student marks
in a class, tweets on Twitter(X), MRI scan images. It can be qualitative
(descriptive) or quantitative (numerical).
• Dataset: A collection of related data or A collection of data points
organized in a structured or unstructured format. Example: An Excel
sheet with rows (students) and columns (attributes like name, marks,
class).
• Data Analysis: The process of cleaning, transforming, and modeling
data to discover useful information and support decision-making.
33
Terminologies Related with Data
Science
• I) Big Data: Extremely large and complex datasets that traditional
data processing applications are unable to handle.
• Big data is a large collection of data characterized by the four V’s:
volume, velocity, variety and veracity.
• Volume refers to the amount of data—big data deals with high
volumes of data.
• Velocity refers to the rate at which data is collected—big data is
collected at a high velocity and often streams directly into memory.
34
Terminologies Related with Data
Science
35
Terminologies Related with Data
Science
• Variety refers to the range of data formats—big data tends to have a
high variety of structured, semi-structured, and unstructured data, as
well as a variety of formats such as numbers, text strings, images, and
audio.
• Veracity: Veracity deals with the authenticity of the data being
captured, whether it is trustworthy and bias free.
• Due to the speed, volume, and variety of data generated, the
authenticity of such data becomes a huge challenge.
36
Terminologies Related with Data
Science
• II) Data Types and Structures
• Structured Data: Data that is highly organized and follows a clear
format, like data in a relational database or an Excel spreadsheet.
Example: Student marks in a table.
• Unstructured Data: Data that doesn't have a predefined format or
organization. Examples include text, images, audio, and video files.
• Semi-structured Data: Partially organized, uses tags or hierarchy.
Example: JSON, XML.
• Metadata: Data about data. For instance, the creation date and
author of a document are metadata.
37
Terminologies Related with Data
Science
• Based on Nature:
• Categorical Data (Qualitative): Describes qualities or categories.
Example: Gender (Male/Female), City (Delhi, Mumbai).
• Numerical Data (Quantitative): Represents numbers.
• Discrete Data: Countable (Number of students in a class).
• Continuous Data: Measurable (Height, weight).
38
Terminologies Related with Data
Science
• III) Machine Learning
• Machine learning is the backbone of data science.
• Data Scientists need to have a solid grasp on ML in addition to basic
knowledge of statistics.
• Machine learning (ML) is a subset of Al.
• It refers to the modeling techniques where the model learns on its
own without human intervention.
• Once the model is built, it has the capability of learning from the past
data.
• This gives the model the required competency to process the new
data independently, that is, the machine learns from the data.
39
Terminologies Related with Data
Science
• In simple words, ML teaches the systems to think and understand like
humans by learning from the data.
• Instead of receiving direct instructions, ML models learn patterns
from large datasets, allowing them to make predictions,
classifications, and decisions on new, unseen data.
• 1. Supervised Machine Learning: In supervised learning, the model
is trained using labeled data (data with both input and output).
• The algorithm learns the mapping between input (features) and
output (target/label).
40
Terminologies Related with Data
Science
• Goal:
Predict outcomes for new, unseen data.
• Real-life Examples:
• Email Spam Detection
Input: Email text Output:
→ "Spam" or "Not Spam"
• House Price Prediction
Input: Size, location, rooms Output:
→ House price
• Medical Diagnosis
Input: Patient data Output:
→ Disease/No disease
• Voice Assistants
Input: Audio command Output:
→ Action (“Play music”)
41
Terminologies Related with Data
Science
• 2. Unsupervised Machine Learning:
• In unsupervised learning, the model is trained using unlabeled data
(no predefined output).
• The algorithm tries to find patterns, clusters, or structure within the
data.
• Goal:
• Discover hidden relationships or groupings in the data.
• Real-life Examples:
• Customer Segmentation: Input: Purchase history Output:
→ Groups
of customers with similar buying behavior
42
Terminologies Related with Data
Science
• Market Basket Analysis
Input: Shopping data Output: “People who buy bread also buy
→
butter”
• Social Media Friend Suggestions
Input: User connections Output: Suggested friends based on
→
network clustering
• Anomaly Detection in Banking
Input: Transactions Output: Flag unusual transactions (possible
→
fraud)
43
Terminologies Related with Data
Science
• IV) Data Mining: Data Mining is the process of extracting useful
patterns, knowledge, and insights from large sets of data.
• It is sometimes called Knowledge Discovery in Databases (KDD).
• Data mining uses techniques from statistics, machine learning, and
database systems to find hidden patterns that are not immediately
obvious.
• We live in a world where huge amounts of data are generated every
second (business transactions, social media, medical records, sensor
data, etc.).
• Simply storing data is not useful—we need to analyze it to make
decisions.
44
Terminologies Related with Data
Science
• Steps in Data Mining (KDD Process):
• Data Cleaning – Remove noise, missing values, duplicates.
• Data Integration – Combine data from different sources.
• Data Selection – Select the relevant data for analysis.
• Data Transformation – Convert into proper format (normalization,
aggregation).
• Data Mining – Apply algorithms to find patterns, clusters,
associations.
• Pattern Evaluation – Identify useful and meaningful results.
• Knowledge Presentation – Present results using graphs, reports,
dashboards.
45
Terminologies Related with Data
Science
• Example to Understand Easily:
• Imagine a supermarket with millions of sales records.
• Raw data = "Customer A bought milk, bread, and eggs."
• Data mining can discover that:
• "70% of customers who buy milk also buy bread."
• "Young adults prefer snacks and cold drinks."
• This knowledge helps the store place products together and
run better promotions.
46
Terminologies Related with Data
Science
• V) Data Warehouse: A data warehouse is a centralized data
repository that stores processed, organized data from multiple
sources. Data warehouses may contain a combination of current
and historical data that has been extracted, transformed, and
loaded from internal and external databases.
• VI) Data Mart: A data mart is a subset of a data warehouse that
houses all processed data relevant to a specific department.
While a data warehouse may contain data pertaining to the
finance, marketing, sales, and human resources teams, a data
mart may isolate the finance team data.
47
Terminologies Related with Data
Science
• VII) Modeling: Mathematical models enable you to make quick
calculations and predictions based on what you already know about
the data. Modeling is also a part of ML and involves identifying which
algorithm is the most suitable to solve a given problem and how to
train these models.
• VIII) Databases: A capable data scientist, you need to understand
how databases work, how to manage them, and how to extract data
from them.
• IX) Programming: Some level of programming is required to execute
a successful data science project. The most common programming
languages are Python, and R. Python is especially popular because it’s
easy to learn, and it supports multiple libraries for DS and ML.
48
Terminologies Related with Data
Science
• X) Business Intelligence (BI):
• Business intelligence(BI) involves gathering, preprocessing, and most
importantly presenting such data using data visualization tools and
techniques through charts, plots, tables and dashboards.
• The objective of BI systems is to provide appropriate information in a
timely manner to aid decision making.
• The BI system derives data from the different software system like ERP
systems, OLAP and data mining tools.
49
Terminologies Related with Data
Science
• XI) Deep Learning:
• Deep Learning is a subset of Machine Learning (ML) that uses
algorithms inspired by the structure and function of the human brain,
called Artificial Neural Networks (ANNs).
• It works more effectively on larger datasets.
• Applications of deep learning are in the domain of speech, video, and
audio recognition.
• Alexa and Siri are popular voice recognition applications of deep
learning.
50
Terminologies Related with Data
Science
• XII) Common Tools & Libraries
• Python, R – Popular programming languages for data science.
• NumPy, Pandas – Libraries for data manipulation.
• Matplotlib, Seaborn – Data visualization libraries.
• Scikit-learn – Machine learning library.
• TensorFlow, PyTorch – Deep learning frameworks.
• SQL – Language to query structured data.
51
Basic Framework and Architecture
• Data Science Architecture
• Data Science architecture is the framework that defines how different
components (data sources, processing, storage, analytics,
visualization, and decision-making) work together in the data science
lifecycle.
• It's the blueprint that enables the entire data science workflow, from
raw data to deployed models.
52
Basic Framework and Architecture
• Main Components of Data Science Architecture
• 1. Data Sources
• Where the raw data comes from.
• Types:
• Structured data (databases, spreadsheets).
• Unstructured data (text, images, videos, logs).
• Semi-structured data (JSON, XML, NoSQL).
• Examples: IoT sensors, social media, enterprise systems, web logs.
53
Basic Framework and Architecture
• 2. Data Ingestion Layer
• Responsible for collecting and importing data into the system. This is
the first step where raw data is collected from various sources.
• This can be done in two main ways:
• Batch processing:
• Collecting and processing large volumes of data at scheduled intervals
(e.g., daily sales reports).
• Real-time streaming:
• Ingesting data as it is generated for instant analysis (e.g., social media
feeds, sensor data from IoT devices).
54
Basic Framework and Architecture
• Common tools for this layer include Apache Kafka for streaming and
ETL (Extract, Transform, Load) tools for batch processing.
• 3. Data Storage Layer
• Stores raw and processed data.
• Types:
• Data Warehouse (structured, for analytics).
• Data Lake (raw, structured + unstructured).
• Databases (SQL, NoSQL).
• Tools: Hadoop HDFS, Amazon S3, Google BigQuery, Snowflake.
• Requirement: Scalability, reliability, and quick access.
55
Basic Framework and Architecture
• 4. Data Processing Layer
• Cleans, transforms, and prepares data for analysis.
• Involves:
• Data cleaning, integration, normalization.
• ETL (Extract, Transform, Load).
• Tools: Apache Spark, Pandas, Hadoop, SQL queries, MapReduce.
56
Basic Framework and Architecture
• 5. Analytics & Machine Learning Layer
• Core of data science: deriving insights and predictions.
• Purpose: Apply statistical models, machine learning, and deep
learning.
• Includes:
• Descriptive analytics (what happened).
• Predictive analytics (what will happen).
• Prescriptive analytics (what should be done).
• Tools: Python, R, TensorFlow, PyTorch, Scikit-learn.
57
Basic Framework and Architecture
• 6. Visualization & Reporting Layer
• Converts insights into visual formats for decision-making.
• Methods: Dashboards, interactive charts, reports.
• Tools: Tableau, Power BI, Matplotlib, Seaborn, Plotly.
• Key Role: Converts technical insights business-friendly visuals.
→
58
Basic Framework and Architecture
• 7. Decision Support Layer
• Purpose: Help organizations take action.
• Users: Business analysts, managers, executives.
• Examples:
• Healthcare: Predicting patient risks.
• Finance: Fraud detection alerts.
• Retail: Personalized product recommendations.
• Flow Recap:
• Data Sources Data Ingestion Data Storage Data Processing
→ → → →
Analytics & ML Visualization Decision Making
→ →
59
Importance of Data Science in Today’s
Business World
• In today’s world of technology and analytics, almost every industry
uses data to some degree. Some of the industries that use data
science include:
• Marketing
• Healthcare
• Defense and Security
• Natural Sciences
• Engineering
• Finance
• Insurance
• Political Policy
60
Importance of Data Science in Today’s
Business World
61
Importance of Data Science in Today’s
Business World
• Data science is critically important in today’s business world because it
enables companies to make informed decisions, enhance efficiency,
and remain competitive by converting raw data into actionable
insights that drive growth and innovation.
• 1. Informed Decision-Making
• Businesses generate massive amounts of data daily—from customer
transactions to operational metrics.
• Data Science transforms this raw data into actionable insights using
techniques like statistical analysis, machine learning, and data
visualization.
62
Importance of Data Science in Today’s
Business World
• Why it matters: Decisions based on accurate data reduce risks,
minimize guesswork, and increase the chances of success.
• Example: Retailers use sales data to determine which products to
stock more or discontinue, adjusting inventory based on seasonal
trends or consumer demand.
• Example: Walmart uses big data analytics to optimize supply chains,
forecast demand, and determine the best time to stock products. This
prevents shortages and reduces waste.
63
Importance of Data Science in Today’s
Business World
• 2. Understanding Customers Better
• Customers are at the center of every business.
• Data science helps companies analyze customer demographics,
buying habits, browsing history, and feedback.
• This analysis enables personalized marketing strategies, targeted
advertisements, and better customer engagement.
• For instance, Amazon and Flipkart recommend products based on
past purchases, while Netflix and Spotify suggest movies and songs
tailored to individual preferences.
• This personalization improves customer satisfaction and loyalty.
64
Importance of Data Science in Today’s
Business World
• 3. Risk Management and Fraud Detection
• Every business faces risks—financial, operational, or cyber-related.
• Data science plays a major role in identifying threats early and
preventing losses.
• In the banking and financial sector, machine learning algorithms
analyze transaction patterns to detect fraudulent activities within
seconds.
• Insurance companies also use predictive models to evaluate claims
and minimize fraud.
• This not only protects organizations but also builds trust with
customers.
65
Importance of Data Science in Today’s
Business World
• Example: PayPal uses machine learning algorithms to detect
suspicious transactions and prevent online fraud.
• Example: Mastercard and Visa monitor millions of transactions per
second using data science models to flag unusual activities instantly.
66
Importance of Data Science in Today’s
Business World
• 4. Strategic Forecasting and Planning
• Data science also supports long-term strategic planning by
forecasting future trends in sales, demand, and market behavior.
• Companies can simulate different business scenarios, prepare for
potential risks, and allocate resources effectively.
• This ability to anticipate the future makes businesses more resilient
and sustainable in a rapidly changing world.
• Example: Starbucks uses data to decide the best locations for
opening new outlets by analyzing demographics, traffic, and customer
preferences.
67
Importance of Data Science in Today’s
Business World
• 5. Driving Innovation and Product Development:
• Data science helps businesses understand what customers want,
leading to the development of new products and services. By
analyzing customer feedback and usage data, companies can improve
existing offerings or innovate entirely new solutions.
• Analyzing customer feedback and data helps companies create
innovative products and services.
• Example: Coca-Cola uses data science to decide new drink flavors by
analyzing customer feedback from social media and surveys.
• Example: Apple uses customer behavior data to introduce new
features like Face ID and Health tracking in iPhones.
68
Importance of Data Science in Today’s
Business World
• 6. Healthcare and Social Impact:
• Businesses in healthcare also benefit by predicting diseases and
improving patient outcomes.
• Example: IBM Watson Health uses AI to analyze medical records and
suggest treatment options for doctors.
• Example: During COVID-19, many companies used data science to
track virus spread, manage resources, and develop vaccines faster.
• Data Science is the backbone of the modern business world. From
decision-making to customer satisfaction, cost savings, innovation,
and risk management, it influences every part of business strategy.
69
Data Science Life Cycle
• There are five stages of the data science life cycle:
• Capture, (data acquisition, data entry, signal reception, data
extraction)
• Maintain (data warehousing, data cleansing, data staging, data
processing, data architecture)
• Process (data mining, clustering/classification, data modeling, data
summarization)
• Analyze (exploratory/confirmatory, predictive analysis, regression,
text mining, qualitative analysis)
• Communicate (data reporting, data visualization, business
intelligence, decision making).
70
Data Science Life Cycle
71
Primary Components of Data Science
• Data Science is an interdisciplinary field that combines statistical
methods, computer science, artificial intelligence, and domain
expertise. Its main components include Data Collection, Data
Preparation, Data Analysis, Machine Learning/AI, Data
Visualization, and Domain Expertise.
72
Primary Components of Data Science
• 1. Data and Data Collection (Acquisition & Storage)
• What it is: The process of gathering raw data from multiple sources
such as databases, sensors, websites, mobile apps, social media, and
IoT devices.
• Why it matters: High-quality and sufficient data is the foundation of
any data science project.
• Key Tools/Technologies: SQL, NoSQL databases (MongoDB,
Cassandra), APIs, Web Scraping, Hadoop, Spark.
• Example: An e-commerce company like Amazon collects data from
customer transactions, website clicks, product reviews, and browsing
history to analyze purchasing behavior.
73
Primary Components of Data Science
• 1. Data and Data Collection (Acquisition & Storage)
• Data collection involves systematically gathering information from
various sources including databases, APIs, web scraping, sensors,
and surveys.
• The quality and relevance of collected data directly impact the
effectiveness of subsequent analysis, making careful data acquisition
crucial for project success.
74
Primary Components of Data Science
• 2. Data Preparation (Cleaning & Transformation)
• What it is: Raw data is often messy, incomplete, or inconsistent. Data
preparation involves cleaning, removing duplicates, handling missing
values, and transforming data into a usable format.
• Why it matters: Poor-quality data leads to inaccurate insights.
“Garbage in, garbage out” applies strongly here.
• Key Techniques: Data wrangling, normalization, handling outliers,
feature engineering.
• Example: In healthcare, patient records may have missing or
inconsistent entries. Hospitals use data cleaning to ensure reliable
analysis before predicting treatment outcomes.
75
Primary Components of Data Science
• 3. Exploratory Data Analysis (EDA) & Statistics
• What it is: The process of using statistical techniques to summarize,
explore, and understand the data. EDA helps identify patterns,
correlations, and distributions.
• Why it matters: Before applying machine learning, analysts must
understand the dataset.
• Key Tools: Python (Pandas, NumPy, Matplotlib), R, Excel, Tableau.
• Example: A bank performs EDA on customer data to find
relationships between income levels and loan repayment rates.
76
Primary Components of Data Science
• 4. Machine Learning and Artificial Intelligence
• What it is: The heart of data science. ML/AI uses algorithms and
models to learn from historical data and make predictions or
classifications.
• Types:
• Supervised Learning (e.g., predicting house prices).
• Unsupervised Learning (e.g., customer segmentation).
• Reinforcement Learning (e.g., self-driving cars).
• Why it matters: Machine learning enables automation, predictive
analytics, and intelligent decision-making.
• Example: Netflix uses machine learning to recommend movies and
shows based on past user behavior.
77
Primary Components of Data Science
• 5. Data Visualization & Communication
• What it is: Presenting insights in a clear and understandable format
using graphs, charts, and dashboards.
• Why it matters: Decision-makers may not understand complex
algorithms but can act on visual insights.
• Key Tools: Tableau, Power BI, Python (Seaborn, Matplotlib), R
(ggplot2).
• Example: Google Analytics provides interactive dashboards that
allow businesses to track website traffic, user engagement, and
conversion rates.
78
Primary Components of Data Science
• 6. Big Data & Cloud Computing
• What it is: Handling and analyzing extremely large datasets that
cannot be processed by traditional systems. Cloud platforms provide
scalable storage and computing power.
• Why it matters: Modern businesses generate terabytes of data daily,
requiring big data solutions.
• Technologies: Hadoop, Spark, AWS, Azure, Google Cloud.
• Example: Facebook processes petabytes of user data daily to
improve ad targeting and user engagement.
79
Primary Components of Data Science
• 7. Data Engineering & Deployment
• What it is: Building data pipelines to collect, store, and process data
efficiently. Deployment ensures machine learning models are
integrated into real-world applications.
• Why it matters: Without engineering and deployment, insights
remain theoretical and cannot be used in practice.
• Example: Uber deploys machine learning models in real time for ride
matching, surge pricing, and estimated arrival times.
80
Users of Data Science and its
Hierarchy
• 1. Users of Data Science
• The main users of data science can be grouped as follows:
• a) Business Executives / Decision-Makers
• Use data science insights for strategic decisions.
• They are not technical but rely on dashboards and reports.
• Example: A CEO of a retail chain using sales forecasts to decide store
expansions.
81
Users of Data Science and its
Hierarchy
• b) Managers : Use reports, dashboards, and visualizations to make
operational decisions.
• May perform basic analysis with Excel, Tableau, or Power BI.
• Example: A marketing manager analyzing campaign performance to
allocate budgets.
• c) Data Scientists / Data Analysts: Build models and algorithms
using machine learning, statistics, and programming.
• Work with raw data to find insights, make predictions, and automate
processes.
• Example: A Prime Video data scientist building a recommendation
system.
82
Users of Data Science and its
Hierarchy
• d) Data Engineers
• Ensure data is collected, cleaned, stored, and accessible for
analysis.
• Build data pipelines and integrate data into business systems.
• Example: At OLA, data engineers build systems to process millions of
ride requests per day.
• e) IT & Software Developers
• Implement machine learning models into applications.
• Ensure scalability, reliability, and security of data systems.
• Example: Developers deploying fraud detection models into banking
apps.
83
Users of Data Science and its
Hierarchy
• f) External Users (Customers/Clients)
• End users who indirectly benefit from data science applications like
recommendation engines, chatbots, or fraud detection systems.
• Example: Customers using Google Maps (which uses data science for
route optimization).
84
Overview of Different Data Science
Techniques
• 1. Data Preprocessing Techniques: Before applying advanced
models, raw data must be cleaned, transformed, and prepared.
• Data Cleaning: Handling missing values, removing duplicates,
correcting errors.
Example: Filling missing ages in a customer dataset with the average age.
• Data Transformation: Normalization, standardization, encoding
categorical values.
Example: Converting “Male/Female” into 0/1 for machine learning
models.
• Feature Engineering: Creating new features from existing ones.
Example: Extracting “Day of Week” from a timestamp.
85
Overview of Different Data Science
Techniques
• 2. Exploratory Data Analysis (EDA)
• Understanding data patterns and insights before modeling.
• Statistical Analysis: Mean, median, variance, correlations.
• Visualization: Histograms, scatter plots, heatmaps.
Example: Checking correlation between “Advertising Spend” and “Sales.”
86
Overview of Different Data Science
Techniques
• 3. Supervised Learning Techniques
• Used when we have labeled data (input + output).
• Regression: Predicting continuous values.
• Linear Regression, Polynomial Regression
Example: Predicting house prices based on area, location, and rooms.
• Classification: Predicting categories.
• Logistic Regression, Decision Trees, Random Forests, SVM, Neural
Networks
Example: Classifying emails as “Spam” or “Not Spam.”
87
Overview of Different Data Science
Techniques
• 4. Unsupervised Learning Techniques
• Used when we only have input data (no labels).
• Clustering: Grouping similar data points.
• K-Means, Hierarchical Clustering, DBSCAN
Example: Customer segmentation in marketing.
• Dimensionality Reduction: Reducing dataset complexity.
• PCA (Principal Component Analysis), t-SNE
Example: Reducing features in image recognition.
88
Overview of Different Data Science
Techniques
• 5. Semi-Supervised & Self-Supervised Techniques
• Semi-Supervised Learning: Mix of labeled + unlabeled
data.
Example: Classifying medical images where only some are
labeled.
• Self-Supervised Learning: Model generates its own labels
from data (common in NLP & Vision).
Example: Predicting the next word in a sentence (used in GPT
models).
89
Overview of Different Data Science
Techniques
• 6. Reinforcement Learning Techniques
• Learning by interaction with an environment using rewards
& penalties.
• Value-Based: Q-Learning, Deep Q-Networks.
• Policy-Based: Policy Gradient, Actor-Critic.
Example: Training a robot to walk, or AI playing chess/Go.
90
Overview of Different Data Science
Techniques
• 7. Deep Learning Techniques
• Advanced subset of ML, especially for unstructured data.
• Neural Networks (ANNs): General prediction models.
• Convolutional Neural Networks (CNNs): Image
recognition, computer vision.
• Recurrent Neural Networks (RNNs, LSTMs, GRUs):
Sequential data (time series, text).
• Transformers (BERT, GPT): NLP and large-scale AI models.
Example: Image classification, text translation, chatbots.
91
Overview of Different Data Science
Techniques
• 8. Natural Language Processing (NLP) Techniques
• For text & language-based data.
• Text Preprocessing: Tokenization, stemming,
lemmatization, stopword removal.
• Text Representation: Bag of Words, TF-IDF, Word
Embeddings (Word2Vec, GloVe).
• Applications: Sentiment analysis, chatbots, machine
translation.
92
Overview of Different Data Science
Techniques
• 9. Time Series Analysis Techniques
• For data with a temporal order.
• Decomposition: Trend, seasonality, residuals.
• Forecasting Models: ARIMA, Prophet, LSTMs.
Example: Stock market prediction, weather forecasting.
93
Overview of Different Data Science
Techniques
• 10. Big Data & Scalable Techniques
• Handling large datasets that don’t fit into memory.
• Distributed Computing: Hadoop, Spark.
• Stream Processing: Apache Kafka, Flink.
Example: Real-time fraud detection in banking.
94
Skills needed to be a Data
Scientist
95
Thank You!
For any query/suggestions pls mail
sagar.pandya@medicaps.ac.in
0731 3111500, 0731 3111501
www.medicaps.ac.in
A.B. Road, Pigdamber, Rau, Indore – 453331

Introduction to Data Science Unit - 1 SP

  • 1.
  • 2.
    2 Course Learning Objectives(CLOs) CLO01 To Understand the importance of Data Science in real world CLO02 To learn the importance of Probability and statistic in Data Science CLO03 To Learn Why we analysis of Data before applied Data Science Process CLO04 To Learn the importance of Data Visualization in Real world and Data Science CLO05 To Learn the Importance of Python as a Data Science Tool
  • 3.
    3 Syllabus Unit-I: Introduction to DataScience, Definition and Description of Data Science, History and Development of Data Science, Terminologies Related with Data Science, Basic Framework and Architecture, Importance of Data Science in Today’s Business World, Primary Components of Data Science, Users of Data Science and its Hierarchy, Overview of Different Data Science Techniques.
  • 4.
    4 Syllabus Unit-II Sample Spaces, Events,Conditional Probability and Independence. Random Variables. Discrete and Continuous Random Variables, Densities and Distributions, Normal Distribution and its Properties, Introduction to Markov Chains, Random Walks, Descriptive, Predictive and Prescriptive Statistics, Statistical Inference, Populations and Samples, Statistical Modeling
  • 5.
    5 Syllabus Unit-III Exploratory Data Analysisand the Data Science Process - Basic Tools (Plots, Graphs and Summary Statistics) of EDA - Philosophy of EDA - The Data Science Process - Case Study Unit-IV Data Visualization: Basic Principles, Ideas and Tools for Data Visualization, Examples of Inspiring (Industry) Projects, Exercise: Create Your Own Visualization of a Complex Dataset
  • 6.
    6 Syllabus Unit-V NoSQL, Use ofPython as a Data Science Tool, Python Libraries: SciPy and sci-kitLearn, PyBrain, Pylearn, Matplotlib, Challenges and Scope of Data Science Project Management.
  • 7.
    7 Text Books 1. JoelGrus, Data Science from Scratch: First Principles with Python,O’RIELLY 2. Sinan Ozdemir, Principles of Data Science, PACKT. 3. Joke Vanderplas, Python Data Science Hand Book, O’Reilly Publication.
  • 8.
    8 Reference Books 1. LillianPierson, Data Science for Dummies,WILEY 2. Foster Provost, Tom Fawcett, Data Science for Business: What You Need to Know about Data Mining and Data-Analytic Thinking 3. Field Cady The Data Science Hand Book, Wiley Publication
  • 9.
    9 Course Outcomes (COs) Aftercompletion of this course the students shall be able to: CO01 Students will able to learn importance of Data Scientist and Data Science Technique CO02 Students will able to learn Probability and Statistical Modeling CO03 Students will able to learn Exploratory Data Analysis in Data Science CO04 Student will able to learn Data Visualization of Data with example of Inspiring Industry Projects CO05 Students will apply data science concepts and methods to solve problems in real- world contexts and will communicate these solutions effectively with the help of Python as a Data Science tool
  • 10.
    10 What is DataScience? Data Science is a combination of multiple disciplines that uses statistics, data analysis, and machine learning to analyze data and to extract knowledge and insights from it. Data Science is also known as data-driven science. Data Science uses the most advanced hardware, programming systems, and algorithms to solve problems that have to do with data. Data Science is about data gathering, analysis and decision-making. Data Science is about finding patterns in data, through analysis, and make future predictions.
  • 11.
  • 12.
    12 What is DataScience? • By using Data Science, companies are able to make: • Better decisions (should we choose A or B) • Predictive analysis (what will happen next?) • Pattern discoveries (find pattern, or maybe hidden information in the data)
  • 13.
    13 Where is DataScience Needed? • Data Science is used in many industries in the world today, e.g. banking, consultancy, healthcare, and manufacturing. • Examples of where Data Science is needed: • For route planning: To discover the best routes • To create promotional offers • To find the best suited time to deliver goods • To forecast the next years revenue for a company • To analyze health benefit of training • To predict who will win elections
  • 14.
    14 Where is DataScience Needed? • Data Science can be applied in nearly every part of a business where data is available. Examples are: • Consumer goods • Stock markets • Industry • Politics • Logistic companies • E-commerce
  • 15.
    15 Where is DataScience Needed? • Data Science can be applied in nearly every part of a business where data is available. Examples are: • Consumer goods • Stock markets • Industry • Politics • Logistic companies • E-commerce
  • 16.
    What is Data? •Data is collection of unprocessed items that may consists of text, numbers, images and video. • One purpose of Data Science is to structure data, making it interpretable and easy to work with. • Today, data can be represented in various forms like sound, images and video. Structured: numbers, text etc. Unstructured: images, video etc.
  • 17.
    What is Data? •Unstructured Data: Unstructured data is not organized. We must organize the data for analysis purposes.
  • 18.
    What is Data? •Structured Data: Structured data is organized and easier to work with.
  • 19.
    What is Information? •Meaningful data is called information. • Information refers to the data that have been processed in such a way that the knowledge of the person who uses the data is increased. • Example:- 1A$ - Data (No meaning) 1$ - Information (Currency) • For the decision to be meaningful, the processed data must qualify for the following characteristics − • Timely Information should be available when required. − • Accuracy Information should be accurate. − • Completeness Information should be complete. −
  • 20.
    What is Metadata? •Metadata describes other data. • Data about data, • For example - an image may include metadata that describes how large the picture is, the color depth, the image resolution, when the image was created, and other data. • A text document's metadata may contain information about how long the document is, who the author is, when the document was written, and a short summary of the document. 1) Operational Metadata 2) Extraction and Transformation Metadata 3) End User Metadata
  • 21.
    What is Databaseand DBMS? • Database is a collection of inter-related data which helps in efficient retrieval, insertion and deletion of data from database and organizes the data in the form of tables. • The software which is used to manage database is called Database Management System (DBMS). • A database management system stores data in such a way that it becomes easier to retrieve, manipulate, and produce information. • For Example, MySQL, Oracle etc. are popular commercial DBMS used in different applications.
  • 22.
    22 Introduction to DataScience • Commonly referred to as the “oil of the 21st century,” our digital data carries the most importance in the field. • It has incalculable benefits in business, research and our everyday lives. • Your route to work, your most recent Google search for the nearest coffee shop, your Instagram post about what you ate, and even the health data from your fitness tracker are all important to different data scientists in different ways. • Sifting through massive lakes of data, looking for connections and patterns, data science is responsible for bringing us new products, delivering breakthrough insights and making our lives more convenient.
  • 23.
    23 Definition Data Science •Data science is a field that uses scientific methods, processes, algorithms, and systems to extract knowledge and insights from structured and unstructured data. • For example, when you visit an e-commerce site and look at a few categories and products before making a purchase, you are creating data. • It involves different disciplines like mathematical and statistical modelling, extracting data from its source and applying data visualization techniques. hat Analysts can use to figure out how you make purchases.
  • 24.
    24 Description of DataScience • Interdisciplinary nature: Combines statistics, computer science, mathematics, and domain knowledge. • Goal: To understand data, find patterns, and make data-driven decisions. • Process: Involves collecting, cleaning, analyzing, visualizing, and modeling data. • Scope: Used in almost every industry — finance, healthcare, retail, manufacturing, education, entertainment, and technology. • Output: Actionable insights, predictions, and automation that support better decision-making.
  • 25.
    25 Why is DataScience Important ? • “By 2025, global data generation is projected to hit 175 zettabytes— that's 175 trillion gigabytes. If the current exponential growth continues, by 2030 we could be generating over 200 zettabytes annually. • The volume of data continues to grow exponentially, creating vast opportunities and challenges in the field of Data Science. • Simple data analysis can handle information from a single source or a limited dataset. However, with today’s massive and diverse datasets, advanced Data Science tools are essential for making sense of big data collected from multiple sources. • Data Science enables businesses to process both structured and unstructured data to uncover meaningful patterns and insights.
  • 26.
    26 Examples of DataScience • Examples: • Netflix, YouTube, and Spotify use Data Science for recommendation systems (suggesting movies, videos, or songs). • Social media platforms (Instagram, Snapchat) analyze your activity to show you personalized content. • Fraud detection: Banks flag suspicious transactions in real time. • Credit scoring: Loan approval decisions are made using Data Science models. • Stock market predictions and algorithmic trading. • Predicting diseases (like diabetes or heart problems) based on patient records.
  • 27.
    27 History of DataScience • In its early days in the 60s, the term data science was often used as an alternative to computer science. • It was probably used for the first time by Peter Naur in 1960 and later published by him in 1974 in Concise Survey of Computer Methods. • However, it was used for the first time officially at the Kobe Conference in 1996 of the International Federation of Classification Societies, where it was actually used to define the event itself.
  • 28.
    28 History of DataScience • 1960s–1970s: Foundations • 1962 – John W. Tukey introduced the term “data analysis” in his paper The Future of Data Analysis, emphasizing exploration beyond classical statistics. • 1974 – Peter Naur used the term “Data Science” in his book Concise Survey of Computer Methods. • 1980s–1990s: Growth of Computing & Databases • 1989 – The term “Knowledge Discovery in Databases (KDD)” was introduced, focusing on extracting patterns from large datasets. • 1990s – Rapid rise of databases, data warehouses, and statistical computing (SAS, SPSS, R).
  • 29.
    29 History of DataScience • 2000s: Data Science Emerges • 2001 – William S. Cleveland formally proposed Data Science as an independent discipline, combining statistics, computer science, and domain expertise. • The explosion of internet data, search engines, and social media created demand for handling massive information. • 2010s: Big Data & Machine Learning Era • 2010 – The term “Big Data” gained popularity as global data volume surged. • Development of Hadoop, Spark, TensorFlow enabled large-scale data processing.
  • 30.
    30 History of DataScience • 2012 – Harvard Business Review called “Data Scientist: The Sexiest Job of the 21st Century.” • AI & ML began powering recommendations, fraud detection, autonomous systems. • 2020s & Beyond: AI-Driven Data Science • Integration of Deep Learning, Generative AI, and Cloud Computing. • Data Science + AI driving self-driving cars, personalized medicine, and smart assistants. • By 2030, global datasphere projected to surpass 200 zettabytes, making Data Science even more critical.
  • 31.
    31 Terminologies Related withData Science • Data science terminology refers to the specific vocabulary and concepts used within the field of data science to describe its techniques, tools, and processes.
  • 32.
    32 Terminologies Related withData Science • Core Concepts • Data: Raw facts and figures collected from different sources. Data can be numbers, text, images, audio, or video. For example: student marks in a class, tweets on Twitter(X), MRI scan images. It can be qualitative (descriptive) or quantitative (numerical). • Dataset: A collection of related data or A collection of data points organized in a structured or unstructured format. Example: An Excel sheet with rows (students) and columns (attributes like name, marks, class). • Data Analysis: The process of cleaning, transforming, and modeling data to discover useful information and support decision-making.
  • 33.
    33 Terminologies Related withData Science • I) Big Data: Extremely large and complex datasets that traditional data processing applications are unable to handle. • Big data is a large collection of data characterized by the four V’s: volume, velocity, variety and veracity. • Volume refers to the amount of data—big data deals with high volumes of data. • Velocity refers to the rate at which data is collected—big data is collected at a high velocity and often streams directly into memory.
  • 34.
  • 35.
    35 Terminologies Related withData Science • Variety refers to the range of data formats—big data tends to have a high variety of structured, semi-structured, and unstructured data, as well as a variety of formats such as numbers, text strings, images, and audio. • Veracity: Veracity deals with the authenticity of the data being captured, whether it is trustworthy and bias free. • Due to the speed, volume, and variety of data generated, the authenticity of such data becomes a huge challenge.
  • 36.
    36 Terminologies Related withData Science • II) Data Types and Structures • Structured Data: Data that is highly organized and follows a clear format, like data in a relational database or an Excel spreadsheet. Example: Student marks in a table. • Unstructured Data: Data that doesn't have a predefined format or organization. Examples include text, images, audio, and video files. • Semi-structured Data: Partially organized, uses tags or hierarchy. Example: JSON, XML. • Metadata: Data about data. For instance, the creation date and author of a document are metadata.
  • 37.
    37 Terminologies Related withData Science • Based on Nature: • Categorical Data (Qualitative): Describes qualities or categories. Example: Gender (Male/Female), City (Delhi, Mumbai). • Numerical Data (Quantitative): Represents numbers. • Discrete Data: Countable (Number of students in a class). • Continuous Data: Measurable (Height, weight).
  • 38.
    38 Terminologies Related withData Science • III) Machine Learning • Machine learning is the backbone of data science. • Data Scientists need to have a solid grasp on ML in addition to basic knowledge of statistics. • Machine learning (ML) is a subset of Al. • It refers to the modeling techniques where the model learns on its own without human intervention. • Once the model is built, it has the capability of learning from the past data. • This gives the model the required competency to process the new data independently, that is, the machine learns from the data.
  • 39.
    39 Terminologies Related withData Science • In simple words, ML teaches the systems to think and understand like humans by learning from the data. • Instead of receiving direct instructions, ML models learn patterns from large datasets, allowing them to make predictions, classifications, and decisions on new, unseen data. • 1. Supervised Machine Learning: In supervised learning, the model is trained using labeled data (data with both input and output). • The algorithm learns the mapping between input (features) and output (target/label).
  • 40.
    40 Terminologies Related withData Science • Goal: Predict outcomes for new, unseen data. • Real-life Examples: • Email Spam Detection Input: Email text Output: → "Spam" or "Not Spam" • House Price Prediction Input: Size, location, rooms Output: → House price • Medical Diagnosis Input: Patient data Output: → Disease/No disease • Voice Assistants Input: Audio command Output: → Action (“Play music”)
  • 41.
    41 Terminologies Related withData Science • 2. Unsupervised Machine Learning: • In unsupervised learning, the model is trained using unlabeled data (no predefined output). • The algorithm tries to find patterns, clusters, or structure within the data. • Goal: • Discover hidden relationships or groupings in the data. • Real-life Examples: • Customer Segmentation: Input: Purchase history Output: → Groups of customers with similar buying behavior
  • 42.
    42 Terminologies Related withData Science • Market Basket Analysis Input: Shopping data Output: “People who buy bread also buy → butter” • Social Media Friend Suggestions Input: User connections Output: Suggested friends based on → network clustering • Anomaly Detection in Banking Input: Transactions Output: Flag unusual transactions (possible → fraud)
  • 43.
    43 Terminologies Related withData Science • IV) Data Mining: Data Mining is the process of extracting useful patterns, knowledge, and insights from large sets of data. • It is sometimes called Knowledge Discovery in Databases (KDD). • Data mining uses techniques from statistics, machine learning, and database systems to find hidden patterns that are not immediately obvious. • We live in a world where huge amounts of data are generated every second (business transactions, social media, medical records, sensor data, etc.). • Simply storing data is not useful—we need to analyze it to make decisions.
  • 44.
    44 Terminologies Related withData Science • Steps in Data Mining (KDD Process): • Data Cleaning – Remove noise, missing values, duplicates. • Data Integration – Combine data from different sources. • Data Selection – Select the relevant data for analysis. • Data Transformation – Convert into proper format (normalization, aggregation). • Data Mining – Apply algorithms to find patterns, clusters, associations. • Pattern Evaluation – Identify useful and meaningful results. • Knowledge Presentation – Present results using graphs, reports, dashboards.
  • 45.
    45 Terminologies Related withData Science • Example to Understand Easily: • Imagine a supermarket with millions of sales records. • Raw data = "Customer A bought milk, bread, and eggs." • Data mining can discover that: • "70% of customers who buy milk also buy bread." • "Young adults prefer snacks and cold drinks." • This knowledge helps the store place products together and run better promotions.
  • 46.
    46 Terminologies Related withData Science • V) Data Warehouse: A data warehouse is a centralized data repository that stores processed, organized data from multiple sources. Data warehouses may contain a combination of current and historical data that has been extracted, transformed, and loaded from internal and external databases. • VI) Data Mart: A data mart is a subset of a data warehouse that houses all processed data relevant to a specific department. While a data warehouse may contain data pertaining to the finance, marketing, sales, and human resources teams, a data mart may isolate the finance team data.
  • 47.
    47 Terminologies Related withData Science • VII) Modeling: Mathematical models enable you to make quick calculations and predictions based on what you already know about the data. Modeling is also a part of ML and involves identifying which algorithm is the most suitable to solve a given problem and how to train these models. • VIII) Databases: A capable data scientist, you need to understand how databases work, how to manage them, and how to extract data from them. • IX) Programming: Some level of programming is required to execute a successful data science project. The most common programming languages are Python, and R. Python is especially popular because it’s easy to learn, and it supports multiple libraries for DS and ML.
  • 48.
    48 Terminologies Related withData Science • X) Business Intelligence (BI): • Business intelligence(BI) involves gathering, preprocessing, and most importantly presenting such data using data visualization tools and techniques through charts, plots, tables and dashboards. • The objective of BI systems is to provide appropriate information in a timely manner to aid decision making. • The BI system derives data from the different software system like ERP systems, OLAP and data mining tools.
  • 49.
    49 Terminologies Related withData Science • XI) Deep Learning: • Deep Learning is a subset of Machine Learning (ML) that uses algorithms inspired by the structure and function of the human brain, called Artificial Neural Networks (ANNs). • It works more effectively on larger datasets. • Applications of deep learning are in the domain of speech, video, and audio recognition. • Alexa and Siri are popular voice recognition applications of deep learning.
  • 50.
    50 Terminologies Related withData Science • XII) Common Tools & Libraries • Python, R – Popular programming languages for data science. • NumPy, Pandas – Libraries for data manipulation. • Matplotlib, Seaborn – Data visualization libraries. • Scikit-learn – Machine learning library. • TensorFlow, PyTorch – Deep learning frameworks. • SQL – Language to query structured data.
  • 51.
    51 Basic Framework andArchitecture • Data Science Architecture • Data Science architecture is the framework that defines how different components (data sources, processing, storage, analytics, visualization, and decision-making) work together in the data science lifecycle. • It's the blueprint that enables the entire data science workflow, from raw data to deployed models.
  • 52.
    52 Basic Framework andArchitecture • Main Components of Data Science Architecture • 1. Data Sources • Where the raw data comes from. • Types: • Structured data (databases, spreadsheets). • Unstructured data (text, images, videos, logs). • Semi-structured data (JSON, XML, NoSQL). • Examples: IoT sensors, social media, enterprise systems, web logs.
  • 53.
    53 Basic Framework andArchitecture • 2. Data Ingestion Layer • Responsible for collecting and importing data into the system. This is the first step where raw data is collected from various sources. • This can be done in two main ways: • Batch processing: • Collecting and processing large volumes of data at scheduled intervals (e.g., daily sales reports). • Real-time streaming: • Ingesting data as it is generated for instant analysis (e.g., social media feeds, sensor data from IoT devices).
  • 54.
    54 Basic Framework andArchitecture • Common tools for this layer include Apache Kafka for streaming and ETL (Extract, Transform, Load) tools for batch processing. • 3. Data Storage Layer • Stores raw and processed data. • Types: • Data Warehouse (structured, for analytics). • Data Lake (raw, structured + unstructured). • Databases (SQL, NoSQL). • Tools: Hadoop HDFS, Amazon S3, Google BigQuery, Snowflake. • Requirement: Scalability, reliability, and quick access.
  • 55.
    55 Basic Framework andArchitecture • 4. Data Processing Layer • Cleans, transforms, and prepares data for analysis. • Involves: • Data cleaning, integration, normalization. • ETL (Extract, Transform, Load). • Tools: Apache Spark, Pandas, Hadoop, SQL queries, MapReduce.
  • 56.
    56 Basic Framework andArchitecture • 5. Analytics & Machine Learning Layer • Core of data science: deriving insights and predictions. • Purpose: Apply statistical models, machine learning, and deep learning. • Includes: • Descriptive analytics (what happened). • Predictive analytics (what will happen). • Prescriptive analytics (what should be done). • Tools: Python, R, TensorFlow, PyTorch, Scikit-learn.
  • 57.
    57 Basic Framework andArchitecture • 6. Visualization & Reporting Layer • Converts insights into visual formats for decision-making. • Methods: Dashboards, interactive charts, reports. • Tools: Tableau, Power BI, Matplotlib, Seaborn, Plotly. • Key Role: Converts technical insights business-friendly visuals. →
  • 58.
    58 Basic Framework andArchitecture • 7. Decision Support Layer • Purpose: Help organizations take action. • Users: Business analysts, managers, executives. • Examples: • Healthcare: Predicting patient risks. • Finance: Fraud detection alerts. • Retail: Personalized product recommendations. • Flow Recap: • Data Sources Data Ingestion Data Storage Data Processing → → → → Analytics & ML Visualization Decision Making → →
  • 59.
    59 Importance of DataScience in Today’s Business World • In today’s world of technology and analytics, almost every industry uses data to some degree. Some of the industries that use data science include: • Marketing • Healthcare • Defense and Security • Natural Sciences • Engineering • Finance • Insurance • Political Policy
  • 60.
    60 Importance of DataScience in Today’s Business World
  • 61.
    61 Importance of DataScience in Today’s Business World • Data science is critically important in today’s business world because it enables companies to make informed decisions, enhance efficiency, and remain competitive by converting raw data into actionable insights that drive growth and innovation. • 1. Informed Decision-Making • Businesses generate massive amounts of data daily—from customer transactions to operational metrics. • Data Science transforms this raw data into actionable insights using techniques like statistical analysis, machine learning, and data visualization.
  • 62.
    62 Importance of DataScience in Today’s Business World • Why it matters: Decisions based on accurate data reduce risks, minimize guesswork, and increase the chances of success. • Example: Retailers use sales data to determine which products to stock more or discontinue, adjusting inventory based on seasonal trends or consumer demand. • Example: Walmart uses big data analytics to optimize supply chains, forecast demand, and determine the best time to stock products. This prevents shortages and reduces waste.
  • 63.
    63 Importance of DataScience in Today’s Business World • 2. Understanding Customers Better • Customers are at the center of every business. • Data science helps companies analyze customer demographics, buying habits, browsing history, and feedback. • This analysis enables personalized marketing strategies, targeted advertisements, and better customer engagement. • For instance, Amazon and Flipkart recommend products based on past purchases, while Netflix and Spotify suggest movies and songs tailored to individual preferences. • This personalization improves customer satisfaction and loyalty.
  • 64.
    64 Importance of DataScience in Today’s Business World • 3. Risk Management and Fraud Detection • Every business faces risks—financial, operational, or cyber-related. • Data science plays a major role in identifying threats early and preventing losses. • In the banking and financial sector, machine learning algorithms analyze transaction patterns to detect fraudulent activities within seconds. • Insurance companies also use predictive models to evaluate claims and minimize fraud. • This not only protects organizations but also builds trust with customers.
  • 65.
    65 Importance of DataScience in Today’s Business World • Example: PayPal uses machine learning algorithms to detect suspicious transactions and prevent online fraud. • Example: Mastercard and Visa monitor millions of transactions per second using data science models to flag unusual activities instantly.
  • 66.
    66 Importance of DataScience in Today’s Business World • 4. Strategic Forecasting and Planning • Data science also supports long-term strategic planning by forecasting future trends in sales, demand, and market behavior. • Companies can simulate different business scenarios, prepare for potential risks, and allocate resources effectively. • This ability to anticipate the future makes businesses more resilient and sustainable in a rapidly changing world. • Example: Starbucks uses data to decide the best locations for opening new outlets by analyzing demographics, traffic, and customer preferences.
  • 67.
    67 Importance of DataScience in Today’s Business World • 5. Driving Innovation and Product Development: • Data science helps businesses understand what customers want, leading to the development of new products and services. By analyzing customer feedback and usage data, companies can improve existing offerings or innovate entirely new solutions. • Analyzing customer feedback and data helps companies create innovative products and services. • Example: Coca-Cola uses data science to decide new drink flavors by analyzing customer feedback from social media and surveys. • Example: Apple uses customer behavior data to introduce new features like Face ID and Health tracking in iPhones.
  • 68.
    68 Importance of DataScience in Today’s Business World • 6. Healthcare and Social Impact: • Businesses in healthcare also benefit by predicting diseases and improving patient outcomes. • Example: IBM Watson Health uses AI to analyze medical records and suggest treatment options for doctors. • Example: During COVID-19, many companies used data science to track virus spread, manage resources, and develop vaccines faster. • Data Science is the backbone of the modern business world. From decision-making to customer satisfaction, cost savings, innovation, and risk management, it influences every part of business strategy.
  • 69.
    69 Data Science LifeCycle • There are five stages of the data science life cycle: • Capture, (data acquisition, data entry, signal reception, data extraction) • Maintain (data warehousing, data cleansing, data staging, data processing, data architecture) • Process (data mining, clustering/classification, data modeling, data summarization) • Analyze (exploratory/confirmatory, predictive analysis, regression, text mining, qualitative analysis) • Communicate (data reporting, data visualization, business intelligence, decision making).
  • 70.
  • 71.
    71 Primary Components ofData Science • Data Science is an interdisciplinary field that combines statistical methods, computer science, artificial intelligence, and domain expertise. Its main components include Data Collection, Data Preparation, Data Analysis, Machine Learning/AI, Data Visualization, and Domain Expertise.
  • 72.
    72 Primary Components ofData Science • 1. Data and Data Collection (Acquisition & Storage) • What it is: The process of gathering raw data from multiple sources such as databases, sensors, websites, mobile apps, social media, and IoT devices. • Why it matters: High-quality and sufficient data is the foundation of any data science project. • Key Tools/Technologies: SQL, NoSQL databases (MongoDB, Cassandra), APIs, Web Scraping, Hadoop, Spark. • Example: An e-commerce company like Amazon collects data from customer transactions, website clicks, product reviews, and browsing history to analyze purchasing behavior.
  • 73.
    73 Primary Components ofData Science • 1. Data and Data Collection (Acquisition & Storage) • Data collection involves systematically gathering information from various sources including databases, APIs, web scraping, sensors, and surveys. • The quality and relevance of collected data directly impact the effectiveness of subsequent analysis, making careful data acquisition crucial for project success.
  • 74.
    74 Primary Components ofData Science • 2. Data Preparation (Cleaning & Transformation) • What it is: Raw data is often messy, incomplete, or inconsistent. Data preparation involves cleaning, removing duplicates, handling missing values, and transforming data into a usable format. • Why it matters: Poor-quality data leads to inaccurate insights. “Garbage in, garbage out” applies strongly here. • Key Techniques: Data wrangling, normalization, handling outliers, feature engineering. • Example: In healthcare, patient records may have missing or inconsistent entries. Hospitals use data cleaning to ensure reliable analysis before predicting treatment outcomes.
  • 75.
    75 Primary Components ofData Science • 3. Exploratory Data Analysis (EDA) & Statistics • What it is: The process of using statistical techniques to summarize, explore, and understand the data. EDA helps identify patterns, correlations, and distributions. • Why it matters: Before applying machine learning, analysts must understand the dataset. • Key Tools: Python (Pandas, NumPy, Matplotlib), R, Excel, Tableau. • Example: A bank performs EDA on customer data to find relationships between income levels and loan repayment rates.
  • 76.
    76 Primary Components ofData Science • 4. Machine Learning and Artificial Intelligence • What it is: The heart of data science. ML/AI uses algorithms and models to learn from historical data and make predictions or classifications. • Types: • Supervised Learning (e.g., predicting house prices). • Unsupervised Learning (e.g., customer segmentation). • Reinforcement Learning (e.g., self-driving cars). • Why it matters: Machine learning enables automation, predictive analytics, and intelligent decision-making. • Example: Netflix uses machine learning to recommend movies and shows based on past user behavior.
  • 77.
    77 Primary Components ofData Science • 5. Data Visualization & Communication • What it is: Presenting insights in a clear and understandable format using graphs, charts, and dashboards. • Why it matters: Decision-makers may not understand complex algorithms but can act on visual insights. • Key Tools: Tableau, Power BI, Python (Seaborn, Matplotlib), R (ggplot2). • Example: Google Analytics provides interactive dashboards that allow businesses to track website traffic, user engagement, and conversion rates.
  • 78.
    78 Primary Components ofData Science • 6. Big Data & Cloud Computing • What it is: Handling and analyzing extremely large datasets that cannot be processed by traditional systems. Cloud platforms provide scalable storage and computing power. • Why it matters: Modern businesses generate terabytes of data daily, requiring big data solutions. • Technologies: Hadoop, Spark, AWS, Azure, Google Cloud. • Example: Facebook processes petabytes of user data daily to improve ad targeting and user engagement.
  • 79.
    79 Primary Components ofData Science • 7. Data Engineering & Deployment • What it is: Building data pipelines to collect, store, and process data efficiently. Deployment ensures machine learning models are integrated into real-world applications. • Why it matters: Without engineering and deployment, insights remain theoretical and cannot be used in practice. • Example: Uber deploys machine learning models in real time for ride matching, surge pricing, and estimated arrival times.
  • 80.
    80 Users of DataScience and its Hierarchy • 1. Users of Data Science • The main users of data science can be grouped as follows: • a) Business Executives / Decision-Makers • Use data science insights for strategic decisions. • They are not technical but rely on dashboards and reports. • Example: A CEO of a retail chain using sales forecasts to decide store expansions.
  • 81.
    81 Users of DataScience and its Hierarchy • b) Managers : Use reports, dashboards, and visualizations to make operational decisions. • May perform basic analysis with Excel, Tableau, or Power BI. • Example: A marketing manager analyzing campaign performance to allocate budgets. • c) Data Scientists / Data Analysts: Build models and algorithms using machine learning, statistics, and programming. • Work with raw data to find insights, make predictions, and automate processes. • Example: A Prime Video data scientist building a recommendation system.
  • 82.
    82 Users of DataScience and its Hierarchy • d) Data Engineers • Ensure data is collected, cleaned, stored, and accessible for analysis. • Build data pipelines and integrate data into business systems. • Example: At OLA, data engineers build systems to process millions of ride requests per day. • e) IT & Software Developers • Implement machine learning models into applications. • Ensure scalability, reliability, and security of data systems. • Example: Developers deploying fraud detection models into banking apps.
  • 83.
    83 Users of DataScience and its Hierarchy • f) External Users (Customers/Clients) • End users who indirectly benefit from data science applications like recommendation engines, chatbots, or fraud detection systems. • Example: Customers using Google Maps (which uses data science for route optimization).
  • 84.
    84 Overview of DifferentData Science Techniques • 1. Data Preprocessing Techniques: Before applying advanced models, raw data must be cleaned, transformed, and prepared. • Data Cleaning: Handling missing values, removing duplicates, correcting errors. Example: Filling missing ages in a customer dataset with the average age. • Data Transformation: Normalization, standardization, encoding categorical values. Example: Converting “Male/Female” into 0/1 for machine learning models. • Feature Engineering: Creating new features from existing ones. Example: Extracting “Day of Week” from a timestamp.
  • 85.
    85 Overview of DifferentData Science Techniques • 2. Exploratory Data Analysis (EDA) • Understanding data patterns and insights before modeling. • Statistical Analysis: Mean, median, variance, correlations. • Visualization: Histograms, scatter plots, heatmaps. Example: Checking correlation between “Advertising Spend” and “Sales.”
  • 86.
    86 Overview of DifferentData Science Techniques • 3. Supervised Learning Techniques • Used when we have labeled data (input + output). • Regression: Predicting continuous values. • Linear Regression, Polynomial Regression Example: Predicting house prices based on area, location, and rooms. • Classification: Predicting categories. • Logistic Regression, Decision Trees, Random Forests, SVM, Neural Networks Example: Classifying emails as “Spam” or “Not Spam.”
  • 87.
    87 Overview of DifferentData Science Techniques • 4. Unsupervised Learning Techniques • Used when we only have input data (no labels). • Clustering: Grouping similar data points. • K-Means, Hierarchical Clustering, DBSCAN Example: Customer segmentation in marketing. • Dimensionality Reduction: Reducing dataset complexity. • PCA (Principal Component Analysis), t-SNE Example: Reducing features in image recognition.
  • 88.
    88 Overview of DifferentData Science Techniques • 5. Semi-Supervised & Self-Supervised Techniques • Semi-Supervised Learning: Mix of labeled + unlabeled data. Example: Classifying medical images where only some are labeled. • Self-Supervised Learning: Model generates its own labels from data (common in NLP & Vision). Example: Predicting the next word in a sentence (used in GPT models).
  • 89.
    89 Overview of DifferentData Science Techniques • 6. Reinforcement Learning Techniques • Learning by interaction with an environment using rewards & penalties. • Value-Based: Q-Learning, Deep Q-Networks. • Policy-Based: Policy Gradient, Actor-Critic. Example: Training a robot to walk, or AI playing chess/Go.
  • 90.
    90 Overview of DifferentData Science Techniques • 7. Deep Learning Techniques • Advanced subset of ML, especially for unstructured data. • Neural Networks (ANNs): General prediction models. • Convolutional Neural Networks (CNNs): Image recognition, computer vision. • Recurrent Neural Networks (RNNs, LSTMs, GRUs): Sequential data (time series, text). • Transformers (BERT, GPT): NLP and large-scale AI models. Example: Image classification, text translation, chatbots.
  • 91.
    91 Overview of DifferentData Science Techniques • 8. Natural Language Processing (NLP) Techniques • For text & language-based data. • Text Preprocessing: Tokenization, stemming, lemmatization, stopword removal. • Text Representation: Bag of Words, TF-IDF, Word Embeddings (Word2Vec, GloVe). • Applications: Sentiment analysis, chatbots, machine translation.
  • 92.
    92 Overview of DifferentData Science Techniques • 9. Time Series Analysis Techniques • For data with a temporal order. • Decomposition: Trend, seasonality, residuals. • Forecasting Models: ARIMA, Prophet, LSTMs. Example: Stock market prediction, weather forecasting.
  • 93.
    93 Overview of DifferentData Science Techniques • 10. Big Data & Scalable Techniques • Handling large datasets that don’t fit into memory. • Distributed Computing: Hadoop, Spark. • Stream Processing: Apache Kafka, Flink. Example: Real-time fraud detection in banking.
  • 94.
    94 Skills needed tobe a Data Scientist
  • 95.
    95 Thank You! For anyquery/suggestions pls mail sagar.pandya@medicaps.ac.in
  • 96.
    0731 3111500, 07313111501 www.medicaps.ac.in A.B. Road, Pigdamber, Rau, Indore – 453331

Editor's Notes