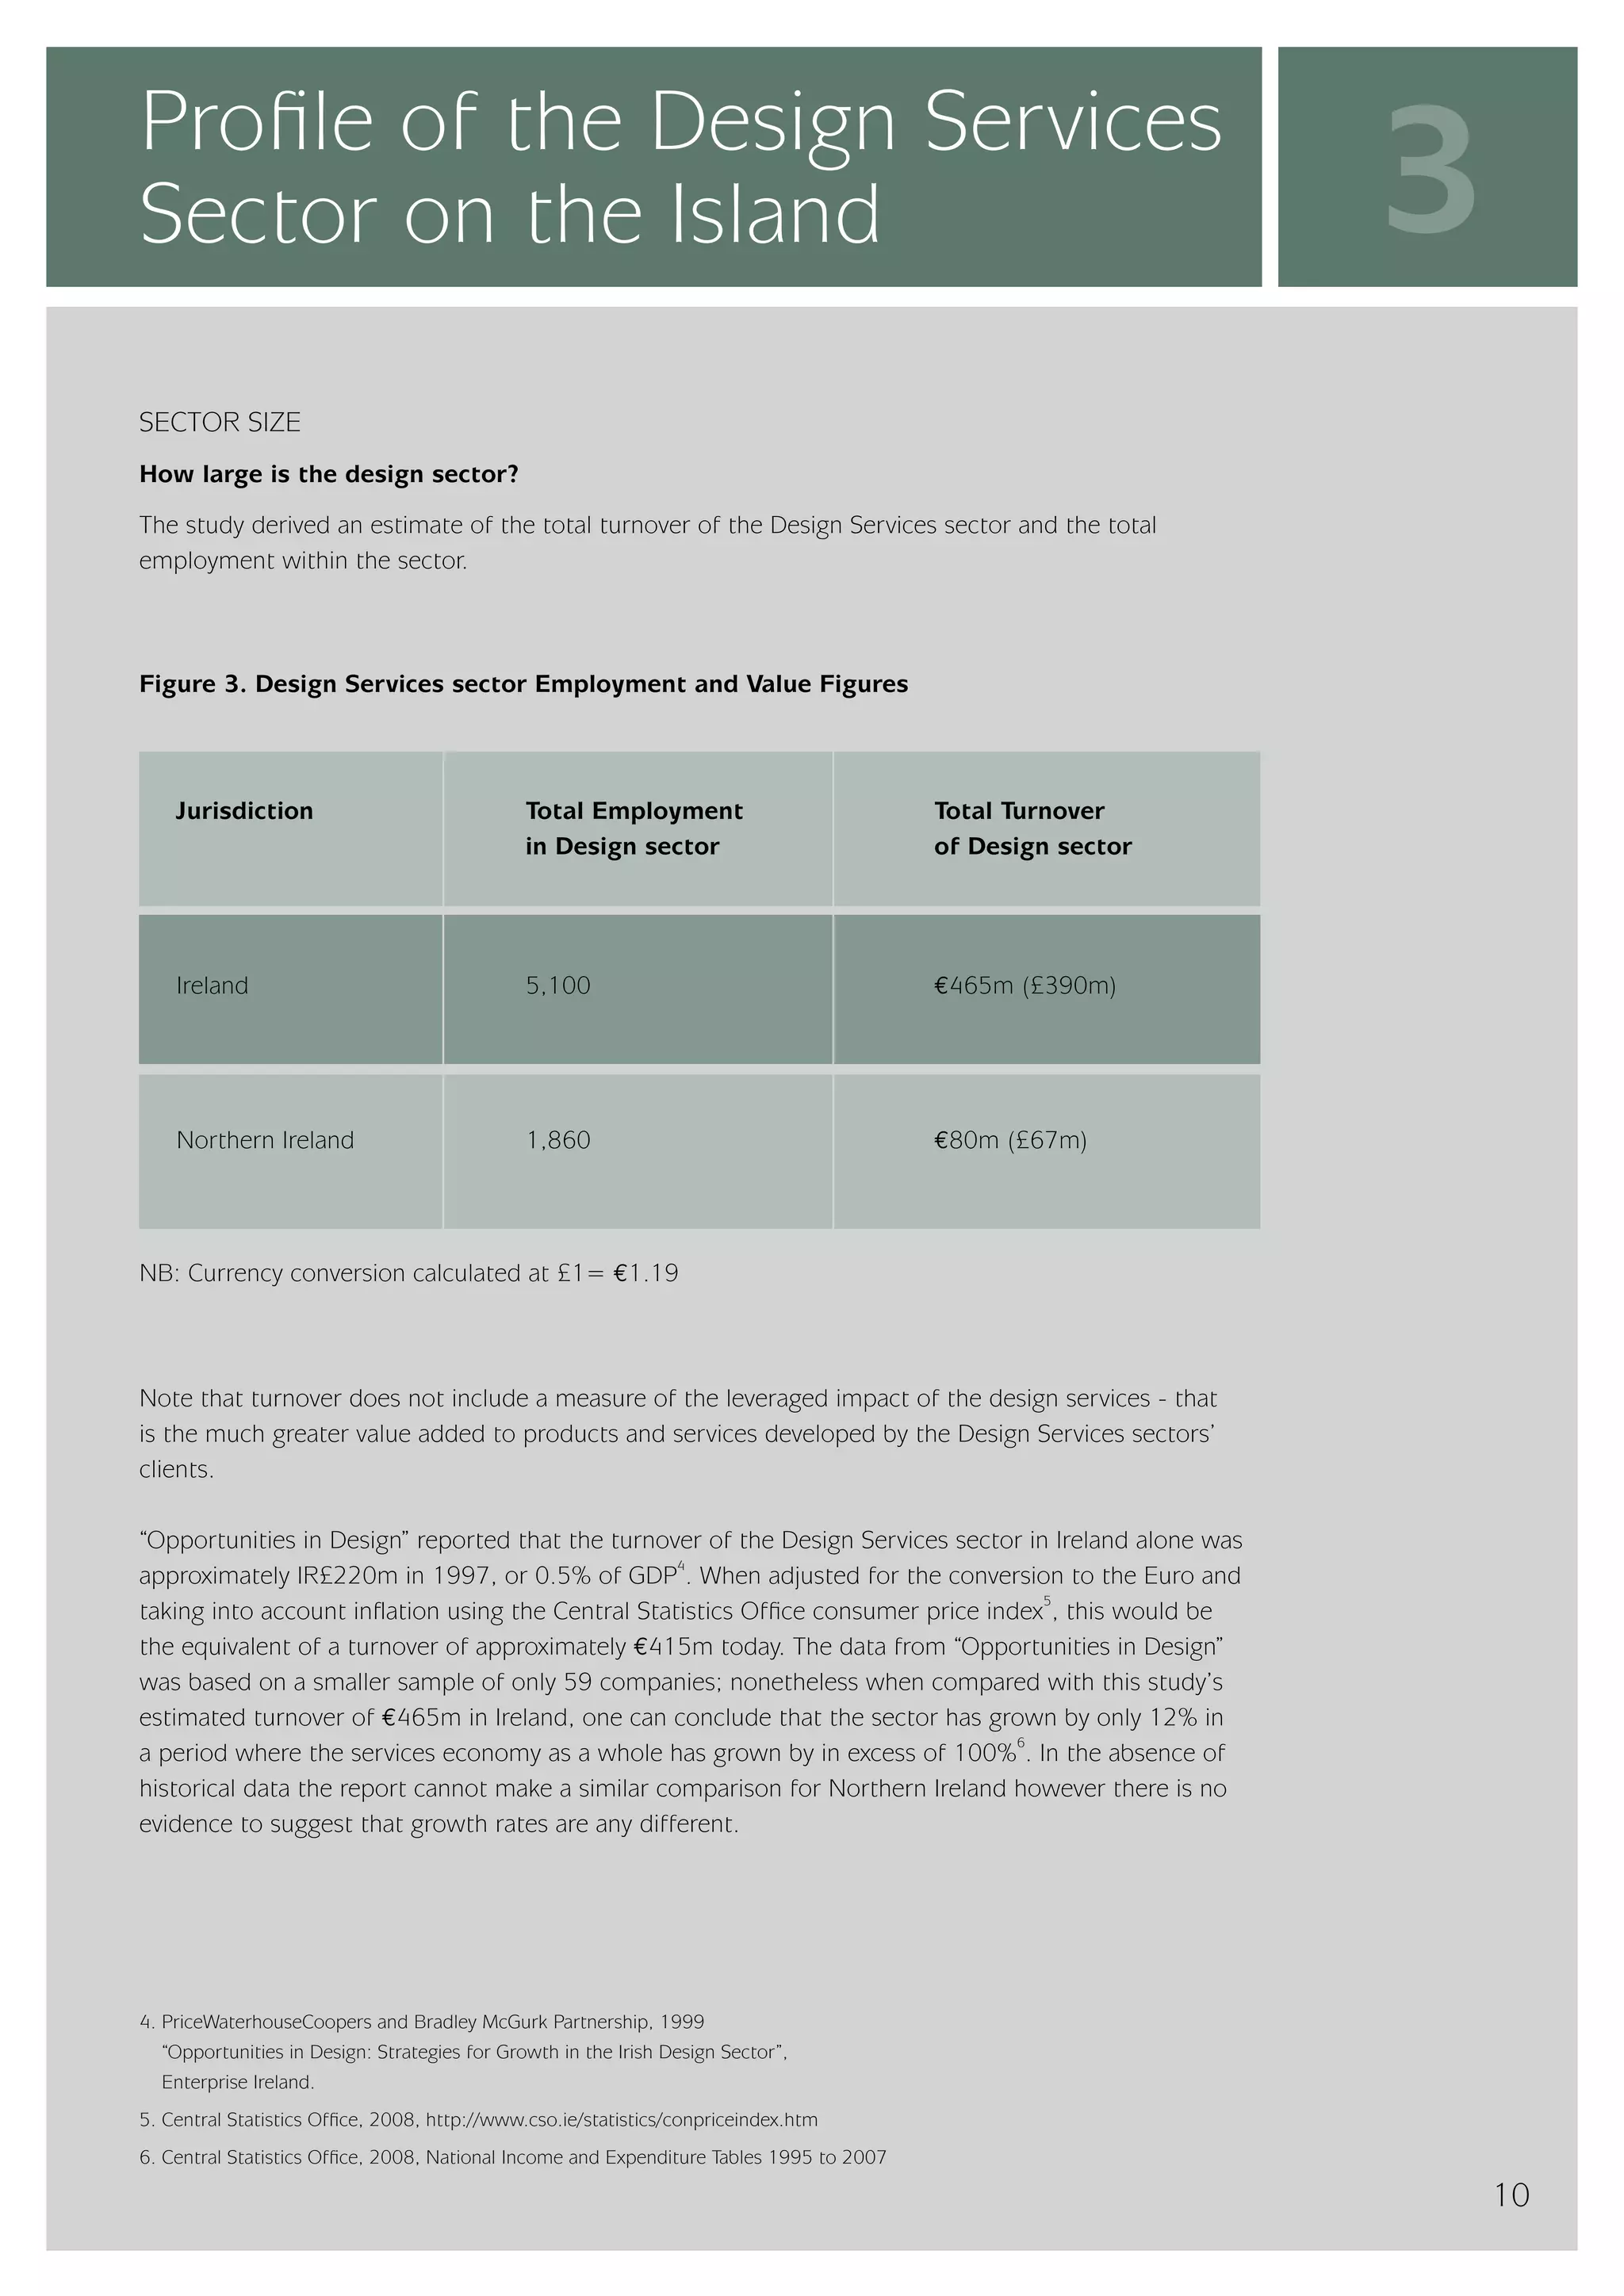
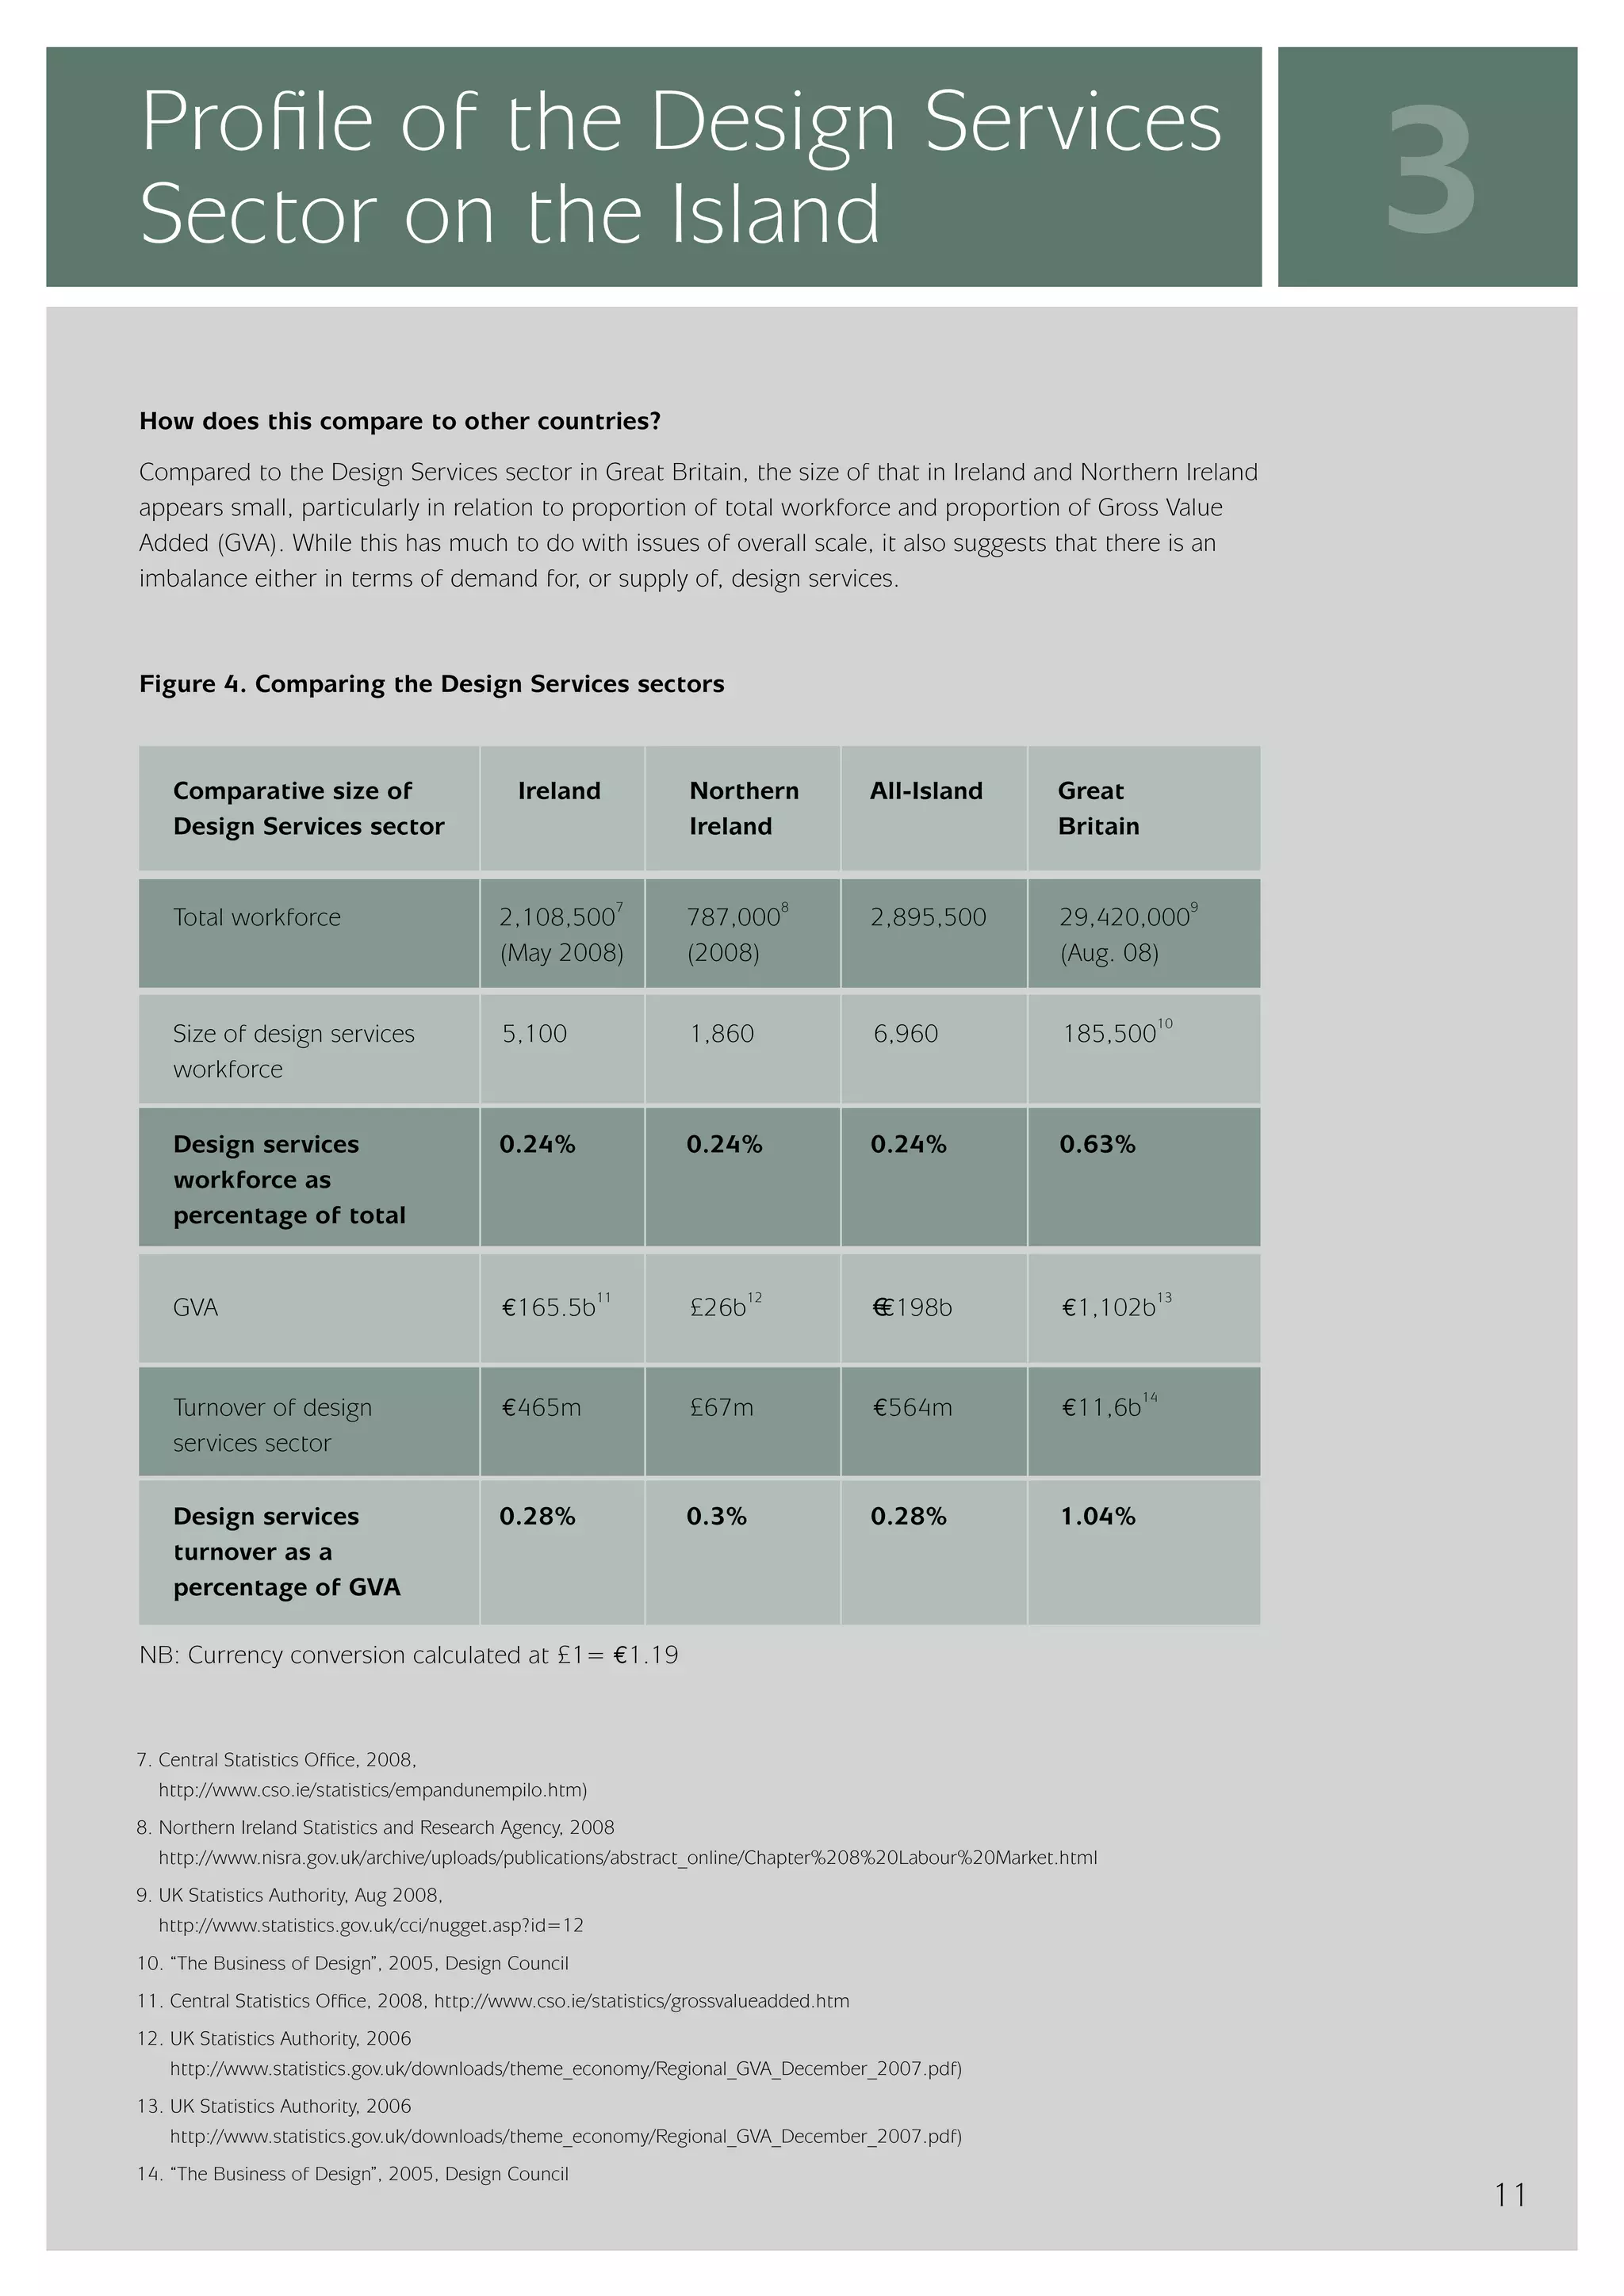
Call Girls In Sikandarpur Gurgaon ❤️8860477959_Russian 100% Genuine Escorts I...
InterTradeIreland - Design Services Sector
1. A Study of the
Design Services
Sector
on the Island of Ireland
2. Acknowledgements
InterTradeIreland would like to thank the
Centre for Design Innovation at the Institute
of Technology, Sligo, the members of the
Steering Panel, and the design service
providers and companies who participated
in the research for their assistance with
the development of this report.
STEERING PANEL MEMBERSHIP
InterTradeIreland
Enterprise Ireland
Institute of Designers in Ireland
Invest Northern Ireland
DISCLAIMER
InterTradeIreland is confident that the information and opinions contained in this document have been
compiled or arrived at by the authors from sources believed to be reliable and in good faith, but no
representation or warranty, express or implied, is made to their accuracy, completeness or correctness.
All opinions and estimates contained in this document constitute the author’s judgement as of the
date of this document and are subject to change without notice. This publication is intended to provide
general information to its readers concerning the subject matter of the publication. It is not intended to
provide a comprehensive statement of the subject matter of the publication and does not necessarily
reflect the views of InterTradeIreland. While care has been taken in the production of the publication,
no responsibility is accepted by InterTradeIreland for any omissions herein.
01
3. Contents
Foreword 4
1. Executive Summary 6
2. Introduction 7
3. Profile of the Design Sector on the Island 10
4. Analysis of Design Sector on the Island 31
5. Conclusions and Recommendations 33
02
4. Table of Figures
Figure 1 Survey Respondents by Type 8
Figure 2 Membership Status of Respondents 9
Figure 3 Design Services sector Employment & Value Figures 10
Figure 4 Comparing the Design Services sectors 11
Figure 5 Design Service Providers by Size 13
Figure 6 Types of Services Provided 14
Figure 7 Degree of Specialisation 15
Figure 8 The Role of Design in the Innovation Process 16
Figure 9 Usage Profile of Services 17
Figure 10 Design Services sector Clients 19
Figure 11 Sectoral Distribution of Clients 20
Figure 12 Geographic Distribution of Clients 20
Figure 13 Location of Main Competition 21
Figure 14 Drivers for lack of Cross-Border Activity 22
Figure 15 How the Sector Wins Business 23
Figure 16 Pitching for Business 24
Figure 17 Expected Change in Fee Income 26
Figure 18 Designer’s Perception of how Clients Value Design 27
Figure 19 Barriers to Success 29
Figure 20 Relevance of Business to Design Curriculum 30
03
5. Foreword
Countries that wish to increase their competitive advantage have turned to design as a mechanism
to add value to the goods and services that their indigenous companies produce. Recognising that
those companies that use design are more successful than those that do not, they invest significant
time and effort in promoting and supporting companies to overcome the barriers to its effective
use. Their goal is to increase the demand for design.
Increasing demand is only one side of the equation however; it is just as important that there should
be a broad and deep supply of designers who can provide services to business to help them add value
to their products and services. Without them, an economy can be starved of a key input that helps
to differentiate the goods and services it produces.
A range of interrelated issues governs the supply of designers who provide services to business.
The role of education is critical, as is the aspiration of the individual and ultimately the market for
their services. But there are also a number of other more subtle influences such as the role of the
industry support bodies, the nature of continuous professional development and the business
empathy of designers themselves.
This report examines the strengths and weaknesses of the sector and makes recommendations about
how to build on those strengths in order to stimulate one small but important part of the economy
that can create added-value to the economy as a whole. Given the similar barriers faced by the sector in
Northern Ireland and Ireland, it makes sense to adopt a cooperative approach to optimise the potential
of the sector.
Aidan Gough
DIRECTOR, STRATEGY & POLICY
InterTradeIreland
04
6. 1
Executive Summary
International evidence supports the observation
that there is a close correlation between the
use of design and the success of individual
businesses as well as the competitiveness of
entire countries.
Of equal concern is that the sector is not
Essentially, this report shows that the use of
contributing to the economy at the level where it
design by businesses across the island is an
could add most value. The majority of business is
under utilized source of competitive advantage.
confined to activity at the tail-end of the product
or service development process such as styling
This does not mean that the Design Services
or graphic design. This is not a problem in itself;
sector is not successful. On the contrary, within
it is an area where the island can consider itself
the sector’s own definition of success, things
a world leader although low-cost competitors
are looking good. Optimism is high, growth
are starting to enter the market. The problem is
prospects look good and the sector is populated
that there is limited business activity supporting
by highly skilled, experienced practitioners. The
early stage product development, co-creation or
problem comes when one considers the needs
open innovation; these are areas where overseas
of the wider economy and the ability of the
competition is limited and where the sector
Design Services sector to fulfil those needs.
can add greatest value to its clients particularly
within the service industry. This can best be
The starting point is that the sector is quite
addressed through education, not only of
small. Not only has it not grown much in the
clients to demand higher value services, but also
last 10 years, it is also proportionately about
through continuous professional development
one third the size of the sector in Great Britain
within the sector itself.
based either on proportion of total workforce
or proportion of Gross Value Added (GVA). This
Amongst the constraints to the sector, the
reflects primarily on demand for design services
existence of the border appears to limit the
but is also influenced by the desire for growth
opportunities that could be generated by fluent
amongst individual businesses and the nature of
exchange of business between Northern Ireland
what is a relatively isolated, “closed” community
and Ireland. Not only does this limit growth, it
of practitioners and clients. Strategies that can
also reduces the scope for generating innovative
encourage growth are important if the sector is
services that might arise in a more competitive
to scale up effectively.
environment. This is best addressed through
transparent access to information about business
opportunities both North and South.
05
7. 1
Executive Summary
The report contains four recommendations addressing the issues of promoting the value of design and
the growth and skills requirements of the Design Services sector.
These include:
1. Develop an all-island campaign which promotes the importance of design and
the intrinsic value it adds to business.
2. Assist the Design Services sector to expand into new markets and activities
across the island and further afield.
3. Support business training amongst design practitioners at both undergraduate
level and through continuous professional development.
4. Develop an all-island business programme to facilitate knowledge transfer
between the Design Services sector and the end-users of design.
06
8. 2
Introduction
This study is interested in the role of design
in so far as it adds value to other businesses.
THE REMIT OF THIS RESEARCH REPRESENTATIVENESS OF THE SURVEY
This report contains the results from a study This study is interested in the role of design
of the Design Services sector on the island of in so far as it adds value to other businesses;
Ireland. Field research was undertaken in April thus its focus is on organisations and
2008. The objective of this study was to provide individuals who provide Design Services* to
an evaluation of the Design Services sector in other businesses (or as a unit within their own
Northern Ireland and Ireland with conclusions organisation). The study deliberately omits those
and recommendations on strategies and actions areas of design that do not provide services to
that would address any perceived gaps in current business, not because they are not valuable in
provision that limit the capacity of the sector to themselves, but because its goal is to identify
play a full part in the economy. how best design can add greater value to the
entire economy.
To achieve these goals this study assesses the
size and make-up of the sector and interprets To achieve this, the research first concentrated
qualitative data to determine the strengths, on the memberships of the key professional
weaknesses, opportunities and threats that organisations that service and support the
currently prevail within the sector itself. Design sector: the Institute of Designers in
Ireland (IDI), the Graphic Design Business
Association (GDBA), the Institute of Creative
Advertising and Design (ICAD) and the Interiors
Association (IA). Membership of these
organisations includes sole traders and design
consultancies as well as in-house designers.
There are of course consultancies and sole
traders that can be validly classified as Design
Services sector participants but who are not
members of the professional organisations.
Therefore, to ensure representativeness across
the entire sector, businesses of this type
were also included. However, their lack of
involvement in professional organisations reflects
in many cases a lack of identification with the
sector. In order to reflect this, the percentage
of such businesses included in the study is
proportionately lower than for the memberships
of the professional bodies.
* Architects and architecture practices were not included in the survey. This was not because they do not provide services to other
businesses, clearly a significant proportion do. However it is harder to link the input of the architect with the added value created
for the final consumer of a product or service than for designers working in other disciplines.
07
9. 2
Introduction
Figure 1. Survey Respondents by Type
Sole trader / Freelance design consultant
35%
In-house design function
21%
Design consultancy
44%
In addition, it should be stressed that the • The broader definition of design overlaps
study is of the Design Services sector as and is sometimes considered part of
an entity and not a study of all services to strategic marketing, product development
business that could be classified as design. or engineering.
These two definitions are different because: In summary, an analysis of the participants
in the study compared to the overall make
• Individuals within organisations often up of the sector supports the thesis that
carry out design activities without explicit the conclusions drawn are representative of
association with the term designer. the entire sector.
• Design can be embedded and implicit
within another service. For instance,
design can be carried out on an ad
hoc basis within the development of
packaging or as part of the purchase
of advertising that might include design
of copy.
08
10. 2
Introduction
Figure 2. Membership Status of Respondents
Representation of IDI GDBA ICAD IA Respondents who were not
Membership of Professional Members of Professional
Organisations Organisations
% of respondents 42% 11% 14% 5% 28%
who are members
% of membership NA
52% 71% 88% 63%
who responded
DATA SOURCES
The results from the survey are augmented
This research used market research processes
by findings from qualitative interviews with
and techniques in line with the highest
14 client companies. The interviews focused
international standards. The survey fieldwork was
on the attitudes of these businesses to design
completed by Millward Brown Ulster using the
within the innovation and product/service
CATI (Computer Assisted Telephone Interviewing)
development context. The insights from these
system in a manner compliant with both the
qualitative interviews are used to enrich the
ISO9001 standard and The Interviewer Quality
quantitative results from the survey.
Control scheme. The findings in this report
are based on an analysis of 306 thirty minute
Insights are also included from previous research
telephone interviews. This sample was randomly
on the use of design in Ireland including “The
drawn from a population of over 1,535 contacts
1 2
Design Difference” , “Opportunities in Design”
from 835 organisations across the full spectrum
3
and “Design Management in Ireland” . This has
of design service providers in both Northern
allowed a partial examination of how the sector
Ireland and Ireland. The respondents were
has changed over the last decade and how its
distributed across both jurisdictions with 24% of
views align with those of its clients.
respondents based in Northern Ireland and 76%
based in Ireland; this is representative of the
sector size in both Northern Ireland and Ireland.
1. “The Design Difference” 2007,
Centre for Design Innovation
2. PriceWaterhouseCoopers and Bradley McGurk Partnership, 1999
“Opportunities in Design: Strategies for Growth in the Irish Design Sector”, Enterprise Ireland
3. Design Management in Ireland: A survey of business practice and perceptions”, 1999,
Bradley McGurk Partnership
09
11. 3
Profile of the Design Services
Sector on the Island
SECTOR SIZE
How large is the design sector?
The study derived an estimate of the total turnover of the Design Services sector and the total
employment within the sector.
Figure 3. Design Services sector Employment and Value Figures
Jurisdiction Total Employment Total Turnover
in Design sector of Design sector
Ireland 5,100 E465m (£390m)
Northern Ireland 1,860 E80m (£67m)
NB: Currency conversion calculated at £1= E1.19
Note that turnover does not include a measure of the leveraged impact of the design services - that
is the much greater value added to products and services developed by the Design Services sectors’
clients.
“Opportunities in Design” reported that the turnover of the Design Services sector in Ireland alone was
4
approximately IR£220m in 1997, or 0.5% of GDP . When adjusted for the conversion to the Euro and
5
taking into account inflation using the Central Statistics Office consumer price index , this would be
the equivalent of a turnover of approximately €415m today. The data from “Opportunities in Design”
was based on a smaller sample of only 59 companies; nonetheless when compared with this study’s
estimated turnover of €465m in Ireland, one can conclude that the sector has grown by only 12% in
6
a period where the services economy as a whole has grown by in excess of 100% . In the absence of
historical data the report cannot make a similar comparison for Northern Ireland however there is no
evidence to suggest that growth rates are any different.
4. PriceWaterhouseCoopers and Bradley McGurk Partnership, 1999
“Opportunities in Design: Strategies for Growth in the Irish Design Sector”,
Enterprise Ireland.
5. Central Statistics Office, 2008, http://www.cso.ie/statistics/conpriceindex.htm
6. Central Statistics Office, 2008, National Income and Expenditure Tables 1995 to 2007
10
12. 3
Profile of the Design Services
Sector on the Island
How does this compare to other countries?
Compared to the Design Services sector in Great Britain, the size of that in Ireland and Northern Ireland
appears small, particularly in relation to proportion of total workforce and proportion of Gross Value
Added (GVA). While this has much to do with issues of overall scale, it also suggests that there is an
imbalance either in terms of demand for, or supply of, design services.
Figure 4. Comparing the Design Services sectors
Comparative size of Ireland Northern All-Island Great Britain
All-Island Great
Design Services sector Ireland Britain
7 8 9
Total workforce 2,108,500 787,000 2,895,500 29,420,000
(May 2008) (2008) (Aug. 08)
10
Size of design services 5,100 1,860 6,960 185,500
workforce
Design services 0.24% 0.24% 0.24% 0.63%
workforce as
percentage of total
11 12 13
GVA £26b €€198b
€165.5b €1,102b
14
Turnover of design £67m
€465m €564m €11,6b
services sector
Design services 0.28% 0.3% 0.28% 1.04%
turnover as a
percentage of GVA
NB: Currency conversion calculated at £1= E1.19
7. Central Statistics Office, 2008,
http://www.cso.ie/statistics/empandunempilo.htm)
8. Northern Ireland Statistics and Research Agency, 2008
http://www.nisra.gov.uk/archive/uploads/publications/abstract_online/Chapter%208%20Labour%20Market.html
9. UK Statistics Authority, Aug 2008,
http://www.statistics.gov.uk/cci/nugget.asp?id=12
10. “The Business of Design”, 2005, Design Council
11. Central Statistics Office, 2008, http://www.cso.ie/statistics/grossvalueadded.htm
12. UK Statistics Authority, 2006
http://www.statistics.gov.uk/downloads/theme_economy/Regional_GVA_December_2007.pdf)
13. UK Statistics Authority, 2006
http://www.statistics.gov.uk/downloads/theme_economy/Regional_GVA_December_2007.pdf)
14. “The Business of Design”, 2005, Design Council
11
13. 3
Profile of the Design Services
Sector on the Island
What is the make-up of the sector?
International evidence demonstrates a linkage
between design, innovative capacity and
This study found that the sector is made up
economic performance. In a study by the New
of an established community of Design Service
Zealand Institute of Economic Research, a linear
providers. The majority of them are small
relationship was observed between the overall
organisations led by experienced designers
competitiveness of a country and the effective
whose business is driven by client relationships
15
use of design . Similarly, Designium, the
rather than specialisation of services provided;
New Centre of Innovations in Design prepared
they operate within a short-term
the Global Design Watch Index 2006. This
planning horizon.
study compared the effects of national design
programmes on national competitiveness in the
The Design Services sector is predominantly
design sector. The top 10 countries were listed
made up of smaller organisations. In both
as Japan, USA, Germany, Switzerland, Denmark,
jurisdictions, the largest proportion of
France, Finland, Sweden, Belgium, Austria.
companies are those with employees of
five or less. This is particularly the case in
At the company level, the UK Design Council
Northern Ireland, where no company reported
Report in 2005 has become the most cited
employing over 20 people. The Design Services
analysis to demonstrate the positive impact of
sector across the island operates in a manner
design on firms’ economic performance. The
typical of sectors populated by owner-run,
study tracked the share process of a group of
skill-driven service providers.
63 UK companies who use design strategically
and found that over the period 1994-2003,
these companies outperformed the FTSE 100
16
by 200%. The strong correlation between
competitiveness and use of design suggests
that for any country, developing a healthy design
sector is critical part of any competitiveness
policy. The island of Ireland, with a comparatively
small Design Services sector that has not
grown in line with the rest of the economy,
is poorly positioned to exploit this key area of
competitive advantage.
15. New Zealand Institute of Economic Research. 2003. “Making the case for added value through design”.
16. UK Design Council, 2005. Design Index 2005: “The Impact of Design on Stock Market Performance”
12
14. 3
Profile of the Design Services
Sector on the Island
Figure 5. Design Service Providers by Size
Size of design firms by number of employees (IRL)
>36%
>24%
>21%
10%
4% 4%
1 2-5 6-10 11-20 21-50 50+
Size of design firms by number of employees (NI)
46%
32%
17%
0% 0%
5%
1 2-5 6-10 11-20 21-50 50+
13
15. 3
Profile of the Design Services
Sector on the Island
SERVICES OFFERED
The distribution of fee incomes among the sole
traders and design consultancies (excluding in-
What services does the sector provide?
house designers) reinforces the skew towards
The survey asked respondents to self-classify
the smaller organisation. 87% of Northern
the disciplines in which their company
Ireland based businesses report fee incomes of
provides services. Most companies provide
less than €500,000 (£405,000). The comparable
services across more than one discipline type.
figure for Ireland-based businesses is 72%.
“Communications and Graphics” is the most
common cited type at 54% followed by “Interior
The size of the organisation does not appear
and Exhibition Design” at 38% and “Digital and
to imply any lack of experience however. In
Multi-Media” at 37%.
fact, the Design Services sector is run by highly
experienced designers with an average of 12
years of design experience with 19% having 20+
years and no significant difference between sole
traders and design consultancies.
Figure 6. Types of Services Provided
Digital & 37%
Multi-Media
Fashion &
3%
Textiles
Interior & 38%
Exhibition Design
Product &
19%
Industrial Design
Communications 54%
& Graphics
0 10 20 30 40 50 60
14
16. 3
Profile of the Design Services
Sector on the Island
Figure 7. Degree of Specialisation
% of respondents Comms & Product & Interior & Fashion & Digital &
All-Island Great Britain
active in both Graphics Industrial Exhibition Textiles Multi-Media
disciplines Design Design
Communications & 100% 12% 28% 3% 48%
Graphics
Product & Industrial 100%
34% 41% 5% 26%
Design
Interior & 100%
40% 21% 4% 31%
Exhibition Design
Fashion & Textiles 100%
63% 38% 63% 38%
Digital & Multi-Media 100%
70% 13% 32% 3%
The study also found that outside of the Communications and Graphics discipline, there is an absence
of specialisation among respondents across the disciplines. For example, respondents who identify
themselves as providing Product and Industrial Design services also provide services across a wide
range of other disciplines including Interior and Exhibition Design services (41%) and Communications
and Graphics services (34%). Similarly, 70% of those providing Digital and Multi-Media services state
that they also provide Communications and Graphics services. This is a link that is understandable given
the connection between these types of services. However, 32% are also active in Interior and Exhibition
Design services that are less obviously linked. This reinforces the conclusion that the primary driver for
business is the client relationship and not the service type.
This lack of specialisation has implications for the Design sector for although a business with less
specialisation will be able to extend its reach within its existing client base, it will find it harder to deliver
high degrees of effectiveness in specific disciplines and therefore develop a competitive advantage that
would allow it to trade more widely and seek new markets.
15
17. 3
Profile of the Design Services
Sector on the Island
Where does the sector add most value?
Design is inextricably linked to innovation and can add value across the entire innovation process.
By way of illustration, Figure 8. outlines a simplified model of the innovation process and identifies
the points at which design adds value to that process.
Figure 8. The Role of Design in the Innovation Process
(from a model created by the Centre for Design Innovation)
Commercialisation Process
Insight & idea Concept Market Product or
and marketing design
generation development testing service
creation
DESIGN’S ROLE AT EACH STAGE
Visualisation & Branding and Process
Industrial
Context specific
User research
narrative styling design
& service
prototyping
design
Convey complex Build loyalty with Reduce
Rapidly
Determine latent
ideas more the customer production
Determine
iterate simple
and unexpressed
fluently to teams, and differentiate costs to
how a product
prototypes with
needs through
investors & through create price
or service
users thereby
design research
customers by appearance advantage
functions and
“Failing sooner in
and co-creation.
using design performs.
order to succeed
more quickly”
Successful iterative innovation takes existing products and services
through the same process starting with user understanding.
16
18. 3
Profile of the Design Services
Sector on the Island
Respondents in the survey reported that the services they provide tend to be largely focused on styling
activities that take place late in the innovation process (to the right side of figure 8). There is a lower
representation of earlier stage design activities that are more strategic in nature, represented on the left
side of Figure 8.
Figure 9. Usage Profile of Services
For breakthrough
48%
innovation
For incremental
28%
innovation
14%
For process
For styling 78%
0% 10% 20% 30% 40% 50% 60% 70% 80%
17
In 1999, “Design Management in Ireland” reflected a similar usage profile when reporting on how design
was used by client companies. In that survey, 77% of larger client organisations used design for promotional
literature design while only 29% used it for product development.
18
The 2007 “Design Difference” study also reported that companies that used design for styling alone were
likely to underperform other companies, while those companies that used design at a more strategic level
were more likely to outperform their peers.
This suggests that the Design Services sector can add greatest value by supporting the innovation process
at an earlier, more strategic level. It also creates an opportunity for the Design Services sector to diversify its
offerings and provide more early-stage, strategic innovation support to clients. Not only does this area
of work generate more value for the client but it is also less likely to be subject to competition from low-cost
operators from overseas.
17. “Design Management in Ireland: A survey of business practice and perceptions”,
1999, Bradley McGurk Partnership
18. “The Design Difference”,
2007, Centre for Design Innovation
17
19. 3
Profile of the Design Services
Sector on the Island
Figure 10. Design Services sector Clients
Large companies
Other
(>100 employees)
(inc. public sector)
14%
13%
Medium SMEs
(50-99 employees)
12%
Micro-businesses
(<10 emploees)
27%
Small SMEs
(10-49 employees)
34%
CLIENTS
Who are the clients of the sector?
The Design sector on the island is primarily focused on providing services to micro-businesses and
small and medium sized enterprises (SMEs). 73% of respondents stated that their clients are from
these categories.The clients of the Design Services sector are mostly drawn from the middle of the
SME spectrum with 34% stating that their clients are in the 10 to 49 employee range. This distribution
is in-line with the general distribution of business size in Ireland as reported in the CSO’s 2007
19
report “Small Business in Ireland” which found that 82% of all businesses, and 98% of all service
businesses employed fewer than 50 people. Similarly in Northern Ireland according to the Department
20
of Enterprise Trade & Investment 98% of all businesses have less than 50 employees and 99.5% of
service businesses are classified as small.
This market focus on mid-sized SMEs - in contrast to developing clients amongst large businesses or
early stage SMEs - is in line with the emphasis the sector places on existing relationships over marketing
or cold-calling and the long-standing nature of those commercial relationships. It may also reflect
on a limited ambition within the sector to develop new markets and offerings.
19. “Small Business in Ireland”, 2007, Central Statistics Office20.
20. “Inter-Departmental Business Register”,
June 2008, Department of Enterprise Trade and Investment
18
20. 3
Profile of the Design Services
Sector on the Island
The conservative focus of the Design Services sector is
reinforced when considering the sectoral distribution of its
clients. While the full spectrum of sectors is represented
in the client base of the respondents, the manufacturing
sector is the largest user of design services followed by
sectors such as construction and agriculture. Traditionally,
these businesses tend to be more limited in the way they
use design, restricting it to late-stage styling and aesthetics.
This limits the potential for growth and innovation within
those markets. But this is not just a problem for the Design
Services sector; if these companies are not making effective
use of design, it is possible that they are not achieving the
highest level of competitive advantage. This in turn has a
much broader impact because of their importance to the
economy as a whole.
By contrast, the service sector as a whole, which generates
21
over 60% of added value within the economy in Ireland ,
does not make such wide use of Design Services; this
presents a significant opportunity for the Design Services
sector. In their 2008 report, “Catching the Wave”, Forfas
identify innovation within services as being poorly supported
with little knowledge about how to go about it and few
service companies having formal procedures for innovation.
The Design Services sector could exploit this gap and add
value to this sector by supporting innovation.
21. “Catching the Wave: A Services Strategy for Ireland” 2008, Forfas
19
21. 3
Profile of the Design Services
Sector on the Island
Figure 11. Sectoral Distribution of Clients
Sector of Clients
Rest of manufacturing 62%
Construction/property 30%
Wholesale/retail 24%
20%
Agriculture
Hospitality 19%
Government 15%
Financial 13%
11%
Education
Film & music 10%
10%
Advertising
Cultural/sport 8%
Health 8%
Manufacturing (hi-tech) 7%
IT 7%
5%
Posts/telecoms
Utilities 4%
0% 10% 20% 30% 40% 50% 60% 70% 80%
Where do the clients come from?
Survey respondents from both jurisdictions reported that the vast majority of clients came from their
home market (Northern Ireland, 86%; Ireland, 92%). The levels of cross-border clientele is small; 8%
for Northern Ireland companies and less than 1% for Ireland-based companies. Underlining the figure is
the finding that a similar proportion of companies, from across different locations in Ireland choose not
to look for business in Northern Ireland; of companies located in the Border region 38% did not look
for business in Northern Ireland with 36% of Dublin region respondents and 38% of respondents from
the rest of Ireland also choosing not to look for business in Northern Ireland.
Figure 12. Geographic Distribution of Clients
Client Northern Ireland Great Rest of EU Rest of
Location Ireland Britain World
Company
Location
Northern Ireland 86% 8% 4% 0% 2%
Ireland <1% 92% 3% 2% 3%
20
22. 3
Profile of the Design Services
Sector on the Island
COMPETITION
Where does competition come from?
The finding that Design Service providers tend to rely on local clients points to the existence of
a ‘community’ driven sector. This is reinforced by the evidence that competition for businesses in
Ireland (91%) and Northern Ireland (85%) comes from local companies. Northern Ireland companies
encounter slightly more competition, particularly from Great Britain.
From an island perspective, there is evidence of two neighbouring markets operating on a
back-to-back basis. Only 1% of Ireland based design companies cite those in Northern Ireland as
their main source of competition. The comparable figure for Northern Ireland companies is 3%.
Figure 13. Location of Main Competition
Client Northern Ireland Great Rest of EU Rest of
Location Ireland Britain World
Company
Location
Northern Ireland 85% 3% 11% 0% 1%
Ireland 1% 91% 3% 2% 3%
The research examined the reasons behind the low level of reported competition between these
two markets. The main inhibitor of cross-border competition for Ireland-based respondents is that
companies have simply not looked for such business (38%). Factors such as lack of success or
opportunity were cited as having comparatively low relevance. However, a very different pattern
emerged for Northern Ireland based respondents with only 12% citing “not looked for cross-border
business”. 34% chose not to pitch for cross-border business of which they were aware and 22%
looked but did not find anything to pitch for.
Figure 14. Drivers for lack of Cross-Border Activity
Drivers for lack of cross-border business activity Ireland NI
Pitched for cross-border business without success 14% 18%
Aware of cross-border business but chosen not to pitch 16% 34%
Looked for potential cross-border business but not found
anything to pitch for 7% 22%
Not looked for cross-border business 38% 12%
Don’t Knows 25% 14%
21
23. 3
Profile of the Design Services
Sector on the Island
Figure 14. Drivers for lack of Cross-Border Activity
% of respondents who indicated that the following driver Ireland NI
(or drivers) had influenced their decision not to look for
Ireland NI
cross-border business
Lack of understanding of different regulations and taxes 16% 18%
Lack of experience of doing cross-border business 27% 18%
Sufficient opportunity to grow the business in Northern Ireland or
Ireland without looking elsewhere 34% 9%
Existence of different currencies 20% 18%
Communication and travel inconvenience 22% 0%
Further investigation of the barriers to cross-border competition revealed that the highest proportion
of respondents from Ireland 34%, were largely satisfied with the current level of opportunity in their
local jurisdiction. Companies in Northern Ireland reported equally that factors such as regulations, taxes,
experience and currency differential impacted their decision.
It appears that Northern Ireland businesses have been more open to cross-border opportunities than
businesses in Ireland. However, a significant proportion of businesses from both jurisdictions still
perceive their own lack of understanding and experience as decisive factors in their decision not to
pursue cross-border business.
22
24. 3
Profile of the Design Services
Sector on the Island
How does the sector win business?
The strategy for winning business is focused on existing client networks. 63% of new clients and
projects are derived from personal recommendation with just 38% of respondents indicating that
they engage in marketing activity. This significant dependency on personal recommendation and
referral suggests a tendency towards a ‘closed’ community of design service providers and users.
This presents challenges for both emerging providers wishing to enter the market and for existing
providers wishing to extend beyond this community. The existence of such a community may also
limit the scope for innovation in the provision of services in that the evaluation of needs and
proposed solutions may be constrained by history and prior interaction, thus limiting the emergence
of a more diverse response, emanating from different ‘players’ in the sector.
While client recommendation provides the major source of new projects, designers still make a
significant number of pitches every year with varying levels of success.
Figure 15. How the sector Wins Business
Finding new clients and projects
33%
Referal services
Design competitions 8%
13%
Cold Calling
Recommendation by
63%
other clients
Networking 35%
38%
Marketing
0% 10% 20% 30% 40% 50% 60% 70% 80%
23
25. 3
Profile of the Design Services
Sector on the Island
Figure 16. Pitching for Business
Number of pitches made over last 12 months
35% 33%
30%
24% 23%
25%
19%
20%
20%
17%
15%
15% 12% 12%
9% 9%
10%
7%
5%
0%
0 between between between between more than
1 and 5 6 and 10 11 and 20 21 and 50 50
Number of successful pitches over last 12 months
40% 40%
35% 33%
30%
24%
25%
21%
19%
20%
15%
15% 12%
10% 10%
10% 7% 6%
5%
2%
0%
0 between between between between more than
1 and 5 6 and 10 11 and 20 21 and 50 50
IRL NI
24
26. 3
Profile of the Design Services
Sector on the Island
OUTLOOK
These pitches are predominantly paid for by
the client (55% of respondents in Ireland never
What is the mood of the sector?
pitch for free, compared to 48% in Northern
At the time of this study, Design Service
Ireland). Only 15% of respondents always pitch
providers described themselves as satisfied with
for free and 8% frequently pitch
the performance of their business and optimistic
for free.
for future growth. 25% of respondents were
completely satisfied with their business in terms
It is worth noting that the issue of free pitching
of growth opportunities, market maturity and
remains unresolved. Within the sector there
skills while a further 65% were quite satisfied.
is a significant movement to encourage all
This is also reflected in their expectation for
organisations to avoid free pitching since it
business growth over the coming year with
is believed to devalue the work of all designers.
companies in both jurisdictions expecting
The data shows that this has not been universally
increases in fee income (Ireland, 53%; Northern
implemented. The public sector creates
Ireland, 52%). A similar level of expected decline
confusion in this area because it will not pay for
was reported by companies in both jurisdictions
pitches since it is constrained by EU legislation
(Ireland, 16%; Northern Ireland, 15%). Seven
on the awarding of government contracts. Since
per cent of respondents in Ireland and 19% of
this is unlikely to change in the short term, a
Northern Ireland respondents stated that they
pragmatic approach would be to address the
did not know how their income would change
issue at an education and sector support body
in the coming year.
level to assist the Design Services sector to
agree protocols for how to bid successfully for
public sector business within existing regulations
“The main challenge is making government
but without incurring additional cost or
value design, and procurement has to be
devaluing the work.
corrected.” (Design survey respondent)
Figure 16. Pitching for Business
How often respondents pitch for free
60% 55%
48%
50%
40%
30%
22%
19%
20%
14% 16%
9%
10% 7%
0%
Always Frequently Occasionally Never
IRL NI
25
27. 3
Profile of the Design Services
Sector on the Island
Figure 17. Expected Change in Fee Income
Expected change in income Expected change in income
over the coming year (IRL) over the coming year (NI)
Decline Decline
No change No change
of between of between
Decline Decline
Increase Increase
24% 14%
10% and 20% 10% and 20%
of more of more
of more of more
12% 12%
than 20% than 20%
Increase Increase
than 20% than 20%
4% 3%
of between of between
10% 18%
10% and 20% 10% and 20%
43% 4%
The overall optimism of the outlook may not
Looking across the disciplines the optimism
reflect the change in economic circumstances
for growth comes largely from those companies
that occurred during the latter part of 2008.
offering Communications and Graphics and
The Design Services sector provides services
Digital and Multi-Media services. Those
that may be perceived as dispensable during an
companies active in Product and Industrial
economic downturn despite evidence to show
Design and Interior and Exhibition Design were
that it is important for companies to continue
most likely to report a decline in demand
investment in activities that retain competitive
for services.
advantage during such periods. It is likely that
the optimism within the Design Services sector
The decline in demand for Product and Industrial
will decline through 2009.
Design is particularly worrying because it is a
good indicator of whether, and how, companies
are creating new products. A decline in demand
suggests either that companies are developing
fewer new products or that they are outsourcing
their industrial design to another country or as
part of the manufacturing process.
26
28. 3
Profile of the Design Services
Sector on the Island
A similar approach to developing lasting business
How ambitious is the sector?
value can be seen in the lack of succession
To assess the level of business ambition (as
planning in place. Amongst design consultancies,
reflected in a wish to grow as businesses) within
49% didn’t know or hadn’t discussed the
the sector, the research examined the reaction of
future of the business after the exit of the
the businesses to the lack of available resources
original manager; this compared to 26% who
to service current business and their long-
saw continuation under the management
term strategy to diversify the services provided
of an existing partner and the low figure of
and succession planning. The conclusion of
12% who wanted to sell the business. Design
the research is that Design Services sector
Consultancies in Northern Ireland were less likely
businesses do not generally exhibit behaviours
to have a succession plan in place (57%) than
typical of ambitious growth-oriented businesses.
those in Ireland (47%). This may partially reflect
This is in contrast to the overall optimism in the
the smaller scale of the Northern Ireland based
sector of fee growth.
businesses as measured by total fee income.
Growth-driven businesses with an expectation
PERCEPTION
of increasing revenues will typically invest in
How do designers think their clients
developing their ability to deliver services. In the
perceive the sector?
context of the Design Services sector, a growth-
driven business would be expected to hire
When asked how they believed their clients
additional staff. However, this research found
perceived the Design Services sector,
that companies handle excess workload by
respondents said that they felt design was
increasing the amount of overtime worked,
critical to the success of their clients businesses;
(56% of respondents), hiring free-lancers (28%
in particular by helping to win new customers
of respondents), subcontracting to another
and by creating competitive advantage with 62%
agency (16% of respondents) or declining the
strongly agreeing in both cases.
work (11% of respondents). Many companies
employ a combination of these options to meet
the increased demand over resource availability.
Figure 18. Designer’s Perception of how Clients Value Design
Strongly Agree
agree
32%
Design is an important part of their strategic plans 58%
41%
Design is an important part of their approach to product development 48%
33%
Design is an important way to win new customers 62%
38%
Design is an important way to increase business with existing customers 54%
32%
Design provides competitive advantage 62%
41%
Your clients use design as a key part of the way they innovate 43%
27
29. 3
Profile of the Design Services
Sector on the Island
The communications gap that exists between
In general, designers agree that their
the design community and their clients is
contribution to clients, at a strategic level is
acknowledged by the Design Services sector
valuable. This contrasts with the findings from
22
itself. Only 58% of respondents believed that
the “The Design Difference” , study which
the design industry communicates the value of
reported that only 19% of SMEs who use design,
design to business well. This confirms a finding
use it strategically.
later in the report where 56% of Design Service
providers said that the lack of understanding of
This disparity in perceptions is stark and is
design by clients was their key barrier to success.
further reinforced by comments from Design
The clear message is that the sector could do
Services sector clients and non-clients.
more to better communicate the value of design
to its clients and better understand the value
delivered by the sector.
“You don’t pay for design explicitly; it is
“We have a …[colleague].. in marketing
the reason for the selection of an agency”
who does that as part of her job or the
(General Manager of International
publisher does it for us” (Logistics SME)
Software company)
“Design is something we have as a
“When we are ready to start marketing
checkpoint for the product team”
the product, we go to the design agency
(General Manager in International
with a tightly defined brief”
Software vendor)
(Senior manager in SME)
22. “The Design Difference”, 2007, Centre for Design Innovation
28
30. 3
Profile of the Design Services
Sector on the Island
BARRIERS
What are the barriers to success?
offerings for their clients. This is particularly
A number of barriers to achieving additional
acute amongst clients who perceive design as a
business growth were identified by respondents,
‘commodity’ as opposed to a process that can
in particular the lack of experienced staff and
have an impact at a strategic level.
availability of specific skills. However, in-line with
23
the findings of The Design Difference , the lack
Further investigation of the skills issue revealed
of understanding of the value of design among
that companies were largely satisfied with the
customers was seen as the most significant
level of expertise of employees recruited directly
factor holding back business growth.
from college/university or design consultancies in
terms of core design skills
The questionnaire did not examine competition
from overseas, however, during the interviews,
The majority of respondents were also satisfied
a significant number of respondents expressed
with the skills of available employees in the
concern about the impact of globalisation
individual design disciplines. The principal skills
and emergence of competition from low cost
weakness identified among existing employees
economies providing “blue-collar” design services
was understanding of client needs.
such as Computer-Aided Design (CAD). In this
environment, Design Services sector companies
This is backed up by responses from the Design
on the island, North and South, will need to find
Services sector clients who confirmed that
ways of creating more innovative, value-added
understanding their needs was a weakness
across the sector.
Figure 19. Barriers to Success
Service In-house
providers
Skills 52% 40%
Lack of sales skills
47% 41%
Lack of marketing skills
Staff 46% 38%
Lack of experienced staff
43% 35%
Lack of qualified staff
Market Lack of understanding of the value of design amoung customers 56% 51%
41% 29%
Lack of potential clients who use design businesses
37% 37%
Cost of pitching to new customers
Competition 26% 21%
Competition from in-house design teams
51% 38%
Competition from other design agencies
“Other external consultants usually have
“The hardest part is finding a designer
strong domain knowledge. Designers
who can understand”
usually have come from the graphic
(Senior manager in Engineering SME)
design wing and don’t have this”
(Senior manager in Multi-national)
29
23. “The Design Difference”, 2007, Centre for Design Innovation
31. 3
Profile of the Design Services
Sector on the Island
When considering on-going training or continuous professional development (CPD), respondents cited
“lack of time” (50%) and “cost” (25%) as the main barriers. These responses suggest that CPD is not
considered a priority within the sector; however, when placed against the threat from emerging markets
and the need to enhance the more strategic or business-focussed skills within the sector, CPD may
need to be prioritised in the future.
When queried about the relevance of business-oriented education as part of the 3rd level design
curriculum, 48% felt it was essential compared with only 5% who felt it was not relevant. This is in-line
with the identified gaps in the skills of the current employees.
This study also found that the design community is supportive of initiatives to bring the design industry
and design education together with a majority of respondents supporting a wide range of aspects of
industrial involvement in education.
Figure 20. Relevance of Business to Design Curriculum
Relevance of business to design curriculum %
Business skills are essential for all design students and should be taught as part of 48%
the design curriculum
Some business skills are useful as part of the design curriculum, but not all 41%
I’m not sure which business skills might be useful as part of the design curriculum 6%
Business skills are not relevant to design and do not fit in to the design curriculum 5%
Argee
Argee
strongly
37%
Increase the number of practicing designers working in education 54%
32%
Require fulltime lecturers to spend time working in industry 58%
30%
Require all students to complete extensive work experience 62%
38%
Create more employer based vocational training 48%
42%
Greater emphasis on multi-disciplinary collaboration 42%
35%
Design courses accredited by industry 52%
30
32. 4
Analysis of The Design
Services Sector on the Island
As is often the case with studies of individual organisations and discrete sectors, the strengths and
weaknesses are closely linked. The Design sector is made up of businesses that are successful
according to their own definition of success and believe that their business is likely to grow over the
coming year. However, this characterisation of success within the confines of a limited home-based
market is also the primary weakness of the sector.
Throughout the report there are some differences in findings between the Design Services sector in
Northern Ireland and Ireland. However, these differences are not significant and most likely reflect the
smaller scale of the sector in Northern Ireland. Therefore any conclusions about the Design Services
sector can be equally applied to both jurisdictions.
Weaknesses
Strengths
• The sector is locally focused with limited
• The Design Services sector is led by highly
interest in operating on a cross-border
experienced professionals;
or international basis. This also reflects
• The Design Services sector is well the market for design services - as few
established in providing styling and see competition arising from outside the
graphic design services; local market;
• The Design Services sector perceives • The sector suffers from a poor understanding
further opportunities for growth within of the scope and value of design services by
specific disciplines; clients. Sectoral expansion and growth will
be dependent upon innovation capabilities
• Design Services businesses operate within a
within industry.
community of service providers and clients
that is built on locality. This makes the sector • The sector is focused on the late stage design
more resistant to external competition; activities - in particular styling and graphic
design. It appears that the sector is unlikely
• The skill requirements of the Design Services
to extend outside of its’ established disciplines
sector in its current form are being serviced
without external stimulation; and
by available skills in the marketplace and
educational system; and • There is no significant evidence of long term
planning in design businesses. This will inhibit
• There is an openness to engagement with
the further growth of a significant proportion
education and skills development.
of existing businesses.
31
33. 4
Analysis of The Design
Services Sector on the Island
Threats
Opportunities
• The immaturity of demand for innovation
• There are significant opportunities for growth
among existing clients hampers the evolution
outside the area of styling and aesthetics
of the design sector as a whole.
through a wider appreciation of the role
design plays in the innovation process, i.e.
• The current make up of the sector, and the
that design can enhance value by turning user
dominant focus on specific styling and graphic
understanding into products and services that
design services may make it harder to extend
people want;
the reach of design services beyond lower
value activity;
• Alignment of the Design Services sector
agenda with those of development agencies
• The current success is dependent on particular
and a shared focus on high-growth sectors
client sectors of industry that are least
such as services or high-tech industries will
differentiated at a global level and hence most
help create a competitive advantage in
liable to displacement;
export markets;
• External competition will be able to compete
• The sector recognises the need to develop and
on price if the indigenous sector does not
extend business and client skills that will allow
increase the value differentiation it can deliver
designers to leverage their existing strengths.
to its customers;
The sector is open and willing to engage with
education to develop these skills; • The lack of growth focus within the Design
Services sector may lead to stagnation in the
• Encouraging greater collaboration between
sector as a whole; and
Northern Ireland and Ireland-based design
service providers will not only support general • There is an over-reliance on using over-time
efforts to increase cross-border commercial and free-lancers rather than creating new jobs.
activity, it will also provide a vehicle to develop
the sector’s ability to extend beyond its
immediate market; and
• There are opportunities to create a more
competitive sector which would in turn
increase standards and open up new markets.
32
34. 5
Conclusions and
Recommendations
Recommendation 1
This report has identified that the Design
Services sector on the island of Ireland is small
Develop an all-island campaign which promotes
and therefore the opportunities to positively
the importance of design and the intrinsic value
impact other sectors of the economy and the
it adds to business.
overall economy are not being optimised.
Action: Develop a collaborative all-island
Redressing this requires a holistic approach,
promotional campaign for design between the
from both a demand and supply side. The
key stakeholders of design in both jurisdictions.
goal is to work towards developing a business
The purpose of this activity is to:
culture that values design as an integral part
of the innovation process and an active design
• Create a uniform message to promote the
sector supporting all aspects of business.
value of design to business;
• Stimulate the demand for design services; and
Overall, these recommendations are tailored
to help achieve a larger, higher-skilled Design • Encourage businesses to use design more
Services sector that can contribute more fully strategically thus enhancing the innovativeness
to the economic success of both jurisdictions of their products and services.
on the island. They are broken down into
three areas addressing promotion of design,
growth and skills requirements of the Design Growth
Services sector.
The Design Services sector is small and needs
to grow and develop if it is to play a full part
Promoting Design
in creating a knowledge economy on the island
Design is a source of competitive advantage of Ireland.
for business that is not being utilized to
maximum effect. This is largely due to a poor The report has highlighted that the
understanding of the scope and value of design. manufacturing sector is the largest user of
This is the single biggest barrier facing the design services but other sectors within the
Design Service sector both North and South. economy and particularly the services sector
It is clear that individually, each of the design as a whole, which generates over 60% of added
support bodies and economic development 24
value within the economy in Ireland , does not
agencies in both jurisdictions work very hard make commensurate use of these services.
to promote the role of design and thereby, This presents a significant opportunity for the
build the market of potential clients. Indeed, Design Services sector.
the approach taken by agencies, North and
South is very similar, so the natural question In addition, the border appears to create a real
is how much more efficient and effective they barrier to trade that accentuates the closed
might be if a consistent and coordinated nature of the sector and limits the opportunity
all-island approach was taken. for competitive growth; mechanisms that create
greater transparency of opportunity will help to
mitigate the impact.
24. “Catching the Wave: A Services Strategy for Ireland” 2008, Forfas
33
35. 5
Conclusions and
Recommendations
Recommendation 3
Recommendation 2
Support business training amongst design
Assist the Design Services sector to expand into
practitioners at both undergraduate level and
new markets and activities across the island and
through continuous professional development.
further afield.
Action: Utilise the existing Skillnets mechanism
Action: Provide targeted assistance to help firms
to encourage business skills within the
develop the confidence and skills to pursue and
profession and develop an indigenous design
take up new markets and break the cycle of
management programme at Masters level that
dependence on traditional and/or local markets.
can be undertaken through distance learning.
Skills
Recommendation 4
The report has shown that the sector is made
Develop an all-island business programme to
up of experienced practitioners delivering high
facilitate knowledge transfer between the Design
quality work to a familiar group of clients. In this
Services sector and the end-users of design.
environment, the skills available from existing
sources are sufficient to meet current business
Action: Develop an all-island design programme
needs; however the report also shows that that
to support collaborative projects between the
environment is changing.
design sector, business and education which
focus on solving real business problems.
Creative talent is no longer sufficient in itself;
The programme would bring together Design
the ability better to understand client needs is
Service providers, design students, business
becoming increasingly important as a means
students and businesses around commercial
of securing business. In addition, the threat of
projects that teach design students about
low cost competition for basic design services
business, business students about managing
suggests that agencies and individuals will have
creativity and, at the same time, solve real
to find ways of adding value at a strategic level
problems within business.
across the entire product or service development
process in order to retain competitive advantage.
34