This project develops a method to interpolate evolutionary tracks for stars of arbitrary masses using existing published model grids. The method is tested and shown to be accurate to better than 1%. Given observations of a star's radius and luminosity, the project also determines if the star's properties place it in an ambiguous region, requiring a mass range, or a well-defined region, with a single mass value. A point-in-polygon algorithm is used to classify regions. This allows study of how stellar rotation affects evolution by comparing observational properties to evolutionary tracks.
This paper discusses trajectories to transfer a spacecraft between the Lagrangian points of the Sun-Earth system and the primaries. The planar circular restricted three-body problem is used to model the Sun-Earth system. Lamaître regularization is applied to avoid singularities during numerical integration of the Lambert's three-body problem. Families of transfer orbits between the Lagrangian points and primaries are presented, parameterized by transfer time. Results include plots of the energy and initial flight path angle versus transfer time, as well as example trajectories. Comparisons are made to transfers in the Earth-Moon system.
This document summarizes a study that used sigmoidal parameterization and Metropolis-Hasting (MH) inversion to estimate seismic velocity models from traveltime data. The key points are:
1) Sigmoidal functions were used to parameterize discontinuous velocity fields, allowing for sharp variations while maintaining continuity.
2) Ray tracing and the MH algorithm were used to invert traveltime data and estimate model parameters.
3) Tests on synthetic models showed the MH method produced higher resolution velocity models that better fit the observed traveltime data, compared to other global optimization methods like very fast simulated annealing.
Mapping spiral structure on the far side of the Milky WaySérgio Sacani
Little is known about the portion of the Milky Way lying beyond the Galactic center at distances
of more than 9 kiloparsec from the Sun. These regions are opaque at optical wavelengths
because of absorption by interstellar dust, and distances are very large and hard to measure.
We report a direct trigonometric parallax distance of 20:4þ2:8
2:2 kiloparsec obtained with the Very
Long Baseline Array to a water maser source in a region of active star formation. These
measurements allow us to shed light on Galactic spiral structure by locating the ScutumCentaurus
spiral arm as it passes through the far side of the Milky Way and to validate a
kinematic method for determining distances in this region on the basis of transverse motions.
Porosity prediction from seismic using geostatisticMelani Khairunisa
This document summarizes a study that used geostatistical methods to predict porosity logs from seismic attributes in the Pikes Peak oil field. Seven wells with density porosity logs close to a seismic line were analyzed in Emerge software. Various seismic attributes were evaluated, with the cosine instantaneous phase attribute showing the best correlation of 71% between predicted and actual porosity logs. A probabilistic neural network further improved the correlation to 86%. The predicted porosity volume along the seismic line helped identify zones of higher porosity that could be productive reservoirs.
D. Vulcanov, REM — the Shape of Potentials for f(R) Theories in Cosmology and...SEENET-MTP
This document summarizes a presentation given at the 2013 Balkan Workshop in Vrnjacka Banja, Serbia on using the "reverse engineering method" (REM) to model cosmology. The presentation reviewed REM and how it can be used to determine scalar field potentials from a given scale factor evolution. Computer programs for numerically and graphically processing REM with different cosmologies were discussed. Examples presented included regular and tachyonic potentials, and cosmology with non-minimally coupled scalar fields and f(R) gravity. Specific examples plotted potentials and scale factors for exponential and linear expansion universes. The presentation concluded with references for further reading on REM and its applications in cosmology.
Multi-Fidelity Optimization of a High Speed, Foil-Assisted Catamaran for Low ...Kellen Betts
This document discusses a multi-fidelity optimization of a high-speed, foil-assisted catamaran design for low wake in Puget Sound. It describes the motivation and objectives to reduce vessel wake through hull geometry optimization and lifting surfaces. It outlines the computational models, including a low-fidelity potential flow model and high-fidelity URANS model. It also discusses the multi-objective global optimization approach, including parameterization methods, interpolation methods, and optimization algorithms. The document notes that results will include the final optimized design and sea trial validation.
This document describes a method for correcting smear in images captured by frame transfer CCD cameras when there are significant changes in illumination between frames. Existing smear correction algorithms assume constant illumination, which is not always valid. The proposed method models smear using a matrix equation that accounts for variable illumination levels transitioning between frames. It was developed for fast polarimetric imaging but could benefit other applications involving highly variable scenes synchronized with detector readout.
Four experiments were conducted using a paint can hanging from a spring. In the first experiment, the paint can oscillated purely vertically, and PCA isolated this behavior in a single principal component, capturing 95% of the variance. When noise was added by shaking the cameras in the second experiment, PCA was still able to isolate the oscillatory behavior but with less accuracy. In experiments three and four where the paint can moved in both vertical and horizontal directions, PCA extracted the multidimensional behavior with the expected rank and reasonable accuracy.
Joint analysis of CMB temperature and lensing-reconstruction power spectraMarcel Schmittfull
Talk given by Marcel Schmittfull at The Pacific Cosmology Cooperative (PaCCo) 2014 workshop at JPL/Caltech, Pasadena
Topic: Combining CMB lensing reconstruction with CMB power spectrum measurements
Based on the paper http://arxiv.org/abs/1308.0286
Ill-posedness formulation of the emission source localization in the radio- d...Ahmed Ammar Rebai PhD
To contact the authors : tarek.salhi@gmail.com and ahmed.rebai2@gmail.com
In the field of radio detection in astroparticle physics, many studies have shown the strong dependence of the solution of the radio-transient sources localization problem (the radio-shower time of arrival on antennas) such solutions are purely numerical artifacts. Based on a detailed analysis of some already published results of radio-detection experiments like : CODALEMA 3 in France, AERA in Argentina and TREND in China, we demonstrate the ill-posed character of this problem in the sens of Hadamard. Two approaches have been used as the existence of solutions degeneration and the bad conditioning of the mathematical formulation problem. A comparison between experimental results and simulations have been made, to highlight the mathematical studies. Many properties of the non-linear least square function are discussed such as the configuration of the set of solutions and the bias.
GPS cycle slips detection and repair through various signal combinationsIJMER
Abstract: GPS Cycle slips affect the measured spatial distance between the satellite and the receiver, thus affecting the accuracy of the derived 3D coordinates of any ground station. Therefore, cycle slips must be detected and repaired before performing any data processing. The objectives of this research are to detect the Cycle slips by using various types of GPS signal combinations with graphical and statistical tests techniques, and to repair cycle slips by using average and time difference geometry techniques. Results of detection process show that the graphical detection can be used as a primary detection
technique whereas the statistical approaches of detection are proved to be superior. On the other hand, results of repairing process show that any trial can be used for such process except for the 1st and 2nd time differences averaging all data as they give very low accuracy of the cycle slip fixation.
This document discusses correlation dimension as a way to quantify the fractal structure of strange attractors in dynamical systems. It begins by introducing concepts like phase space, attractors, and strange attractors. It then defines fractals and fractal dimension. The correlation dimension is presented as a method to calculate fractal dimension using time series data. The process involves reconstructing the phase space, calculating delay time and correlation integral, and determining the slope of the correlation integral plot. This dimension can help distinguish different states or trends in a dynamical system based on changes in the attractor. As an example application, the document describes using correlation dimension to predict the direction a car will turn by analyzing acceleration time series data.
Towards the identification of the primary particle nature by the radiodetecti...Ahmed Ammar Rebai PhD
This document summarizes a study using the CODALEMA experiment to analyze radio signals from air showers and identify properties of primary cosmic ray particles. It describes:
1) Analyzing time delays of radio signals compared to a plane wavefront hypothesis and finding systematic deviations, indicating the wavefront is curved.
2) Developing a model to reconstruct the emission center position based on fitting time delays to a parabolic function dependent on curvature radius and antenna distances.
3) Applying the model to 450 selected CODALEMA events and comparing reconstructed shower core positions to results from other models, finding consistency.
“Solving QCD: from BG/P to BG/Q”. Prof. Dr. Attilio Cucchieri – IFSC/USP.lccausp
This document discusses quantum chromodynamics (QCD) and efforts to solve it using numerical simulations on supercomputers. It begins by explaining that quarks make up hadrons like protons and neutrons, and that QCD describes the strong force between quarks via the exchange of gluons. While QCD's mathematical formulation is similar to QED, gluons interact with each other due to their own color charge. This results in quark confinement and the non-perturbative nature of QCD at low energies. The document then outlines how Wilson introduced the idea of putting QCD on a lattice to prove confinement, and how modern numerical simulations evaluate QCD propagators and vertices on large lattices using Monte Carlo methods run in parallel on
This document discusses position and time plots used to analyze waves. A position plot shows displacement over position at a fixed time, allowing determination of amplitude and wavelength. A time plot shows displacement over time at a fixed position, allowing determination of time period. The document provides an example problem where given position and time plots, the wave equation is determined by extracting amplitude, wavelength, period, and phase constant.
Alexander Tsupko conducted an experimental study of turbulent processes in the solar wind plasma and Earth's magnetosphere using magnetic field data collected by the Cluster II spacecraft. He used three statistical methods - analysis of probability distribution functions, excess kurtosis, and self-similarity analysis - to investigate fluctuations in the magnetic field in different boundary regions. The results provided evidence of intermittent turbulence processes on timescales less than 1 second, while Gaussian statistics were observed on longer timescales. Turbulent diffusion in the regions was found to be superdiffusive in nature.
The document discusses methods for characterizing the global environment using satellite data to help overcome challenges posed by weather effects on missile defense sensors. It describes adjusting infrared imagery thresholds to approximate radar observations, extracting weather event boundaries, projecting 3D shapes onto a model Earth, and using an existing satellite constellation to provide continuous coverage. The goal is to determine visibility and sensor performance to optimize sensor selection and placement for missile defense.
Earth–mars transfers with ballistic escape and low thrust captureFrancisco Carvalho
This paper presents novel low-energy transfers between Earth and Mars that exploit natural dynamics and low-thrust propulsion. Ballistic escape orbits are designed using the Moon-perturbed Sun-Earth system, while low-thrust capture orbits are designed in the Sun-Mars system. The ballistic escape and low-thrust capture trajectories are matched and optimized in the full n-body problem to find efficient transfers between Earth and Mars orbits.
This document analyzes the distribution of solar irradiance ramp rates in Singapore. It finds that time-averaging solar irradiance data severely underestimates the number of ramp events by up to 50%. The study defines and compares different methods for detecting ramp events. It analyzes ramp events of different durations and magnitudes using both averaged and non-averaged solar irradiance data collected in Singapore. The results show that time-averaging data masks many short duration ramp events and leads to an underestimation of ramp rates compared to analyzing data without averaging.
The document summarizes a study on designing optimal transfer trajectories between Earth and the Moon using a combination of impulsive and continuous thrust. It formulates the trajectory optimization problem using the planar circular restricted three-body problem considering the gravitational attractions of Earth and Moon. The continuous and dynamic optimization is reformulated as a discrete problem using direct transcription and collocation methods, then solved using nonlinear programming. The results show different trajectory types can be obtained by varying design parameters, and all trajectories allow for ballistic lunar orbit capture without thrusting.
This document discusses Markov chain Monte Carlo (MCMC) based rendering techniques. It introduces Metropolis light transport (MLT) as the original MCMC rendering technique. It then summarizes several advanced MCMC techniques that build upon MLT, including Primary sample space MLT (PSSMLT), Multiplexed MLT, Manifold exploration (ME), Energy redistribution path tracing (ERPT), Population Monte Carlo ERPT, and Replica exchange light transport. These techniques aim to more efficiently sample light paths that follow the distribution of radiative energy in complex scenes.
This document summarizes the application of Marchenko imaging to a 2D ocean-bottom cable dataset from the North Sea Volve field. Marchenko redatuming estimates the full wavefield from virtual sources inside the medium using only surface reflection measurements and a smooth velocity model. The authors processed the field data to obtain an estimate of the reflection response required by Marchenko and used it to iteratively estimate focusing functions and retrieve up-going and down-going Green's functions. They performed target-oriented imaging at different depth levels using the redatumed reflection responses, revealing structures not visible in standard reverse-time migration. Marchenko imaging provides a way to obtain high-resolution images of target zones without needing detailed overburden models.
1. The document discusses using the method of double-time Green's functions to study vacancy migration in a one-dimensional lattice. It derives expressions for the diffusion coefficient that account for phonon scattering and lattice rearrangement during vacancy motion.
2. The diffusion coefficient D is expressed using linear response theory as a correlation function involving the velocity operator. Approximations are made to simplify the calculation, yielding expressions for D involving spectral intensities and the mass operator and damping of the double-time Green's function.
3. The spectral intensity is expressed in terms of the mass operator and damping, and the integral of the diffusion coefficient expression is evaluated in the nearest-neighbor approximation, resulting in final expressions for the diagonal and
Module 13 Gradient And Area Under A Graphguestcc333c
1) The document provides examples and questions related to calculating gradient, area under graphs, speed, velocity, and distance from speed-time and distance-time graphs.
2) It includes 10 multi-part questions testing concepts like calculating rate of change of speed, uniform speed, total distance, meeting time, and average speed.
3) Detailed step-by-step answers are provided for each question at the end to demonstrate how to apply the concepts to calculate the requested values.
Investigating Techniques to Model the Martian Surface UsingAlexander Reedy
1) The document describes techniques to model the Martian surface using principal component analysis and target transformation in order to isolate cloud spectral signatures from surface signatures.
2) It analyzes data from 1994-1995 using three methods - binning, k-means clustering, and picking vertices - to recover spectral endmembers from the target transformations.
3) It finds that picking the vertices method most consistently provides endmembers with good brightness ranges and distinct spectral shapes over both Martian oppositions, making it the best technique for modeling the Martian surface and isolating cloud signals.
Alex Rivas - Tank Stratification Model Using MATLABAlex Rivas
This document presents a MATLAB model for simulating propellant tank stratification over a 6-month mission. The model treats the tank as a solid sphere and uses separation of variables to solve the heat equation. It calculates eigenvalues and characteristic values to determine the temperature distribution as a function of time and radius. The model was used to simulate LO2 and LCH4 tanks under different heat leak conditions. Results showed maximum stratification of 25K for LO2 with a high heat leak, but generally low stratification that does not approach boiling points. The model can help determine if active mixing is needed in propellant tanks for future space missions.
This document provides information about constants and laws related to gravitational fields that commonly appear on exams for the PAU (University Access Test) in Castilla y León, Spain. It includes the values of gravitational acceleration on Earth (g0), Earth's radius (RT), Earth's mass (MT), and the gravitational constant (G). It then provides example problems applying Kepler's laws and Newton's law of universal gravitation to calculate orbital properties of planets, moons, and satellites. Sample problems calculate orbital periods, velocities, distances, and gravitational accelerations for bodies in the solar system like Jupiter, Mars, Mercury, the Moon, and artificial satellites.
A new study developed three algorithms to automatically determine the boundaries of scatter plots used in the triangle method for estimating evapotranspiration from satellite data. The algorithms were tested on data from northern China and showed improved consistency over manual boundary selection. Algorithm II performed best by separating scatter plots into upper and lower regions before boundary fitting. The new automatic method enables more objective and repeatable evapotranspiration estimates at regional scales from remote sensing data.
This document contains instructions and problems related to a physics exam on relativistic particles and superconducting magnets. It includes 4 problems:
1) Describing the motion of a relativistic particle subject to an attractive central force, including graphs of position vs time and momentum vs position.
2) Modeling a meson as two quarks with a central attractive force, and graphing their motion.
3) Transforming the motion graphs from problem 2 into a different reference frame moving at 0.6c.
4) Calculating the energy of a meson moving at 0.6c as observed in the lab frame.
The document provides answer sheets for the problems and specifies the
This document compares and contrasts two methods of parameterizing angular distributions: the helicity formalism and the partial wave formalism. It provides several cookbook formulae for angular distributions frequently encountered in analyses. As an example, it shows how CP violation can be observed in angular distributions. It also addresses how conservation of angular momentum is handled in the helicity formalism versus the partial wave formalism.
Jupiter’s atmospheric jet streams extend thousands of kilometres deepSérgio Sacani
The document summarizes findings from measurements taken by the Juno spacecraft orbiting Jupiter. It finds that Jupiter's atmospheric jet streams extend thousands of kilometers deep, likely to depths where magnetic dissipation occurs around 3,000 km. By inverting gravity measurements, the researchers calculated the most likely vertical profile of deep atmospheric flows, with an exponential decay depth of around 1,500 km. Considering angular momentum, the deep flows are likely driven by a balance between drag from Lorentz forces and eddy momentum fluxes near the cloud level.
This poster was created in LaTeX on a Dell Inspiron laptop with a Linux Fedora Core 4 operating system. The background image and the animation snapshots are dxf meshes of elastic waveform solutions, rendered on a Windows machine using 3D Studio Max.
This document summarizes research on two-dimensional solid-state nutation NMR experiments for determining quadrupole parameters of half-integer quadrupolar nuclei. It presents:
1) A complete series of simulated nutation spectra for spins I = 3/2 to I = 5 calculated using density matrix formalism to serve as fingerprints for parameter determination.
2) Applications of the method to 27Al in spodumene and 45Sc in Sc2(SO4)3 to determine their quadrupole parameters by comparing experimental spectra to simulations.
3) Discussion of experimental aspects like resonance offset and magic angle spinning and how they affect the nutation spectra.
This document presents a novel algorithm for classifying signals (glitches) that arise in gravitational wave channels of the Laser Interferometer Gravitational-Wave Observatory (LIGO). The algorithm uses Kohonen Self Organizing Feature Maps and discrete wavelet transform coefficients to classify glitches based on their morphology and other parameters like signal-to-noise ratio and duration. This low-latency algorithm aims to help the LIGO detector characterization group identify and mitigate noise sources more quickly.
The document presents a new approach for dynamic analysis of parallel manipulators based on the principle of virtual work. It illustrates the approach using a simple 4-bar linkage example, calculating the inertial forces and moments, virtual displacements, and input torque. It then generalizes the approach for dynamic analysis of a 6 degree-of-freedom parallel manipulator like a Gough-Stewart platform. The approach leads to faster computation than traditional Newton-Euler methods by not requiring calculation of constraint forces between links.
This document discusses how catastrophe theory can be applied to physical systems using manifolds. It describes how potential functions from catastrophe theory can influence manifolds that are locally like 4D Euclidean space. Seven catastrophes from Thom's theory are structurally stable. In addition to catastrophe manifolds, other manifolds can arise without polar singularities or with a diagonal metric. Complex numbers, quaternions, and octonions can be added to the 4D space. Applications to bifurcations, measuring frames, particles, and effects on systems are discussed.
This paper analyzes the synchronization of metronomes through mathematical modeling and physical experimentation. It discusses:
1) The history of observations of metronome synchronization and introduces the Kuramoto model, a mathematical framework used to study synchronization.
2) Derives equations of motion for 2 metronomes on a movable surface and nondimensionalizes the equations. Simulations show synchronization occurs when natural frequencies are similar.
3) Presents results of experiments confirming synchronization between 2 metronomes occurs quickly when frequencies are similar, but a bifurcation prevents synchronization if frequencies differ too much.
This report summarizes research on the motion of particles on curves. It was found that:
1) The center of mass of 3 points on an ellipse that divide its perimeter evenly traces out a smaller ellipse of the same shape.
2) The maximum product of distances between 4 particles on a rectangle occurs when particles are at the corners for small rectangles, but 2 particles move off the corners for larger rectangles.
3) The center of mass of n points on a square that divide its perimeter evenly traces out a smaller square n times for odd n, and remains fixed at the center for even n.
IJERA (International journal of Engineering Research and Applications) is International online, ... peer reviewed journal. For more detail or submit your article, please visit www.ijera.com
This document summarizes a research paper that proposes a new metamaterial shape called "Criss-Cross" and analyzes its electromagnetic properties. The paper derives mathematical models to calculate the reflection and transmission coefficients for electromagnetic waves propagating through stratified negative index metamaterials. Simulation results show the Criss-Cross metamaterial exhibits negative effective permittivity and permeability over a wide frequency band of 5-9 GHz. This 61.53% negative parameter bandwidth is significantly larger than other metamaterial designs. Finally, the paper proposes using a 3x3 array of the Criss-Cross unit cell to miniaturize the size of a rectangular patch antenna.
The objective of this paper is to study how the selection of the coil and the frequency affects the received modes in
guided Lamb waves, with the objective of analyzing the best configuration for determining the depth of a given
defect in a metallic pipe with the minimum error. Studies of the size of the damages with all the extracted
parameters are then used to propose estimators of the residual thickness, considering amplitude and phase
information in one or several modes. Results demonstrate the suitability of the proposal, improving the estimation of
the residual thickness when two simultaneous modes are used, as well as the range of possibilities that the coil and
frequency selection offers.
This document discusses extrapolation, which is constructing new data points outside a range of known data points based on trends. It summarizes extrapolation techniques, assumptions, advantages, and disadvantages. Common extrapolation methods include least squares curve fitting, smooth curve fitting, and nonlinear curve fitting using the Levenberg-Marquardt algorithm. Examples of extrapolation applications given are weather and hurricane forecasting, geophysical modeling, and estimating properties at temperature and depth extremes.
11 - 3
Experiment 11
Simple Harmonic Motion
Questions
How are swinging pendulums and masses on springs related? Why are these types of
problems so important in Physics? What is a spring’s force constant and how can you measure
it? What is linear regression? How do you use graphs to ascertain physical meaning from
equations? Again, how do you compare two numbers, which have errors?
Note: This week all students must write a very brief lab report during the lab period. It is
due at the end of the period. The explanation of the equations used, the introduction and the
conclusion are not necessary this week. The discussion section can be as little as three sentences
commenting on whether the two measurements of the spring constant are equivalent given the
propagated errors. This mini-lab report will be graded out of 50 points
Concept
When an object (of mass m) is suspended from the end of a spring, the spring will stretch
a distance x and the mass will come to equilibrium when the tension F in the spring balances the
weight of the body, when F = - kx = mg. This is known as Hooke's Law. k is the force constant
of the spring, and its units are Newtons / meter. This is the basis for Part 1.
In Part 2 the object hanging from the spring is allowed to oscillate after being displaced
down from its equilibrium position a distance -x. In this situation, Newton's Second Law gives
for the acceleration of the mass:
Fnet = m a or
The force of gravity can be omitted from this analysis because it only serves to move the
equilibrium position and doesn’t affect the oscillations. Acceleration is the second time-
derivative of x, so this last equation is a differential equation.
To solve: we make an educated guess:
Here A and w are constants yet to be determined. At t = 0 this solution gives x(t=0) = A,
which indicates that A is the initial distance the spring stretches before it oscillates. If friction is
negligible, the mass will continue to oscillate with amplitude A. Now, does this guess actually
solve the (differential) equation? A second time-derivative gives:
Comparing this equation to the original differential equation, the correct solution was
chosen if w2 = k / m. To understand w, consider the first derivative of the solution:
−kx = ma
a = −
k
m
⎛
⎝
⎜⎜⎜⎜
⎞
⎠
⎟⎟⎟⎟
x
d 2x
dt 2
= −
k
m
x x(t) = A cos(ωt)
d 2x(t)
dt 2
= −Aω2 cos(ωt) = −ω2x(t)
James Gering
Florida Institute of Technology
11 - 4
Integrating gives
We assume the object completes one oscillation in a certain period of time, T. This helps
set the limits of integration. Initially, we pull the object a distance A from equilibrium and
release it. So at t = 0 and x = A. (one.
Similar to Interpolating evolutionary tracks of rapidly rotating stars - paper (20)
Building Production Ready Search Pipelines with Spark and MilvusZilliz
Spark is the widely used ETL tool for processing, indexing and ingesting data to serving stack for search. Milvus is the production-ready open-source vector database. In this talk we will show how to use Spark to process unstructured data to extract vector representations, and push the vectors to Milvus vector database for search serving.
Your One-Stop Shop for Python Success: Top 10 US Python Development Providersakankshawande
Simplify your search for a reliable Python development partner! This list presents the top 10 trusted US providers offering comprehensive Python development services, ensuring your project's success from conception to completion.
Best 20 SEO Techniques To Improve Website Visibility In SERPPixlogix Infotech
Boost your website's visibility with proven SEO techniques! Our latest blog dives into essential strategies to enhance your online presence, increase traffic, and rank higher on search engines. From keyword optimization to quality content creation, learn how to make your site stand out in the crowded digital landscape. Discover actionable tips and expert insights to elevate your SEO game.
This presentation provides valuable insights into effective cost-saving techniques on AWS. Learn how to optimize your AWS resources by rightsizing, increasing elasticity, picking the right storage class, and choosing the best pricing model. Additionally, discover essential governance mechanisms to ensure continuous cost efficiency. Whether you are new to AWS or an experienced user, this presentation provides clear and practical tips to help you reduce your cloud costs and get the most out of your budget.
Generating privacy-protected synthetic data using Secludy and MilvusZilliz
During this demo, the founders of Secludy will demonstrate how their system utilizes Milvus to store and manipulate embeddings for generating privacy-protected synthetic data. Their approach not only maintains the confidentiality of the original data but also enhances the utility and scalability of LLMs under privacy constraints. Attendees, including machine learning engineers, data scientists, and data managers, will witness first-hand how Secludy's integration with Milvus empowers organizations to harness the power of LLMs securely and efficiently.
Ivanti’s Patch Tuesday breakdown goes beyond patching your applications and brings you the intelligence and guidance needed to prioritize where to focus your attention first. Catch early analysis on our Ivanti blog, then join industry expert Chris Goettl for the Patch Tuesday Webinar Event. There we’ll do a deep dive into each of the bulletins and give guidance on the risks associated with the newly-identified vulnerabilities.
Dandelion Hashtable: beyond billion requests per second on a commodity serverAntonios Katsarakis
This slide deck presents DLHT, a concurrent in-memory hashtable. Despite efforts to optimize hashtables, that go as far as sacrificing core functionality, state-of-the-art designs still incur multiple memory accesses per request and block request processing in three cases. First, most hashtables block while waiting for data to be retrieved from memory. Second, open-addressing designs, which represent the current state-of-the-art, either cannot free index slots on deletes or must block all requests to do so. Third, index resizes block every request until all objects are copied to the new index. Defying folklore wisdom, DLHT forgoes open-addressing and adopts a fully-featured and memory-aware closed-addressing design based on bounded cache-line-chaining. This design offers lock-free index operations and deletes that free slots instantly, (2) completes most requests with a single memory access, (3) utilizes software prefetching to hide memory latencies, and (4) employs a novel non-blocking and parallel resizing. In a commodity server and a memory-resident workload, DLHT surpasses 1.6B requests per second and provides 3.5x (12x) the throughput of the state-of-the-art closed-addressing (open-addressing) resizable hashtable on Gets (Deletes).
Driving Business Innovation: Latest Generative AI Advancements & Success StorySafe Software
Are you ready to revolutionize how you handle data? Join us for a webinar where we’ll bring you up to speed with the latest advancements in Generative AI technology and discover how leveraging FME with tools from giants like Google Gemini, Amazon, and Microsoft OpenAI can supercharge your workflow efficiency.
During the hour, we’ll take you through:
Guest Speaker Segment with Hannah Barrington: Dive into the world of dynamic real estate marketing with Hannah, the Marketing Manager at Workspace Group. Hear firsthand how their team generates engaging descriptions for thousands of office units by integrating diverse data sources—from PDF floorplans to web pages—using FME transformers, like OpenAIVisionConnector and AnthropicVisionConnector. This use case will show you how GenAI can streamline content creation for marketing across the board.
Ollama Use Case: Learn how Scenario Specialist Dmitri Bagh has utilized Ollama within FME to input data, create custom models, and enhance security protocols. This segment will include demos to illustrate the full capabilities of FME in AI-driven processes.
Custom AI Models: Discover how to leverage FME to build personalized AI models using your data. Whether it’s populating a model with local data for added security or integrating public AI tools, find out how FME facilitates a versatile and secure approach to AI.
We’ll wrap up with a live Q&A session where you can engage with our experts on your specific use cases, and learn more about optimizing your data workflows with AI.
This webinar is ideal for professionals seeking to harness the power of AI within their data management systems while ensuring high levels of customization and security. Whether you're a novice or an expert, gain actionable insights and strategies to elevate your data processes. Join us to see how FME and AI can revolutionize how you work with data!
HCL Notes und Domino Lizenzkostenreduzierung in der Welt von DLAUpanagenda
Webinar Recording: https://www.panagenda.com/webinars/hcl-notes-und-domino-lizenzkostenreduzierung-in-der-welt-von-dlau/
DLAU und die Lizenzen nach dem CCB- und CCX-Modell sind für viele in der HCL-Community seit letztem Jahr ein heißes Thema. Als Notes- oder Domino-Kunde haben Sie vielleicht mit unerwartet hohen Benutzerzahlen und Lizenzgebühren zu kämpfen. Sie fragen sich vielleicht, wie diese neue Art der Lizenzierung funktioniert und welchen Nutzen sie Ihnen bringt. Vor allem wollen Sie sicherlich Ihr Budget einhalten und Kosten sparen, wo immer möglich. Das verstehen wir und wir möchten Ihnen dabei helfen!
Wir erklären Ihnen, wie Sie häufige Konfigurationsprobleme lösen können, die dazu führen können, dass mehr Benutzer gezählt werden als nötig, und wie Sie überflüssige oder ungenutzte Konten identifizieren und entfernen können, um Geld zu sparen. Es gibt auch einige Ansätze, die zu unnötigen Ausgaben führen können, z. B. wenn ein Personendokument anstelle eines Mail-Ins für geteilte Mailboxen verwendet wird. Wir zeigen Ihnen solche Fälle und deren Lösungen. Und natürlich erklären wir Ihnen das neue Lizenzmodell.
Nehmen Sie an diesem Webinar teil, bei dem HCL-Ambassador Marc Thomas und Gastredner Franz Walder Ihnen diese neue Welt näherbringen. Es vermittelt Ihnen die Tools und das Know-how, um den Überblick zu bewahren. Sie werden in der Lage sein, Ihre Kosten durch eine optimierte Domino-Konfiguration zu reduzieren und auch in Zukunft gering zu halten.
Diese Themen werden behandelt
- Reduzierung der Lizenzkosten durch Auffinden und Beheben von Fehlkonfigurationen und überflüssigen Konten
- Wie funktionieren CCB- und CCX-Lizenzen wirklich?
- Verstehen des DLAU-Tools und wie man es am besten nutzt
- Tipps für häufige Problembereiche, wie z. B. Team-Postfächer, Funktions-/Testbenutzer usw.
- Praxisbeispiele und Best Practices zum sofortigen Umsetzen
Salesforce Integration for Bonterra Impact Management (fka Social Solutions A...Jeffrey Haguewood
Sidekick Solutions uses Bonterra Impact Management (fka Social Solutions Apricot) and automation solutions to integrate data for business workflows.
We believe integration and automation are essential to user experience and the promise of efficient work through technology. Automation is the critical ingredient to realizing that full vision. We develop integration products and services for Bonterra Case Management software to support the deployment of automations for a variety of use cases.
This video focuses on integration of Salesforce with Bonterra Impact Management.
Interested in deploying an integration with Salesforce for Bonterra Impact Management? Contact us at sales@sidekicksolutionsllc.com to discuss next steps.
Have you ever been confused by the myriad of choices offered by AWS for hosting a website or an API?
Lambda, Elastic Beanstalk, Lightsail, Amplify, S3 (and more!) can each host websites + APIs. But which one should we choose?
Which one is cheapest? Which one is fastest? Which one will scale to meet our needs?
Join me in this session as we dive into each AWS hosting service to determine which one is best for your scenario and explain why!
Digital Marketing Trends in 2024 | Guide for Staying AheadWask
https://www.wask.co/ebooks/digital-marketing-trends-in-2024
Feeling lost in the digital marketing whirlwind of 2024? Technology is changing, consumer habits are evolving, and staying ahead of the curve feels like a never-ending pursuit. This e-book is your compass. Dive into actionable insights to handle the complexities of modern marketing. From hyper-personalization to the power of user-generated content, learn how to build long-term relationships with your audience and unlock the secrets to success in the ever-shifting digital landscape.
HCL Notes and Domino License Cost Reduction in the World of DLAUpanagenda
Webinar Recording: https://www.panagenda.com/webinars/hcl-notes-and-domino-license-cost-reduction-in-the-world-of-dlau/
The introduction of DLAU and the CCB & CCX licensing model caused quite a stir in the HCL community. As a Notes and Domino customer, you may have faced challenges with unexpected user counts and license costs. You probably have questions on how this new licensing approach works and how to benefit from it. Most importantly, you likely have budget constraints and want to save money where possible. Don’t worry, we can help with all of this!
We’ll show you how to fix common misconfigurations that cause higher-than-expected user counts, and how to identify accounts which you can deactivate to save money. There are also frequent patterns that can cause unnecessary cost, like using a person document instead of a mail-in for shared mailboxes. We’ll provide examples and solutions for those as well. And naturally we’ll explain the new licensing model.
Join HCL Ambassador Marc Thomas in this webinar with a special guest appearance from Franz Walder. It will give you the tools and know-how to stay on top of what is going on with Domino licensing. You will be able lower your cost through an optimized configuration and keep it low going forward.
These topics will be covered
- Reducing license cost by finding and fixing misconfigurations and superfluous accounts
- How do CCB and CCX licenses really work?
- Understanding the DLAU tool and how to best utilize it
- Tips for common problem areas, like team mailboxes, functional/test users, etc
- Practical examples and best practices to implement right away
HCL Notes and Domino License Cost Reduction in the World of DLAU
Interpolating evolutionary tracks of rapidly rotating stars - paper
1. Interpolating Evolutionary Tracks of Rapidly Rotating Stars
Danielle Kumpulanian
Department of Physics & Astronomy, Stony Brook University
(Department of Physics, Applied Physics & Astronomy, Rensselaer Polytechnic Institute)
(Dated: August 5, 2005)
This project has two purposes: to provide an accurate method of interpolating data from
published evolutionary models grids, and to solve the problem of inferring the mass or
range of possible mass values of a star given its radius and luminosity. The first is
necessary because the grids only cover a limited set of mass values, and studying an
object of an arbitrary mass requires data for that mass to be interpolated and used.
In this case, the stellar models grids were those published by A. Claret in 2004. These
tracks were plotted on a log(radius) vs. log(luminosity) diagram. The interpolation
method was tested by using the existing tracks and linearly interpolating one intermediate
track. This test showed that this interpolation method could be used, accurate to better
than 1%, for any log(mass) in the range of the log(mass) values given in the grid, and
therefore, new models grids could be accurately generated using existing ones.
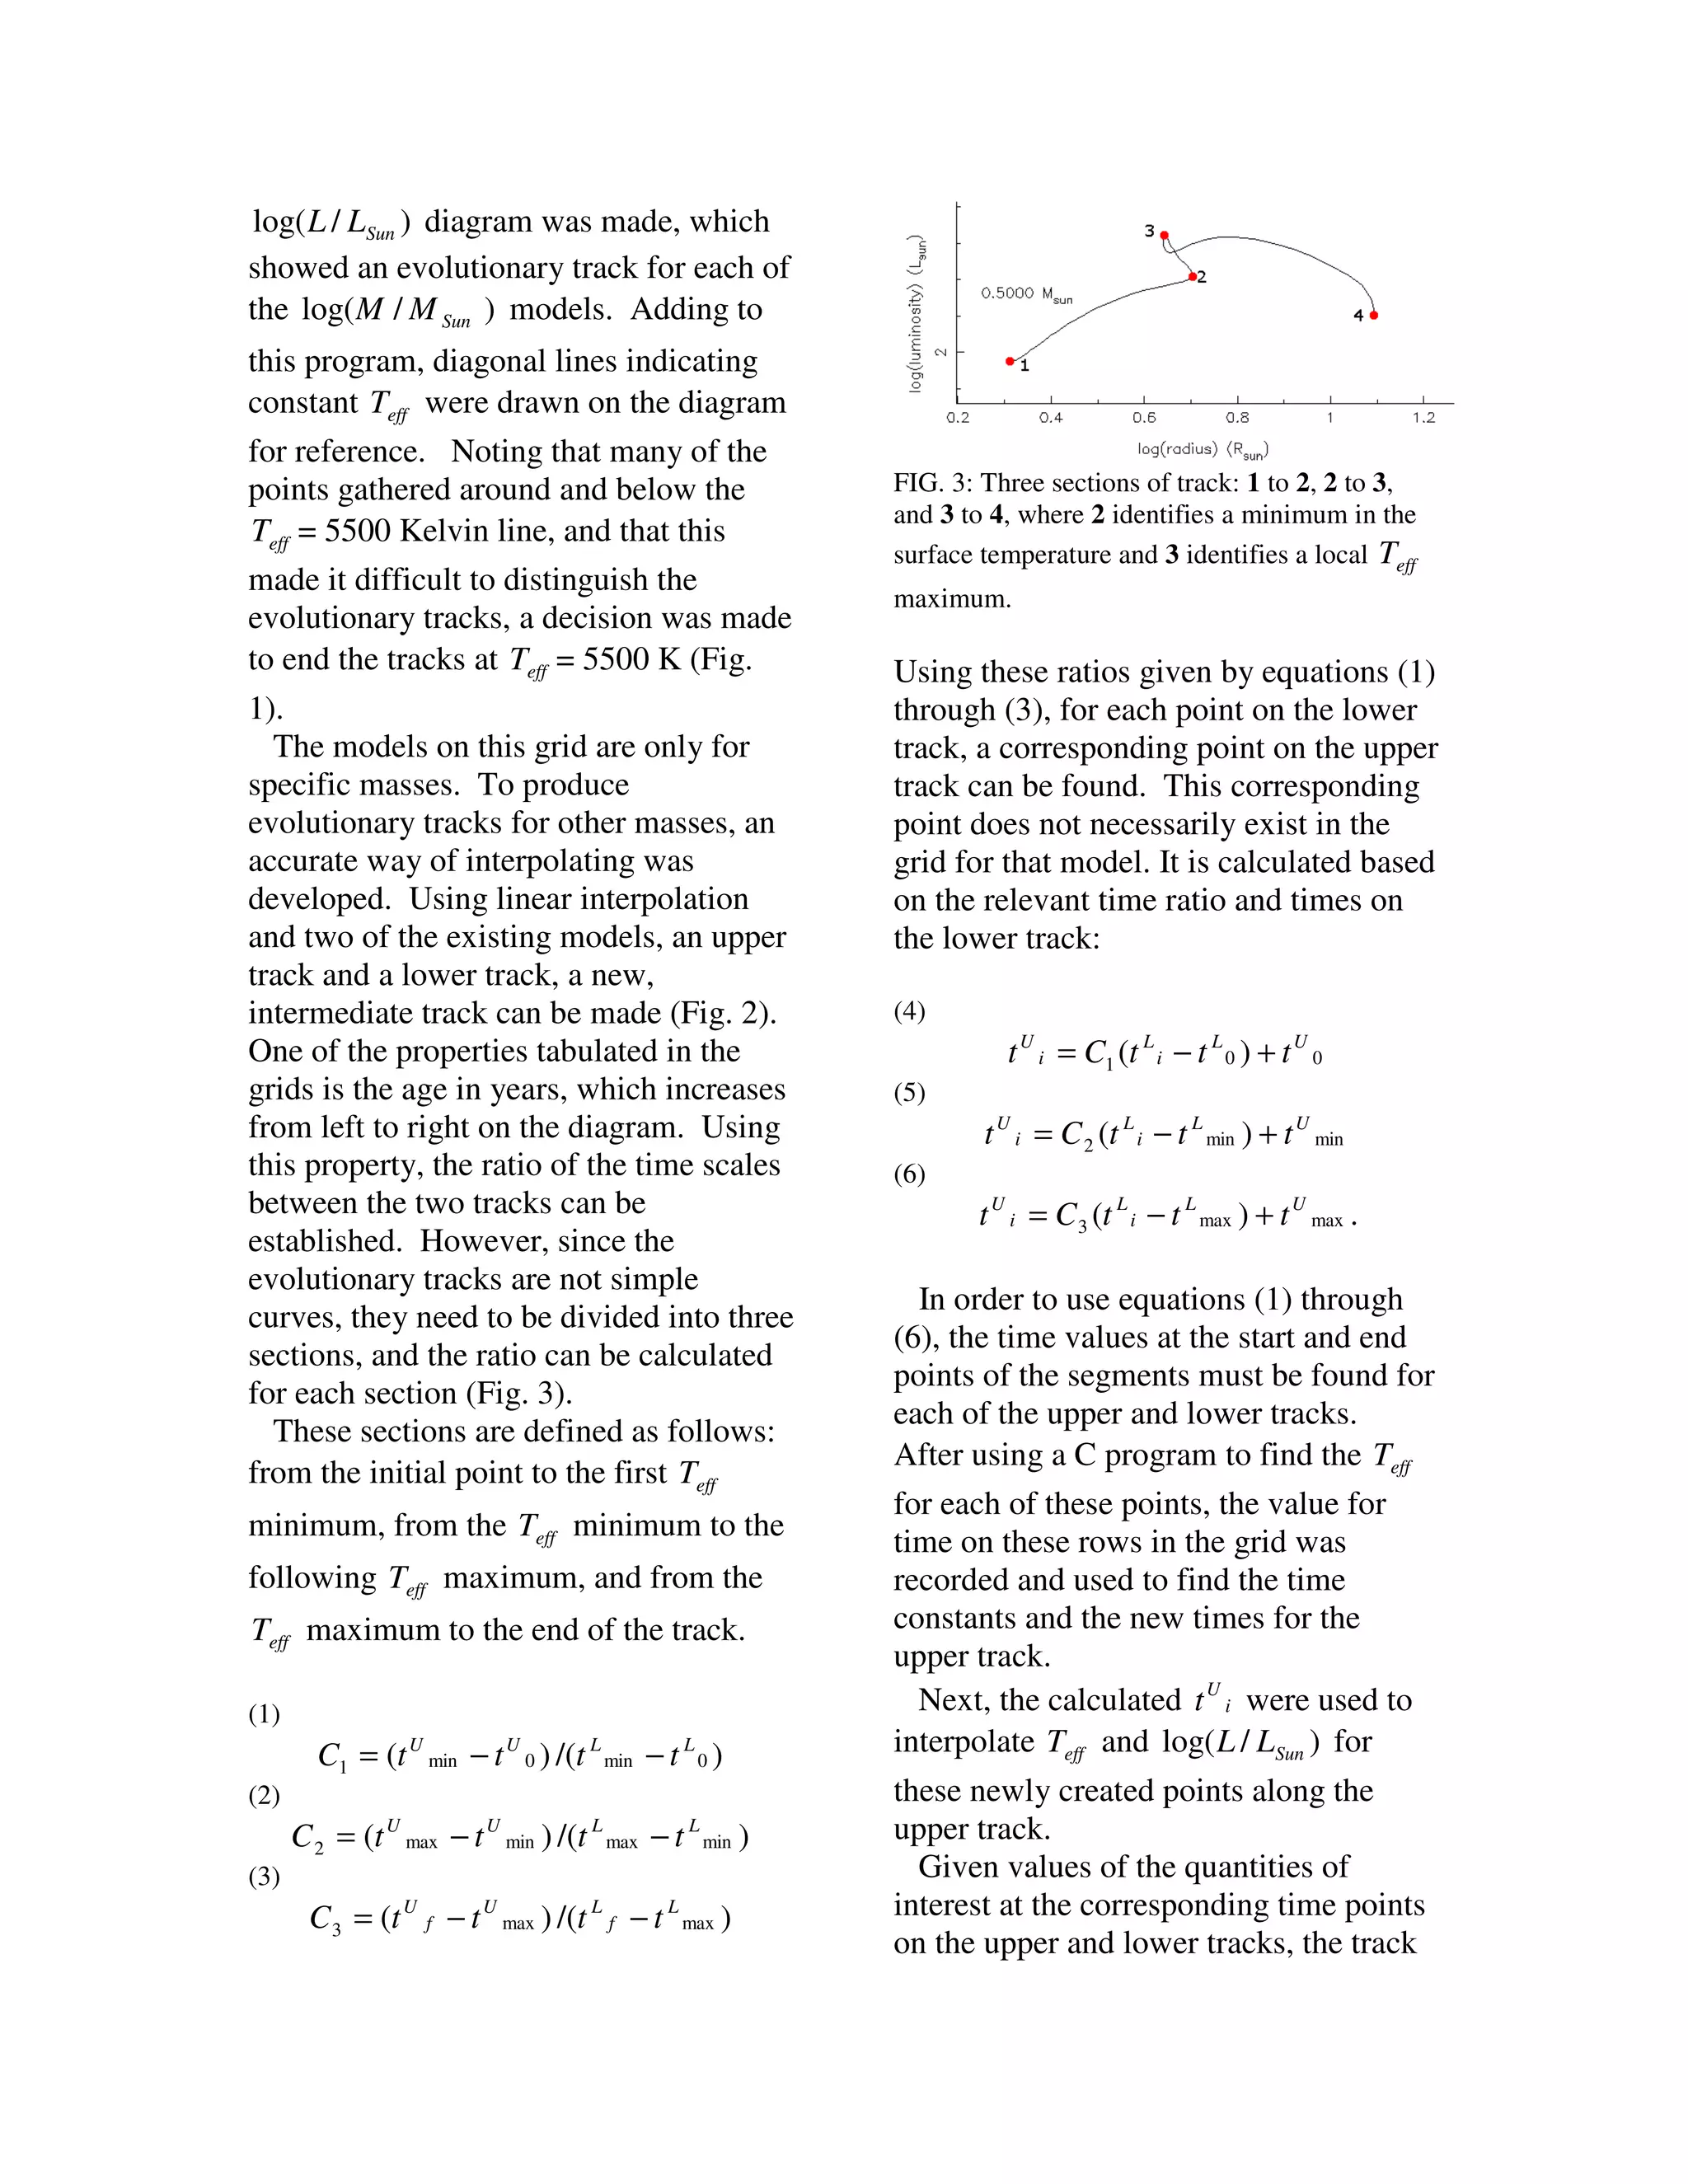
The evolutionary tracks plotted on the log(radius) vs. log(luminosity) plot are complicated and
include loops. Because of this, the tracks are divided into three sections, with the middle section
being the loop area. In this area, multiple values for log(mass) can exist, and a range of values can
be determined. In the other areas, one value can be found. So the process requires finding first
which area the [log(radius),log(luminosity)] point in question occupies and, if it is in the loop
region, finding the range of log(mass) involved.
This project fits into a larger context. Two properties of stars, radius and luminosity, are
known to remain unchanged when the stars rotate. These can be found using
observational techniques, and using these two quantities, other properties of the star can
be deduced. This allows for study of the star's evolutionary state and how rotation affects
stellar evolution.
Introduction
project, is the grid published by A.
Stellar evolution is the life history of a Claret1. To be useful, the grids need to
star. Since the lifetimes of stars can be be able to be manipulated to produce
millions or billions of years, a single star tracks for any arbitrary mass. A solution
cannot be observed for its entire lifetime. to this problem is to interpolate data for
All different stages of evolution can be arbitrary masses using the given data
observed. Stars are always being born from the grids.
and always dying, so there are examples Another matter is to estimate the mass
of all stages of stellar life. Using these of a star by comparing observations of L,
observations, detailed calculations can Teff and R with predictions. This can
be made about how the properties of result in a single estimated mass or a
stars of a given mass will change with range of values for mass, depending on
time. These calculations can be used to which segment of the evolutionary track
draw a predicted evolutionary track of a the given star is on.
star with a given mass.
“Grids” of these evolutionary tracks Interpolating Evolutionary Tracks
are published, with a considerable
difference between each mass, so not A C program was written to plot the
every possible mass of a star is data from Claret’s grid. Using
accounted for. Specifically, used in this PGPLOT, a log( R / RSun ) vs.
2. log( L / LSun ) diagram was made, which
showed an evolutionary track for each of
the log( M / M Sun ) models. Adding to
this program, diagonal lines indicating
constant Teff were drawn on the diagram
for reference. Noting that many of the
points gathered around and below the FIG. 3: Three sections of track: 1 to 2, 2 to 3,
and 3 to 4, where 2 identifies a minimum in the
Teff = 5500 Kelvin line, and that this
surface temperature and 3 identifies a local Teff
made it difficult to distinguish the
maximum.
evolutionary tracks, a decision was made
to end the tracks at Teff = 5500 K (Fig. Using these ratios given by equations (1)
1). through (3), for each point on the lower
The models on this grid are only for track, a corresponding point on the upper
specific masses. To produce track can be found. This corresponding
evolutionary tracks for other masses, an point does not necessarily exist in the
accurate way of interpolating was grid for that model. It is calculated based
developed. Using linear interpolation on the relevant time ratio and times on
and two of the existing models, an upper the lower track:
track and a lower track, a new,
intermediate track can be made (Fig. 2). (4)
One of the properties tabulated in the t U i = C1 (t L i − t L 0 ) + t U 0
grids is the age in years, which increases (5)
from left to right on the diagram. Using t U i = C 2 (t L i − t L min ) + t U min
this property, the ratio of the time scales (6)
between the two tracks can be t U i = C 3 (t L i − t L max ) + t U max .
established. However, since the
evolutionary tracks are not simple
In order to use equations (1) through
curves, they need to be divided into three
(6), the time values at the start and end
sections, and the ratio can be calculated
points of the segments must be found for
for each section (Fig. 3).
each of the upper and lower tracks.
These sections are defined as follows:
After using a C program to find the Teff
from the initial point to the first Teff
for each of these points, the value for
minimum, from the Teff minimum to the
time on these rows in the grid was
following Teff maximum, and from the recorded and used to find the time
Teff maximum to the end of the track. constants and the new times for the
upper track.
(1) Next, the calculated t U i were used to
C1 = (t U min − t U 0 ) /(t L min − t L 0 ) interpolate Teff and log( L / LSun ) for
(2) these newly created points along the
C 2 = (t U max − t U min ) /(t L max − t L min ) upper track.
(3) Given values of the quantities of
C 3 = (t U f − t U max ) /(t L f − t L max ) interest at the corresponding time points
on the upper and lower tracks, the track
3. for the intermediate mass value can be track and the two tracks used to compose
produced by linearly interpolating in it.
log( M / M Sun ) .
(7) Results: Interpolation of Evolutionary
log( M / M Sun ) − log( M / M Sun )
L Tracks
wt + =
log( M / M Sun ) L − log( M / M Sun )U Testing the interpolation method
(8)
showed it to be accurate to better than
log( M / M Sun ) − log( M / M Sun )U 2% for a difference of 0.2000
wt − =
log( M / M Sun ) L − log( M / M Sun )U log( M / M Sun ) between the two models
(9)
used to interpolate the third model. In
x = x1 wt + + x 2 wt − using this method for interpolating an
arbitrary track, it should be accurate to
In equation (9), x represents the quantity better than 1% as the difference between
being interpolated. the upper and lower tracks decreases.
To test this method of interpolation, an
existing evolutionary track was
interpolated using the tracks above and Finding Mass, given Radius and
below it, and all three were plotted on a Luminosity
log( R / RSun ) vs. log( L / LSun ) diagram,
along with the actual model for the Consider a log( R / RSun ) vs.
intermediate value. Specifically, the log( L / LSun ) diagram where the space
log( M / M Sun ) =0.6000 track was between each track is much smaller than
reconstructed using the on the diagram in Fig. 2. Not only does
log( M / M Sun ) =0.5000 and each track loop over itself, it loops over
other tracks as well. In this ambiguous
log( M / M Sun ) =0.7000 tracks (Fig. 2).
region of the diagram, for a given
It appears that the intermediate track is [ log( R / RSun ) , log( L / LSun ) ], an infinite
reproduced to within ~2%. One expects
number of tracks pass through this point.
interpolation between adjacent tracks to
This means that there is a range of
be much more accurate. Satisfied this
possible masses for a star with these
method will work, a C subroutine was
properties. One significant problem to
written to make this possible. Given a
solve is how to tell if a point is in a
log( M / M Sun ) within the range of those particular region given values for its
in the grid, the subroutine used the luminosity and the radius.
interpolation method described above to If the tracks are divided into three
create a new evolutionary track, with all sections, a polygon can be drawn by
of the properties, not limited to Teff , connecting the Teff min points, connecting
log( R / RSun ) , and log( L / LSun ) . the Teff max points, and connecting the
Another subroutine gives the option of end points of these two groups (Fig. 4).
writing this data to a file, and yet another If a [ log( R / RSun ) , log( L / LSun ) ] is
subroutine uses PGPLOT to plot the new
within this polygon, a range of values for
its log( M / M Sun ) can be found. If it is
4. outside this region, on either side, in Now, count all points on the threshold to
principle a unique value for its be considered “on-or-above” the
log( M / M Sun ) can be obtained. threshold. Then one side generates a
node because one of its endpoints is
There are many point-in-polygon
below the threshold and the other is on-
algorithms. The one used here2 involves
or-above it. The other side does not
drawing a straight horizontal line, from
generate a node because both of its
the point, through the polygon, and out
endpoints are on-or-above the threshold.
the other side (Fig. 5).
FIG. 7: Side a has an endpoint below and an
endpoint on-or-above the y-threshold, and both
endpoints of side b are on-or-above. Only one
node will be counted, due to side a.
FIG. 5: There are an odd number of blue nodes,
so the red test point is inside the polygon.
Notice the end result is independent of which
direction (left or right of the test point) the node
count takes place.
The y-coordinate of the test point FIG. 8: Side d lies entirely along the y-threshold,
becomes the y-threshold, and the points and neither of its endpoints will be counted.
Side e does not generate a node because both
where the threshold crosses the edge of
endpoints are on-or-above the threshold, but side
the polygon are called nodes. If there c, having one endpoint below the threshold, does
are an odd number of nodes, then the generate a node.
point is inside the polygon. If there is an
even number or zero nodes, the point is A similar problem occurs when one side
outside the polygon. This works for of the polygon lies entirely on the
polygons with holes in them or overlap threshold (Fig. 8). Neither of the
themselves, and also for polygons that endpoints of this side will be counted. If
have lines that cross (Fig. 6). the test point falls on an edge of the
polygon, the results are unpredictable
and depend on the orientation of the
polygon and the coordinate system.
FIG. 6: The algorithm still works for overlapping Results: Points Contained in a
polygons and polygons that cross themselves. Polygon
In the case of the threshold passing The point-in-polygon algorithm is fast
through a vertex of the polygon (Fig. 7), and easily programmed. It can be used
that node can only be counted once for for a variety of tasks, including the case
the algorithm to work properly. One of of obtaining values of mass for points
the sides has a point below and a point given their luminosity and radius.
on the threshold, and the other side has a
point above and a point on the threshold.
5. Conclusions track for that star can be drawn. Since
log( R / RSun ) and log( L / LSun ) are
A method of interpolating data from independent of rotation, this allows for
existing evolutionary models grids was study of the star’s evolutionary state and
developed and was tested, accurate to how its rotation affects its evolution.
better than 1%.
Noting the complexity of the
evolutionary tracks, they can be divided Acknowledgements
up into three sections: two simple
sections and one uncertain section. The author would like to thank Prof.
Polygons containing these sections can Deane Peterson for advising her on this
be drawn using multiple tracks, with project. Also, thanks to Joseph Yasi for
vertices at the endpoints of the track his help with debugging. This project
sections. If a point was made possible by a grant from the
[ log( R / RSun ) , log( L / LSun ) ] falls within National Science Foundation (Phy–
one of the two simple sections, its 0243935).
log( M / M Sun ) can be calculated. If it
falls within the middle, multivalued area,
References
a range of values for its log( M / M Sun )
can be found. In order to decide which 1. A. Claret, Astron. Astrophys. 424, 919 (2004).
area the point is in, a point-in-polygon 2. D. R. Finley, Point-In-Polygon Algorithm
(1998), URL:
algorithm must be used.
http://www.alienryderflex.com/polygon/.
After obtaining the log( R / RSun ) and
the log( L / LSun ) of a star through
observation, the remaining properties
can be deduced, and an evolutionary
6. FIG. 1: Evolutionary tracks with Teff 5500K, log(M/MSun) range 0.0500 to 0.7000.
FIG. 2: Three real tracks (from grid) are drawn in black, with the interpolated track in red and the re-
created upper track in green. This test proved the interpolation method to be accurate to better than ~2%.
7. FIG. 4: Polygon enclosing ambiguous middle region of each track, with vertices at Teff min and Teff max .