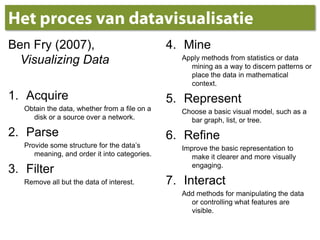
Het proces vandatavisualisatieBen Fry (2007), Visualizing DataAcquire Obtain the data, whether from a file on a disk or a source over a network. Parse Provide some structure for the data’s meaning, and order it into categories. Filter Remove all but the data of interest. Mine Apply methods from statistics or data mining as a way to discern patterns or place the data in mathematical context. Represent Choose a basic visual model, such as a bar graph, list, or tree. Refine Improve the basic representation to make it clearer and more visually engaging. Interact Add methods for manipulating the data or controlling what features are visible.
8.
Het startpunt isde dataVerzamel het, bekijk het, voel hetHet echtespul: geen‘dummy’/’placeholder’ dataKwantiteit is belangrijk
9.
Het startpunt isde dataKwalitatief vs. kwantitatiefDiscreet vs. continuMeetschalen: ratio, interval, ordinaal etc.
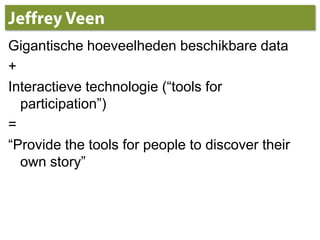
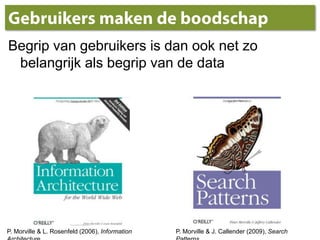
Gebruikersmaken de boodschapBegripvan gebruikers is danook net zobelangrijkalsbegrip van de dataP. Morville & L. Rosenfeld (2006), Information ArchitectureP. Morville & J. Callender (2009), Search Patterns