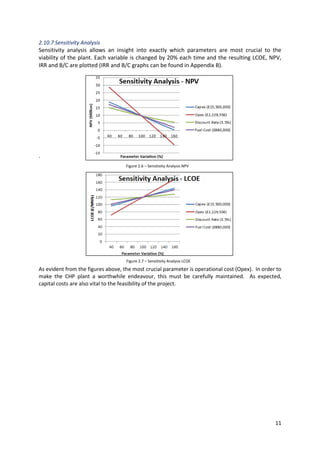
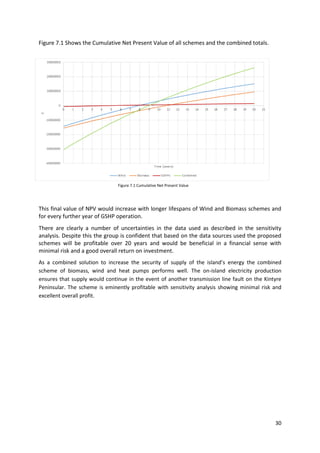
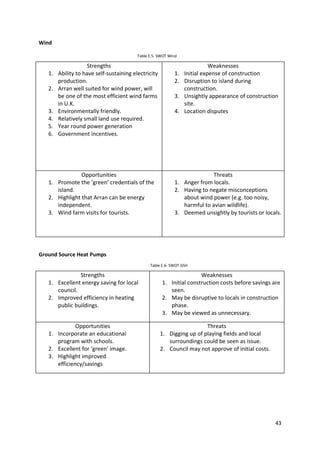
1. The document proposes an integrated energy system for the Isle of Arran to increase energy resilience and reduce carbon emissions. It includes a 3.45MW biomass plant, 10MW wind farm, and ground source heat pumps for public buildings.
2. The biomass plant will be located in the south of the island near vast wood supplies and use 40,000 tonnes of local timber per year. Systems will control emissions and it will have a carbon payback period of less than 4 months.
3. A wind farm of 4 turbines in the southeast will produce an estimated 25.8GWh annually. Ground source heat pumps will replace oil heating in schools and save on fuel costs, paying back in over

![2
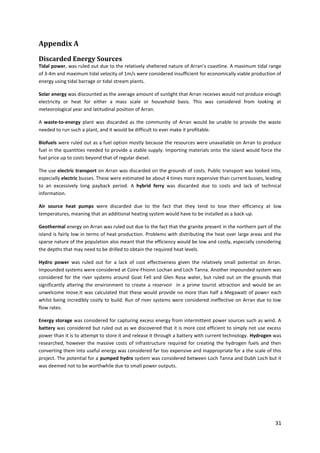
2 Biomass Plant
2.1 Location
One of the main concerns when considering the installation of renewable energy systems at any
scale is the predictability of energy output. Few renewable sources can provide a consistent and
reliable output. Biomass is one of the few forms of renewable energy that delivers base load and
dispatchable energy. The fundamental principle of biomass is to produce carbon neutral energy.
Although the plant releases CO2 into the atmosphere, it also absorbs it at an equal or similar rate. In
order to achieve this it is important to have a sustainable fuel supply that is developed in an efficient
and environmentally friendly manner. With around 11,000 hectares of forestry on the island [2.1]
,
74% of which is owned by the Forestry Commission [2.2]
, Arran is the ideal location to utilise such a
vast resource, whilst also preventing mass exportation of timber. As the plant does not require any
importation of fuels, the energy supply will not be exposed to disruption, which crucially increases
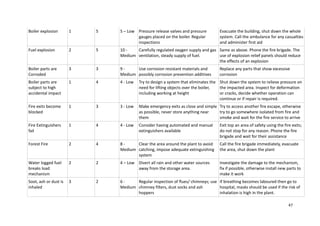
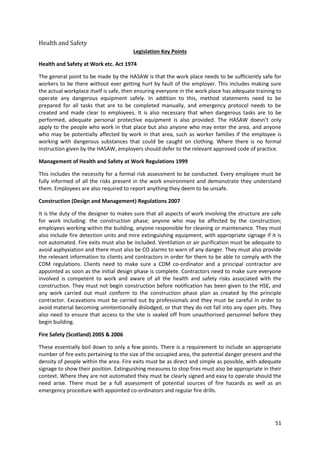
the island’s security of supply. The plant itself is to be located on the South of Arran, within the main
forested area, where the supply is vast and the population sparse. Located less than 1km from an
11kV distribution line that will require no transformation, both costs and visible impact will be
minimised (which is discussed further in Section 4). The plant is also located out with Special
Protected Areas and Areas of Scientific Interest, which were created to protect the vast amount of
wildlife and in particular birds on the island [2.3]
The plant is to be situated in an open area within the largest forest on the island, which covers
around 4,000 hectares and is the source of about 50% of the islands commercial woodland [2.2]
. The
plant is situated just south of an Area of Scientific Interest. The site can be easily accessed by forest
estate roads and is not near any densely populated areas. The closest village to the site is that of
Kilmory which only has a few houses and is around 3.5km away from the site. Lamlash, which has
the highest population of any of the villages (1,100 people) is around 8.5km away and is out with the
sound range of the plant. The plant itself is not expected to make a lot of noise but in order to
ensure there are no adverse noise affects, components such as the cooling tower will face in a north
western direction, where there are no homes for over 10km. Mechanisms such as the steam turbine
generator and wood chipper will also be insulated to ensure that no hearing protection would be
required in close proximity of these areas. Due to the plants location, timber haulage will also be
dramatically reduced on the island, significantly lessening any transportation concerns (covered in
depth in section 2.6). Although the highest point of the plant is 30m, the visual impact of the plant
will be minimal, due to the surrounding forestry acting as a screening, ensuring the natural
appearance of the area will remain from afar. With no population within 3.5km of the site and
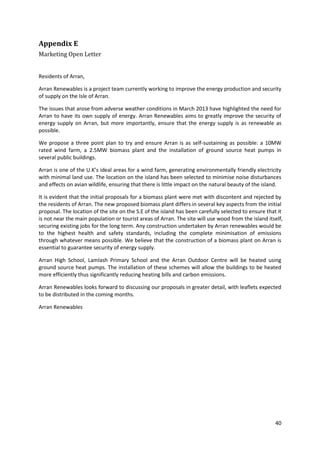
limited population within 8.5km, the plant will have very little impact on the people of Arran.
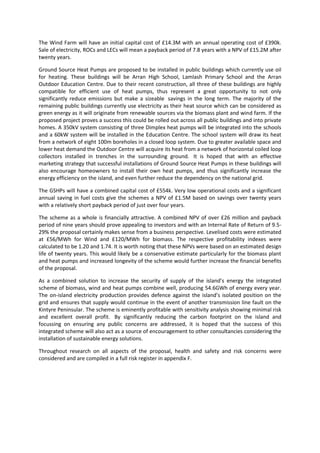
Figure 2.1 – Map of South Arran showing location of the Biomass Plant
Figure 2.2 – Image of proposed Biomass plant
Figure 2.3 -Special Protected Areas and Sites of Scientific Interests
(pink – SPA, pink and red stripes – AOSI)](https://image.slidesharecdn.com/8af95c6b-080d-45bb-a1f2-c3481c61aad9-160830163451/85/Integrated-systems-design-project-7-320.jpg)
![3
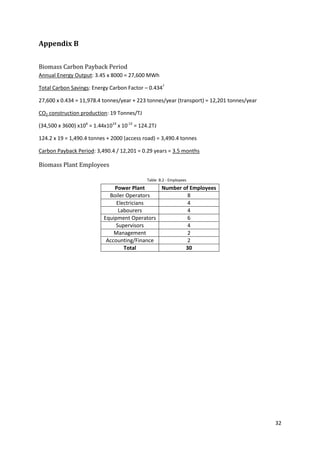
2.2 Plant Type
Although Biomass Plants are capable of producing a constant and reliable source of energy, a large
amount of the energy produced is released as heat if not utilised efficiently. A common approach to
utilise such heat is to use a CHP plant with district heating. Though the location of our plant is
beneficial in terms of visual, sound and environmental aspects it will be positioned too far from
populations to make district heating effective and financially viable. To overcome the inefficiencies
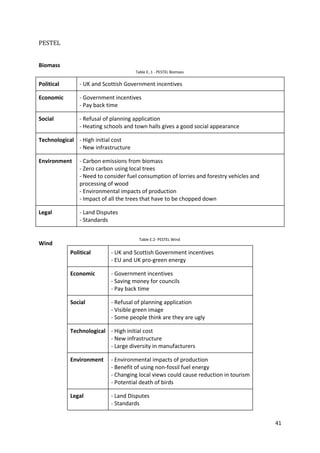
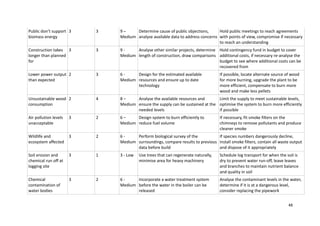
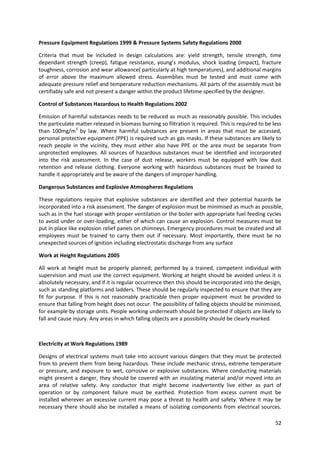
of non CHP plants, our plant will be a CHP pellet production plant. This process involves producing
wood pellets by chipping and pulverising virgin wood into sawdust, then putting the sawdust under
intense pressure and heat (the excess heat from the biomass plant) so a glue type substance is
formed that binds the wood together into a single doughy mass. This mass is then pushed through a
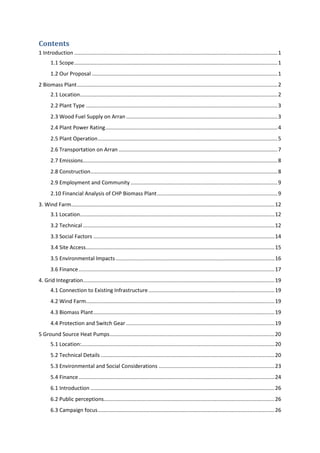
die with small holes, cut and cooled to produce the pellets as shown in Figure 2.4. The weight of
pellets produced is roughly half of what you put into the processing plant but the pellets burn much
more efficiently due to their decreased moisture content (<10%)[2.23]
in comparison to virgin wood
(around 50% moisture content). The plant will therefore produce a more efficient fuel source which
can be burned in the biomass plant, and will also allow the proposal to qualify for government
subsidies and incentives. If at any point there is a surplus of pellets it is possible to sell them to local
homes and businesses for an estimated £200 per tonne [2.4]
.
2.3 Wood Fuel Supply on Arran
Having contacted the Forestry Commission directly, it was stated that they currently own 11,000
hectares of forestry on Arran, and fell the equivalent of 70,000m3
of woodland. Using a provided
standard conversion figure of 1.23, the predicted supply in tonnes is therefore 70,000/1.23 = 57,000
tonnes. Of this total, roughly 60% would be available as biomass wood fuel, giving a projected
supply of 34,000 tonnes of Small Round Wood (the majority of which is Sitka Spruce) per year (the
same figure as the was planned for the previous Northern Energy proposal) [2.2]
, with the other 40%,
which is a higher grade of wood, used in Troon as logs for kit houses and other construction. Small
Round Wood is currently transported to Irvine for making paper and producing electricity and to
Lockerbie to make pallets. A local supply chain for the proposed Biomass plant would eliminate mass
exportation, significantly decreasing costs and carbon emissions. Previous documents on
sustainable wood supply on the North Ayrshire Council website regarding the previous biomass plant
proposition on Arran states that both the Local Council and Forestry Commission are “seeking the
steady and sustainable long-term management of the woodland resource on an economic basis” [2. 2]
.
This is a sustainable and reliable source of energy that is provided on the island, which not only aids
the aim of carbon neutrality of the plant, but also provides a constant source of income for the local
economy. Taking figures from the Northern Energy previous Biomass Plant proposal, a further 6,000
tonnes will be available for use from private forestry, and 1,800 tonnes from “thinning” (reducing
density of forest to improve growing conditions for other trees by increasing space). This gives the
maximum total figure of biomass wood fuel supply on Arran as:
34,000tonnes (FC) + 6,000tonnes (private forestry) + 1800tonnes (thinning) = 41,800 tonnes
A total of 40,000 tonnes will be used for the plant, providing an adequate safety margin.
Figure 2.4 – Wood Pellet Production Process](https://image.slidesharecdn.com/8af95c6b-080d-45bb-a1f2-c3481c61aad9-160830163451/85/Integrated-systems-design-project-8-320.jpg)
![4
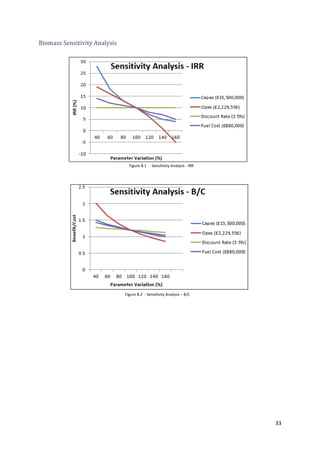
2.4 Plant Power Rating
2.4.1 Maximum Power Calculations
Using the available 40,000 tonnes of wood fuel per year, the maximum rating of the biomass plant
was then calculated. As previously stated, the virgin wood supply is dried using the CHP plant to give
wood pellets of approximately 10% moisture content (this is a conservative estimate used in the
calculations to ensure the proposed power can certainly be provided – it will be 5-10% in reality).
The final mass of the wood pellets after drying to 10% moisture content was calculated to be 17,778
tonnes per year. This was calculated by using the ratio of initial to final mass of pellets, which is
divided by the wood supply as shown below:
From this the mass flow rate, ̇ of the pellets into the plant was found. Using a load factor 91% and
operation 8000 hours per year (leaving 760 hours of downtime for maintenance), the mass flow rate
in kg/s was calculated to be 0.6172 kg/s, as indicated in the following equation:
̇ ( )
( ) ( )
( ) ( )
The total power of the fuel to the biomass plant was then calculated by multiplying the calorific
value (C.V.) of the wood pellets by the mass flow rate into the plant. The calorific value of wood
pellets is kJ/kg[2.5]
, so the total power was found to be 10,777.7kW:
̇ ( ) ( )
The electrical power output (or power rating), , of the plant was then found from this using an
overall electrical efficiency of [2.6]
, giving a value of 3.45MWe as shown:
The energy from the fuel supply that is not converted to electricity is converted to excess heat
energy, , which is calculated to be 6.03MW, assuming a boiler efficiency of = 88% [2.7]
.This
6.03MW of thermal energy is used to dry the virgin wood for pellet production, increasing the
overall energy production of the plant. The equation used for this calculation is shown below:
2.4.2 Increase in power using CHP
The increase in power rating by using the CHP plant has been estimated by calculating the maximum
power output of virgin wood with a standard moisture content of 60%. The energy density of this
wood according to the forestry commission is 6.24MJ/kg [2.8]
. Using the same method employed in
calculating the total power of fuel above, for 6240kJ/kg and 40,000 tonnes of virgin wood supply for
combustion and the same 32% electrical efficiency, it can be calculated that the electrical power
rating of the plant would be 2.78MW. Therefore, this increase in plant efficiency, increases the
electrical power output of the biomass plant by 3.45MW – 2.78MW = 0.67MW. At a relatively
modest cost this is a significant increase in power rating over the lifespan of the biomass plant, and
is therefore an effective way to increase its overall efficiency.](https://image.slidesharecdn.com/8af95c6b-080d-45bb-a1f2-c3481c61aad9-160830163451/85/Integrated-systems-design-project-9-320.jpg)
![6
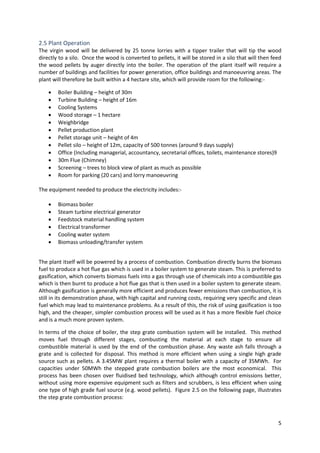
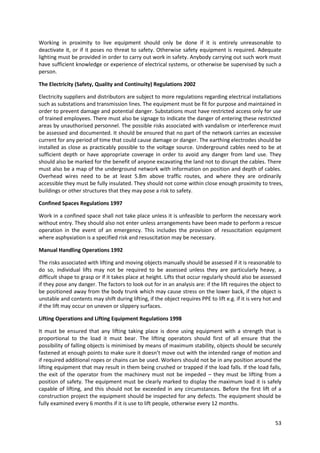
Figure 2.6 – Ebnervyncke Hot Gas Generator
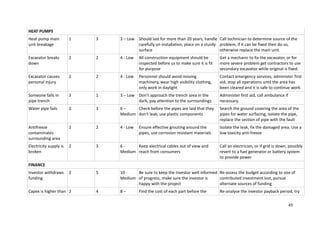
The most suitable boiler found was the Ebnervyncke HGG Hot Gas Generator (Figure 2.6) which
comes in different models capable of producing 3-102MW of electricity. It is also effective for pellet
production and can heat hot gases, with the ability to feed heat directly to rotary drum dryers.
The turbine chosen was an M&M Turbinen Technik 7 to 9 stage turbine, which is the industry
preferred turbine for this application, using steam to power the turbine. The turbine
thermodynamics are shown below.
Steam at entry to turbine – Pressure 65 bar
Temperature 450o
C
Steam at exit of turbine - Pressure 1.5 bar
Temperature 80-120o
C
Using this information the mass flow rate through the turbine was calculated using enthalpy tables
[2.5.1]
and was found to be 6.003 kg/s. This process for this calculation is shown below:
⁄
⁄
⁄
̇
̇
̇ ⁄
Connected to the turbine will be an INDAR 3.5MWe (4,375 MVA) generator giving an output voltage
of 11kV at 50Hz [2.10]
. Due to the multi stage turbine the generator will have 2 poles and operate at
around 3000rpm. It will also have the capability to operate independently of the grid and will be
cooled by a cold air cold water system (water temperature of around 25o
C) and the design will
conform to BS4999 Part 101 (British Standards)[2.10]
Figure 2.5 – Step Grate Combustion Boiler](https://image.slidesharecdn.com/8af95c6b-080d-45bb-a1f2-c3481c61aad9-160830163451/85/Integrated-systems-design-project-11-320.jpg)
![7
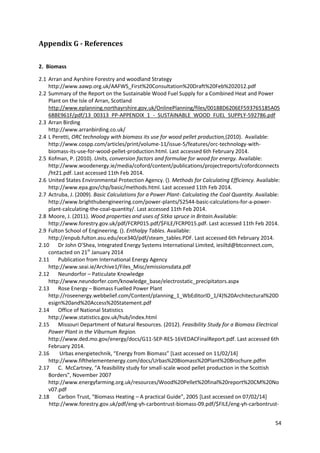
2.6 Transportation on Arran
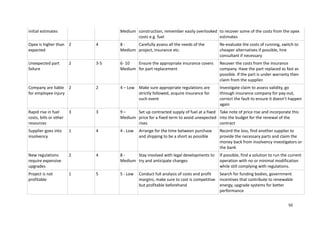
As stated the plant will be located next to the source of about 50% of the islands commercial
forestry. Due to the chosen location of the plant, half of the year’s supply of wood can be
transported short distances on forestry roads, avoiding public routes. The 20,000 tonnes of wood
that will require significant transportation, will be transported using 25 tonne lorries. This is the
equivalent of 800 lorry loads per year (20,000 / 25 = 800), which within a five day working week is
only 3 lorry loads per day (800 / (365-(2x52)) = 3.06). In order to comply with noise regulations, this
transportation will only occur between 8.00 and 18.00. In terms of access to the site, the public
roads are divided into agreed routes (timber haulage any time), consultation routes (consultation on
timing and frequency), severely restricted routes (extra consultation on weight and vehicle type),
and excluded routes. A map of the agreed and consultation routes is shown below, within which red
- agreed routes, yellow - consultation routes, green - woodland that requires forest haulage, blue -
woodland accessed by consultation routes and the purple dashed lines are forest estate roads [2.2]
.
It is evident on the above map that almost all of the forested areas require the use of consultation
routes. However, with only three lorry loads per day, agreeing specific times that they can be used
will not be an issue. The haulage distances to the chosen site are compared to the current haulage
distances to Brodick in table 2.1. In total, 16,800 km in timber haulage will be saved each year as a
result of this proposal , which as well as reducing noise pollution, will also reduce transport costs and
carbon emissions, ensuring that the natural and tranquil feel of the island remains.
Forest Haulage distance to site (km) Haulage distance to Brodick (km)
1 27.5 22.6
2 22.5 12.1
3 16.4 21.5
4 15.1 14.3
5 5.4 19.7
Total Round Trip Haulage (km) 173.8 180.4
Tonnes of wood transported 20,000 20,000
Trips (25 tonne lorry) 800 800
Main Forested Area haulage (km) 0 7.2
Tonnes of wood transported 0 20,000
Trips (25 tonne lorry) 0 800
Total distance covered (km) 139,040 155,840
Figure 2.7 – Map of Arran showing possible transport routes to the site
Table 2.1 – Timber haulage for Biomass Plant compared with current haulage to Brodick](https://image.slidesharecdn.com/8af95c6b-080d-45bb-a1f2-c3481c61aad9-160830163451/85/Integrated-systems-design-project-12-320.jpg)
![8
2.7 Emissions
Although Biomass Plants are a renewable source of energy, there are significant emissions that need
to be considered. Although CO2 will be released in the process, there are many factors that combine
to ensure that the plant itself is “carbon beneficial”. One major carbon saving is the preventing mass
exportation of woodland, which is illustrated in table 2.6.1 below. For creating this table, the
average haulage distance and CO2 production for haulage to the mainland are taken from the
document on the North Ayrshire council website on sustainable fuel supply for the previous plant
proposition [2. 2]
.
Distance
(km)
CO2 produced (kg)
based on 0.889kg/km
CO2 produced (kg) based on total tonne
haulage (40,000 - exportation, 20,000 - site)
Average haulage
to mainland 165 147 235,200
Average haulage
to site 17 15 12,000
Savings 148 132 223,200
The total CO2 produced for the site is based on calculating the total number of trips (22,000 / 25 = 800) and multiplying it by the CO2
produced for each trip (800 x 15 = 12,000kg).
With the Forestry Commission continuing to regrow the felled trees that provide fuel for the plant,
there will also be no net carbon gained by the atmosphere during production, with the CO2 released
being absorbed at the same rate. This carbon neutrality, coupled with the reduction in
transportation of wood and the related emissions from the previous energy source, ensures that the
plant will be carbon beneficial. There will be CO2 released as a result of the construction of the plant
and the renovation of access routes to the site. An overall carbon payback period can be calculated
by taking data from the International Energy Agency [2.11]
and Wind Action (which although is used
predominately for wind, states standard rules that can be used). This was found to be only 3.5
months, with the full calculations and working shown in Appendix B.
In order to control the release of particulate matter, the proposed plant will use an electrostatic
precipitator that will collect matter that is carried as dust in the hot exhaust gases [2.12]
. This
precipitator functions by electrostatically charging the dust particles that are attracted to collection
devices which then dislodge the dust when they are full, which are then used for disposal or
recycling. This process involves ionisation and then migration, which is followed by dissipating the
charge, dislodging the particles and then removing them. As well as this, selective non-catalytic
reduction systems (SNRC) will be used to control nitrogen oxide emissions by more than 80%. SNRC
systems inject a reagent like ammonia directly above the combustion, where temperatures are
between 850 and 1050o
C, creating N2, CO2 and H2O. It is an extremely cost effective and efficient
process compared to Selective Catalytic reduction (where a gaseous reductant is added to an
exhaust gas and is adsorbed onto a catalyst) and is installed in a matter of days. In order to control
the release of HCl and SO2 compounds, alkaline sorbent injection systems will also be installed. This
is a cost effective way, in comparison with scrubbers, to neutralise the Sulphur and Hydrogen
Chloride gases produced. It involves a direct injection of alkaline material, most probably lime, into
the flue gas, causing a continuation of neutralisation down to the filter. This is an easy process that
has low capital and maintenance cost, contributing significantly to the quality of the air released into
the atmosphere.
2.8 Construction
For the construction of the site, there will need to be work done to the access routes for the plant.
The site is most accessible from the south side, where there is a forestry route that is around 2.4km
to the plant from the public road. By widening and strengthening the road, it will allow heavy
machinery to enter the site. Taking guidance from a previous constructed plant by Rose Energy in
County Antrim of a similar size, the roads will be widened to 7.5m (around double the current width)
[2.13]
.
Table 2.2 – Carbon and cost transportation savings of proposed
plant](https://image.slidesharecdn.com/8af95c6b-080d-45bb-a1f2-c3481c61aad9-160830163451/85/Integrated-systems-design-project-13-320.jpg)
![9
2.9 Employment and Community
Although the Isle of Arran has relatively high employment rates, 0.9% unemployment in comparison
to 2.9% for Scotland (courtesy of the Office of National Statistics), it is strongly affected by the
seasonal nature of the tourism industry [2.14]
. The proposed Biomass Plant will also benefit the island
and offer a consistent source of jobs all year round. Taking results from the same type and similar
size of plant[2.15]
, it is expected that a total of 30 jobs will become available. The breakdown of these
jobs is shown in Appendix B. As well as offering full time jobs and thus helping with the local
economy, the plant will also provide an opportunity for recreational and leisure activities, such as
guided tours round the plant. It will also be a useful educational source for both locals and tourists
eager to find out about the plant and renewable energy, helping raise awareness of clean energy
solutions and providing a great place for schools to learn more about sustainable energy.
2.10 Financial Analysis of CHP Biomass Plant
2.10.1 Capital Costs
Due to the project-specific nature of CHP biomass plants and pellet production plants, it is extremely
difficult to gauge an entirely accurate figure for the capital expenditure. To best represent this,
similar plants throughout Europe were investigated. By looking at a selection of plants with a similar
annual output and that also use the heat produced onsite to power wood production plants etc., a
typical value was estimated – £15.5 Million[2.16,2.17]
. The capital cost is inclusive of all aspects of
construction, including: access roads, grid connection and all start up equipment for both.
2.10.2 Operational Costs
The economics of biomass power generation are critically dependent upon the availability of a
secure, long term supply of an appropriate biomass feedstock at a competitive cost. A figure of
£22/tonne was given by the Forestry Commission.
Operational and Maintenance costs (O&M) can be divided into 2 components: fixed and variable.
Fixed O&M costs consist of labour, scheduled maintenance, routine component/equipment
replacement (for boilers, feedstock handling equipment, etc.), insurance, etc. The larger the plant,
the lower the specific (per MW) fixed O&M costs. Variable O&M costs are entirely dependent upon
the output of the plant. They include non-biomass fuels costs, ash disposal, unplanned maintenance,
equipment replacement and incremental servicing costs. Biomass systems generally require more
maintenance time than their counterparts – this can be 0.5 to 1.5days a month [2.18]
.
Given below is a table of the primary components of the operational costs of the CHP and pellet
production plants (values obtained by comparison with data from a 16MW plant in Wales) 25
.
Another crucial aspect of plant operation is the system employed to deal with ash. A figure of 0.5-1%
can be expected per tonne used. A rate of £10/tn is assigned to the removal [2.18]
. Although the
Table 2.3 – Operational and Maintenance Costs](https://image.slidesharecdn.com/8af95c6b-080d-45bb-a1f2-c3481c61aad9-160830163451/85/Integrated-systems-design-project-14-320.jpg)
![10
values given are an estimate, various operational techniques may be employed to reduce the annual
costs[2.18]
. They include the use of high quality fuel (pellets reduce ash and therefore ash removal
cost), conducting regular checks and maintenance, thus to prevent any serious malfunction and
avoiding “short-cycling – maximise operating time between plant shutdown.
2.10.3 Subsidies and Income
The CHP Biomass plant will be connected to the UK Electricity Grid, and so any deficit or excess
can be buffered by the Grid. The sale of electricity to SSE is estimated to be £55/MWh[2.19]
. In
addition to this income, there are also various subsidies for the production of renewable energy.
Biomass CHP is considered eligible for the support of Renewable Obligation Certificate with the
claim that the biomass CHP is accredited under the Combined Heat and Power Quality
Assurance (CHPQA) programme by the supplier 26
. The plant is eligible for 2 Renewable
Obligation Certificates (ROCs) at a current price of £42.37/MWh and a Levy Exemption
Certificate (LEC) of £4.50 (as of Dec 2013) [2.20]
. Note: the plant is not eligible for the Renewable
Heating Incentive (RHI), as a consequence of the heat produced being used by the plant itself to
power a pellet production plant.21
2.10.4 Results
The following section outlines the main finding of this financial analysis:
NPV £9.55 Million
LCOE £120.30/MWh
IRR 10%
Figure 10.2 above indicates a payback period of approximately 11.3 years. There is also a Benefit to Cost ratio of 1.2 (B/C>1,
thus indicating the project is feasible).
Table 2.4 – Plant Income
Figure 2.5 – Cumulative NPV](https://image.slidesharecdn.com/8af95c6b-080d-45bb-a1f2-c3481c61aad9-160830163451/85/Integrated-systems-design-project-15-320.jpg)
![12
3. Wind Farm
3.1 Location
With impressive average wind speeds and a sparse population, Arran is ideally suited for wind power.
Alongside the proposed Biomass Plant, wind energy will also increase the green image of the island
and generate profit with an impressive payback period. The wind farm is to be located on the South
East of the island close to Loch Garbad as shown in figure 3.1 below:
This location was chosen for a variety of reasons. It is situated in one of the windiest parts of the
island with a mean wind velocity of 10.2 m/s at 45m height [3.1]
. It is also outwith Areas of Scientific
Interest and Special Protected Areas[3.2]
, the map of which is shown as figure 2.3. There will also be
no noise concerns and visibility will be kept at a minimum.
The mean wind velocity is given on the NOABLE Wind Speed Map [3.1]
, which states that wind speed
is 9.3 m/s at 10m; 9.8 m/s at 25m and 10.2m/s at 45m height. Extrapolating these values using a
conservative Hellman exponent of 0.25, (complex terrain with mixed or continuous forest) the mean
wind velocity is found to be 12.4 m/s at a height of 98m. Whitelee wind farm, 60km to the North-
East of the site boasts mean wind velocities 10-20% lower. The load factor for the site was based on
this information, with Whitelee’s quoted value of 27%[3.3]
being scaled up to a conservative value of
29.5%.
The wind farm is located within the forested area and is a significant distance from any populated
areas on the island; around 3km from the small villages of Kildonan and Whiting Bay and around
7.5km from the larger village of Lamlash (which homes 1,100 people). As a result, there will be no
issues with noise as the sound impacts of wind turbines generally only stretch to a 400m radius [3.4]
.
3.2 Technical
3.2.1 Components
The wind farm will consist of four General Electric GE2.5-103 Horizontal-Axis Wind Turbines (HAWT);
each with a rated power output of 2.5MW. Thus, the nameplate capacity of the entire installation
will be 10MW. Using a capacity factor of 29.5% this gives a total annual energy output of 25,842
MWh. The components are as follows:
- Four General Electric GE2.5-103 wind turbines.
- 690V/33k step-up transformers (located in the base of each turbine)[3.5]
- 33kV collection system to link the wind turbines to the substation
- substation containing appropriate switchgear
- Wind turbine access roads
- 3km of 33kV distribution line to connect to the existing infrastructure in the South East of the
island, which is covered in detail in section 4.
Figure 3.1.1 – Location of Wind Farm
Figure 3.1 – Site Location](https://image.slidesharecdn.com/8af95c6b-080d-45bb-a1f2-c3481c61aad9-160830163451/85/Integrated-systems-design-project-17-320.jpg)
![13
3.2.2 Wind Turbine Generators
The turbine towers have a hub height of 98.3m and a blade diameter of 103m. The nacelle atop each
tower contains the gearbox, bearings, couplings, generator and inverter, and is made of fiberglass
with sound insulating[3.5]
. It is lit and ventilated for the convenience of site workers. For reasons of
economy there will be no personnel lifts inside the towers, only stairs. However, there is a possibility
of retrofitting the towers with lifts at a later date if required.
3.2.3 Basic GE2.5-103 specification
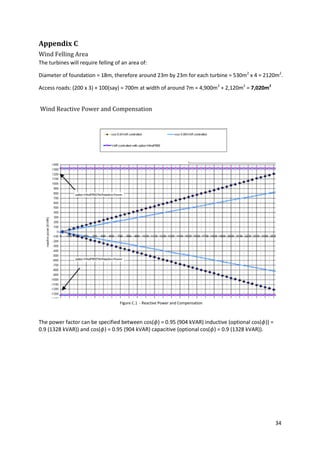
Details of the turbines Reactive Power and Compensation can be found in Appendix C. The VAR
specification provides the option of a 'WindFree Reactive Power' function. This means that the
turbine can also make reactive power (up to 1328 kVAR) available as a voltage buffering during the
full operational range (0-2750 kW), even during calm periods or strong winds [3.6]
. Capacitors for the
compensation of reactive power are not necessary [3.6]
.
Manufacturer General Electric (GE)
Model 2.5-103
Nameplate Capacity 2500kW
Hub Height 98.3m
Rotor Diameter 103m
Blade Sweep Area 8328m
2
Generator Output Voltage 690V AC (50Hz)
Transformer Output Voltage 33’000V AC (50Hz)
Approximate Diameter of Foundation 18 metres
Figure 3.2- Turbine Dimensions
Table 3.1 - Basic Specification [3.17/3.18]
Figure 3.3 - Nacelle Layout](https://image.slidesharecdn.com/8af95c6b-080d-45bb-a1f2-c3481c61aad9-160830163451/85/Integrated-systems-design-project-18-320.jpg)
![14
3.3 Social Factors
In terms of visibility, being in the sparsely populated south east of the island, within the main
forested area, the turbines will not have major effects on the scenery of Arran. The proposed wind
farm will consist of 4 turbines with a hub height of 98.3m and a blade radius of around 50m. In
order to gauge the level of visibility of the turbines on the island, they can be compared to the
turbines that were put forward in a previous proposal from Green Power[3.7]
within which there were
8 turbines with a tip height of 102m in a location just north east of the current proposition. On the
following page labelled Figure 3.1.2 is a visibility map for this proposal, where dark blue represents
visibility of 7-8 turbines, light blue 5-6, green 3-4, and yellow 1-2. The red dots are specified visibility
points. By analysing this map, it can be deduced that visibility from the most populated area of the
island (the central east part where Brodick and Lamlash are situated) is likely to be limited. Visibility
in the northern areas, particularly the west is also likely to be minimal with the south east the most
affected area, which is of little concern due to its sparse population. It is important to note that the
information stated is simply assumptions based on the analysis of Figure 3.4, noting that although
the turbines are taller for this proposal, the extent of visibility for the previous scheme suggests that
these turbines will not dominate the scenery of the island. These concerns are also lessened when
considering a survey conducted on Arran regarding the use of wind turbines on the island in 2006
(also sourced from Green Power [3.7]
). This indicated that the majority were in favour of wind
turbines on the island, which suggests that as long as there are no direct effects of such a scheme on
the island, its introduction would be welcomed. A pie chart of this summary is also shown below, as
Figure 3.5:
While the height of the proposed turbines does mean they will be significantly more visible than the
previous proposition in 2007, their height is justified as it ensures that the land usage is considerably
less, which has notable benefits in decreasing the impact on the wildlife and resulting in only
minimal levels of forestry being unavailable for regrowth. The four wind turbines will be situated
linearly in a south-east: north-west alignment, 200 metres apart. The turbines will require felling of
an estimated area of 7020m2
of forestry, including access roads and foundations (the calculations for
which can be found in Appendix C). Using the conversion ratio given by the Forestry Commission[3.8]
,
the felling of woodland will account for 5,707 (7020/1.23) tonnes of wood. In co-operation with the
Forestry Commission, this wood would be used for the biomass plant, ensuring that is used
Figure 3.4 – Visibility map of previous Wind Farm with 8, 102m tip height turbines.
Figure 3.5 – Survey conducted on Arran of a proposed wind farm in 2006](https://image.slidesharecdn.com/8af95c6b-080d-45bb-a1f2-c3481c61aad9-160830163451/85/Integrated-systems-design-project-19-320.jpg)
![15
productively, even though there will be no regrowth within the purchased area. We are confident
that the Forestry Commission would oblige to this request having contacted them directly and also
providing them a steady and sustainable woodland consumer in the form of the Biomass Plant that
will require minimal transportation and zero exportation to the mainland.
3.4 Site Access
With significant hub heights and blade diameters, transportation of the turbine components will not
be a simple process. The components will be delivered to the island by boat, before reaching Brodick
Ferry Terminal. The route to the site, which is shown in figure 3.7 below, does encounter some
complications, as highlighted on the image. There are a few tight corners that will require close care
and attention, but most bends in the road do comply with GE specifications [3.9]
. The expanded
image shown in figure 3.7 does not but such complications will be circumvented by felling a small
area of forestry which will encompass around 30 trees and constructing an alternate route, ensuring
all GE specifications are met. This route extends as far as Woodlea Cottages, by Glenashdale Wood,
beyond which point it will be necessary to construct a bespoke access route southwards towards the
wind farm site. It is likely that the stretch of track from the Ross to Woodlea Cottages will also need
to be upgraded to meet GE specifications (figure 3.8) before it will be suitable for use for this
purpose. This has been accounted for in the total capital cost of the wind farm project.
Figure 3.6 – Wind Farm Layout
Figure 3.8 – Specification of required road characteristics for transportation from GE
Figure 3.7 – Site of particular interest where circumvention is required](https://image.slidesharecdn.com/8af95c6b-080d-45bb-a1f2-c3481c61aad9-160830163451/85/Integrated-systems-design-project-20-320.jpg)
![16
3.5 Environmental Impacts
3.5.1 Wildlife
One of the main concerns with the instillation of wind turbines is the effects that it can have on birds
and bats, with some claiming it can result in a substantial amount of deaths. The prospect of such
events would be detrimental for Arran, as it inhabits over 250 different species of bird [3.2]
. Arran is
described as Scotland in miniature, with the northern half rugged, mountainous and remote and the
south made up of moorland and much of the islands farmland. The south east part of the island is
home to most of the widespread and common birds in the area including buzzards, kestrels and hen
harriers. Hen harriers in particular are very important to the nature of Arran as it has around 5% of
the UK’s breeding population (more than England). Although most studies show little overall impact
of wind turbines on birds, precautionary measures will be taken to ensure there are no adverse
effects on the islands birds. This will be done by making the wind turbines motionless during very
low wind speeds. This is when both birds and bats will be most active and will thus lessen the
chances of any instances significantly. When the winds are high and the turbines are in full motion,
the quantity of birds or bats at that height is likely to be limited.
3.5.2 Peat Land
Another environmental aspect that has to be considered is the potential impact on peat lands of
wind farm instillations. Installing wind farms can cause drainage of peat lands which can result in the
loss of CO2 to the atmosphere as a result of desiccation of acrotlem and exposure of catotelm to
oxidation [3.6]
. Although the area covered by the wind turbines is limited and the scale of carbon loss
is in most cases modest, it is important to at least consider its potential affects for the chosen
location. Having studied geological maps from the British Geological Survey, it seems relatively clear
that the wind farm is not within an area of peat land [3.10]
. Due to perhaps the level of forestry, there
are many areas within the map given by the BGS that state that there is no record for the superficial
geology, but the fact that the chosen area is surrounded by Devensian Till and Alluviam deposits
suggests that it is not a concern. Figure 3.9 is from the BGS map, with brown representing peat land,
yellow representing Alluviam deposits, blue representing Devensian Till and grew representing no
available data yellow representing Alluviam deposits:
Figure 3.9– British Geological Survey Map of superficial geology](https://image.slidesharecdn.com/8af95c6b-080d-45bb-a1f2-c3481c61aad9-160830163451/85/Integrated-systems-design-project-21-320.jpg)
![17
3.5.3 Emissions
Although the wind turbines themselves have zero emissions, there will be emissions as a result of
the construction of the farm and the use of backup power, which must be factored. A carbon
payback period can be calculated by using data from “Wind Action”[3.11]
, Renewable Energy Solutions
for Penmanshiel Wind Farm [3.12]
and Viking Energy [3.13]
on the emissions during construction and
relating it to the current use of the grid.
The carbon payback period for the scheme was calculated at 1.46 years with 11,000 tonnes of
carbon being saved each year. This value was obtained taking into account the carbon level released
from the current energy use, as well as the carbon output of the construction process, back-up
system and deforestation. The calculations are shown in detail in Appendix C. With a carbon
payback period of under 1 and a half years and zero emissions throughout its lifespan, it can
therefore be stated that the wind farm is an extremely successful way of reducing the islands carbon
footprint.
3.6 Finance
Using estimated capital costs, operating costs, energy outputs and income the Net Present Value
(NPV), Internal Rate of Return (IRR) and Levelised Cost of Energy (LCOE) were calculated. These
variables were all considered in a full sensitivity analysis.
3.6.1 Capital Cost
The cost per 2.5MW turbine was estimated to be £2.5m. This arose from values given by the
European Wind Energy Association (EWEA)[3.14]
and the International Renewable Energy Association
(IRENA)[3.15]
, which were updated to current day prices. Wind power is a capital intensive operation
and the majority of the capital costs cover the cost of the turbine itself with the rest spent on
foundations, installation, grid connection, consultancy, land, financial costs and road construction.
EWEA estimates the percentage share of total capital costs occupied by the turbine at 75.6%. To
account for uncertainties and possible additional costs in road construction and grid integration a
more conservative value of 70% was used.
Total Capital Cost = £14.286M
3.6.2 Operational Costs
While capital costs make up the majority of the wind outlay, operational cost must not be ignored.
These costs cover insurance, maintenance, repair, spare parts and administration amongst others.
Operational costs vary more considerably however EWEA suggest values of 1.2-1.5c€/kWh. Updating
this to current UK prices gives a top value of £15/MWh; the value used in this analysis.
Total Operating Costs = £387630/year
3.6.3 - Income
The income generated from sale of electricity to energy companies was calculated using an assumed
current market sale price of £55/MWh. In addition to this the sale of Renewable Obligation
Certificates (ROCs) at a rate of 0.9 ROC/MWh acquires a further £38.31/MWh (as of 25 Jan 2014)[3.16]
and Levy Exemption Certificates (LECs) a further £4.50/MWh. This gives a current overall price of
£97.81/MWh, this value is however highly variable. Projects beginning before 2017 have the option
of either opting into the ROC scheme or the newly introduced Feed-In Tariff with Contract for
Difference scheme (FiT CfD). The new government scheme offers a strike rate for onshore wind of
£95/MWh for the next three years, dropping to £90/MWh in 2017/18.[3.17]
This seems less profitable
but would offer investors greater security against varying rates in the current RO scheme. A
comparison is provided in the sensitivity analysis.](https://image.slidesharecdn.com/8af95c6b-080d-45bb-a1f2-c3481c61aad9-160830163451/85/Integrated-systems-design-project-22-320.jpg)
![18
3.6.5 Outcome
Using the values described above, a discounted cash flow analysis was carried out over a 20 year
period (the anticipated design life of the wind farm). A discount rate of 3.5% was used as per the
Treasury Green Book [3.18]
. It was calculated that the scheme has a payback period of about 7.8 years
and after 10 years has a NPV of £3.284M with an IRR of 8%, with the following results recorded:
Net Present Value = £15.20 M
Internal Rate of Return = 13.5%
Levelised Cost of Energy = £56.08/MWh
Profitability Index = 1.744
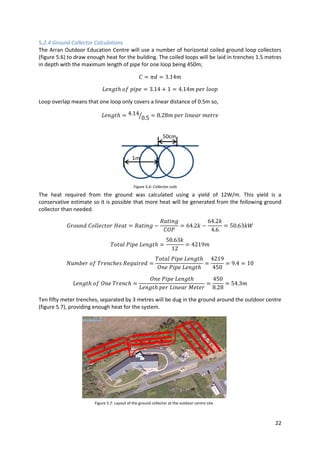
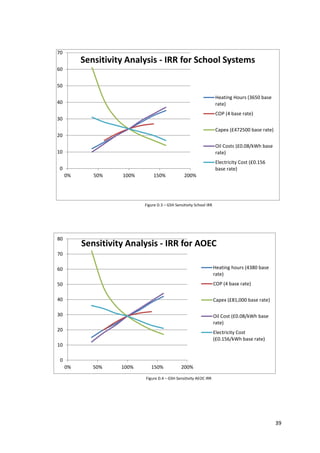
3.6.6 Sensitivity Analysis
The effects of opting for the FiT CfD strike price system compared with the current RO scheme are
shown below:
The results show a 16% decrease in Net Present Value if using the FiT CfD scheme. IRR also drops by
1.3% (a 10% decrease) and the Profitability Index is reduced by 7%.
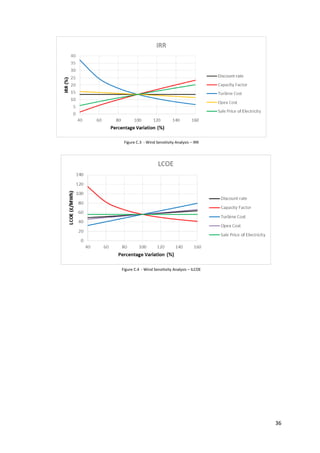
A full sensitivity analysis was carried out considering the effect of a change of up to 60% in certain
variables (Discount Rate, Capacity Factor, Turbine Cost, Opex Costs, Sale Price of Electricity) on the
NPV, IRR, Profitability Index and LCOE. The results for NPV are shown in Figure 3.4.6.2 below with
the remaining results in Appendix C. The sensitivity analysis shows that even with a pessimistic 20%
change in all considered variables, the scheme is still profitable with a NPV of £1.11M (IRR = 5%;
LCOE = £82.76/MWh; P.I. = 1.05). Conversely a 20% optimistic change in all variables gives a NPV of
£33.0M (IRR = 26%; LCOE = £38.06/MWh; P.I = 2.86). This is illustrated in the figure below:
Figure 3.10– ROC vs FiT CfD Sensitivity
Analysis
-20000000
-15000000
-10000000
-5000000
0
5000000
10000000
15000000
20000000
0 1 2 3 4 5 6 7 8 9 10 11 12 13 14 15 16 17 18 19 20 21
NetPresentValue(£)
Time (years)
ROC FiT CfD
-5
0
5
10
15
20
25
30
35
40 90 140
NPV(£million)
Percentage Variation (%)
NPV
Discount rate
Capacity Factor
Turbine Cost
Opex Cost
Sale Price of Electricity
Figure 3.11 – Graph of Net Present Value
Analysis](https://image.slidesharecdn.com/8af95c6b-080d-45bb-a1f2-c3481c61aad9-160830163451/85/Integrated-systems-design-project-23-320.jpg)
![19
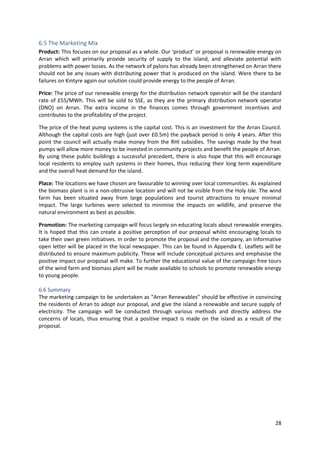
4. Grid Integration
4.1 Connection to Existing Infrastructure
Both the wind farm and biomass plant will connect to Arran’s existing grid infrastructure[4.1]
. The SSE
map below shows the existing high voltage lines on Arran[4.1]
. The solid red lines are 11kV lines and
the solid green lines are 33kV lines
4.2 Wind Farm
It is proposed that the wind farm will be connected to the end of the 33kV line at Whiting Bay. This
will require approximately 3km of 33kV lines to be built directly to the connection point as by the
dashed green line on the map below. The lines to be constructed will be above-ground cables, as
due to a number of waterways and areas of forestry which must be traversed; it would be a non-
trivial matter to lay these lines underground. The costs of this have been factored into the CAPEX
calculations for the wind farm. No transformation will be necessary in the site substation, as each
turbine will be equipped with a 690V-33kV step-up transformer in its base [4.2]
.
4.3 Biomass Plant
The biomass plant will be connected to the 11kV line running north from Kilmory. This will require
less than 1km of additional 11kV line to reach the proposed site as shown by the dashed red line on
the map. The biomass plant will generate at 11kV [2.10]
so a transformer will not be required.
However all of the necessary control circuitry will be implemented.
The biomass plant generates 3.45MW with a power factor of 0.8 [2.10]
.This gives an apparent power
rating of
The apparent power capacity of the 11kV line is 7MVA [4.3]
and therefore has the capacity to be
connected to the biomass plant.
The close proximity to a suitable power line minimises the costs of grid integration and was a factor
in choosing the site. These costs were factored into the CAPEX cost of the biomass plant.
Figure 4.1: SSE map of high voltage lines on Arran, 2013
4.4 Protection and Switch Gear
As the highest voltage under consideration is 33kV, it has been determined that gas-insulated
(Sulphur Hexafluoride) switchgear [4.4]
will be used for the protection of grid-connected equipment.
Two switchgear systems will be installed, one at the wind farm and another at the biomass plant.](https://image.slidesharecdn.com/8af95c6b-080d-45bb-a1f2-c3481c61aad9-160830163451/85/Integrated-systems-design-project-24-320.jpg)
![20
Figure 5.2: Technical specifications, and dimensions of the SI TE models being used in the
school.
5 Ground Source Heat Pumps
5.1 Location:
In order to help reduce the oil usage on Arran the heating systems in public buildings that currently
use oil for heating will be replaced by a modern, efficient heat pump solution that will be electrically
powered. As well as making Arran more environmentally friendly, these instillations will also reduce
heating bills for the council. Three public buildings on Arran have been selected as suitable
candidates for heat pump installation. These are Arran High School, Lamlash Primary School (shown
in green), and the Arran Outdoor Activity Centre (in purple) as shown in figure 5.1. The schools will
share a heat pump system as they are so geographically close.
5.2 Technical Details
5.2.1 Schools
The schools have a combined area of 8,752m2
(7,728m2
for the high school and 1,024m2
for the
primary school)[5.1]
. The capacity of heat pump required was calculated using a heat requirement per
square meter of 50W/m using which is the BSRIA rule of thumb for the average peak load of a new
building [5.2]
.
Case studies from other commercial heat pump projects suggest that the heat pump capacity needs
to be roughly 80% of the peak load [5.3]
;
A 350kW system will be integrated into the schools. Three Dimplex SI 100 TE heat pump units will
supply the heat for the high school and one Dimplex SI 50 TE heat pump [5.4]
. The two systems will
take heat from the same vertical ground collector system. The large heat pumps will use twin
compressors at B0/W35 will give a rated 96.5kW with a COP of 4.6 and the small heat pump will be
single compressor at B0/W35 which will give a rated heat output of 46.7kW with a COP of 4.5. The
pumps can give water temperatures of up to 600
C which should be an acceptable temperature to
integrate the heat pumps into the already existing radiator network (figure 5.2).
Figure 5.1: Location of heat pumps
projects](https://image.slidesharecdn.com/8af95c6b-080d-45bb-a1f2-c3481c61aad9-160830163451/85/Integrated-systems-design-project-25-320.jpg)
![21
5.2.2 Ground Collector System
The heat pump system will draw its heat from a network of vertical boreholes. The British Geological
Survey indicates there have been several 0-10m boreholes drilled near the school along with one,
10-30m borehole and two 30m+ boreholes in the nearby area (figure 5.3). The survey suggests the
ground underneath the school is primarily sandstone which should give around 30 watts per meter
of pipe used. One borehole will contain two loops of pipe giving four lengths of pipe per borehole
therefore;
This figure is subject to variation after a full geological survey of the area has been undertaken
(figure 5.4). The boreholes will be drilled in the school playing fields, preferably taking up an area in
the south west corner away from the sports pitches to ensure minimal disruption to the school.
5.2.3 Arran Outdoor Education Centre
The outdoor centre has a floor area of 1,431m2 [5.1]
. Using the same BSRIA value of heat per meter
squared and same percentage value as for the school, the required peak heat load of the building
and rated heat capacity of the heat pump system were calculated;
A 60kW system will be implemented in the outdoor centre using two Dimplex SI 30 TE heat pump
units which will use twin compressors at B0/W35, giving a combined rated output of 64.2kW with a
COP of 4.6 (figure 5.5) [5.3]
. As the Arran Outdoor Education Centre is also a relatively new building it
should be possible to integrate the system into the existing radiator and hot water network.
Figure 5.3: BGS borehole survey of the area surrounding Arran High
School. Purple = 0-10m, Green = 10-30m, Red = 30m+
Figure 5.4: School Grounds highlighting the
preferred area that the boreholes will be drilled.
Figure 5.5: Technical specifications and dimensions of the SI 30 TE being used in the
outdoor education centre heat pump network.](https://image.slidesharecdn.com/8af95c6b-080d-45bb-a1f2-c3481c61aad9-160830163451/85/Integrated-systems-design-project-26-320.jpg)
![23
5.3 Environmental and Social Considerations
5.3.1 Carbon Emission Savings:
Ground source heat pumps when powered by green electricity have zero carbon emissions. The use
of GSHP’s combined with the biomass plant and wind farm will significantly reduce the total carbon
emissions of the buildings in which they are implemented.
5.3.2 Energy needs of buildings:
The schools require 350kW of power and use an average of 10 hours of heating a day (this figure is
based on estimates given verbally by the school), and 3650 hours in total throughout the year. The
schools therefore require 1277500kWh of heating a year.
Arran Outdoor Education Centre requires 60kW of power and uses an approximate average of 12
hours of heating a day (again verbal estimates from the centre), and 4380 hours in total throughout
the year. Arran Outdoor Education Centre therefore requires 262800kWh of heating a year.
Heat Source Oil Fired Boiler Ground Source Heat
Pump + Conventional
Electricity
Ground Source Heat
Pump + Green Electricity
Emission Levels (kg CO2/kWh of heat) 0.45 – 0.48 0.20 – 0.27
[5.5]
0.00
[5.5]
Operational Emissions for School (kg CO2/year) 574875 – 613200 255500 – 344925 0
Operational Emissions of Outdoor Centre (kg
CO2/year)
118260 – 126144 52560 – 70956 0
Maximum Total Reduction in Emissions
Compared to Current System (kg CO2/year)
0 323463 739344
5.3.3 Carbon Payback Period of Heat Pump Project:
Heat Pump Energy Output = 1540.3 MWh/year
Energy Carbon Factor of Oil Heating = 434 kg/MWh
Total Carbon Saving Compared to Oil Heating = 434 x 1540.3 = 668490 kg/year
Source of CO2 Point of Emission Resultant Emission (kg CO2)
Heat Pump Units Unit Manufacture, 2928kg of metal product
[5.6]
1000
[5.7]
Plastic Pipes Manufacture, 4430kg of plastic
[5.8]
15500
[5.9]
Excavation Work Approximately 300h digging/drilling, 8000L diesel
[5.10]
20800
[5.11]
Total 37300
Carbon Payback Period = 37300/668492 = 0.056years approximately 3 weeks
Table 5.1 – Carbon Emission Savings
Table 5.2– Construction CO2 emissions](https://image.slidesharecdn.com/8af95c6b-080d-45bb-a1f2-c3481c61aad9-160830163451/85/Integrated-systems-design-project-28-320.jpg)
![24
5.3.4 Chemical Pollutants
Monoethylene glycol is used as antifreeze in the ground source heat pumps. It is classified as mildly
toxic and can become a pollutant if there is discharge of water waste or leakage from the system.[5.13]
Observed doses of 1221 milligrams per kilogram of body weight in ducks were reported to have no
effect.[5.15]
This is largely irrelevant because there would need to be a significant leakage of
monoethylene glycol directly into the water source for it to be consumed in the first place. This risk
is negligible if regulations and sensible installation instructions are followed. Furthermore, when
leaked into soil the bacteria present will break down the monoethylene glycol in a matter of weeks,
leaving no long term residual monoethylene glycol present.[5.15]
With the closed loop systems used in
this installation there should be no leakage of water. Monoethylene glycol pollution is not a major
concern for this project.
For vertical boreholes, the pipes are often secured in place using a bentonite grout which may also
contain silica. These substances are only considered dangerous if they are inhaled as dust. When
secured into grout they will not be mobilized in the air and therefore will not pose a threat to health.
They are not considered to be detrimental to the environment [5.15]
.
5.4 Finance
The net present value, IRR and profitability of the heat pumps were calculated over the course of a
20 year period (the life expectancy of a ground source heat pump can often exceed this so the
profitability of the heat pumps could actually be greater over their lifetime). To make these
calculations the initial capital costs of the installations were estimated. The running costs of the
current oil boiler and proposed heat pump systems were estimated and the savings were calculated
and treated as an income on a year by year basis.
5.4.1 Standard energy prices used in calculations
Cost of oil = £0.08/kWh[5.16]
of thermal energy produced by boiler (this already takes into account
average boiler efficiency) [reference]
Cost of electricity = £0.156/kWh[5.17]
5.4.2 Renewable Heat Incentive Subsidies
The Renewable Heat Incentive (RHI) provides subsidies based on the energy use of buildings. The
subsidies are 8.7p/kwh for first 1314 hours and then 2.6p/kWh for every hour thereafter [5.18]
.
Applying for these subsidies means that public grants will not be available; however these subsidies
are more profitable for the schools than even a full CAPEX grant would be over the 20 year period.
5.4.3 Costs and Savings in the Schools
The capital cost of the heat pump in the school was based on an estimate from Dimplex of £1200 -
£1500 per kW of installed capacity for the heat pump and collector. The capital cost estimate was
then taken to be £1350 per kW. So for the total 350kW system the estimated capital cost is £472500.
The total cost of running the current oil boiler was estimated to be £104400. This is based on a fuel
cost of £0.08 per kWh of thermal energy produced [5.16]
and a maintenance cost of £2200 on average
per year[5.19]
.
The costs of running the heat pumps in the school were calculated using a COP of 4 (as a
conservative estimate – it has been varied in the sensitivity analysis). The heat pumps require
319375kWh of electricity at a cost of £0.156 per kWh, leading to a cost of £49822 per year.](https://image.slidesharecdn.com/8af95c6b-080d-45bb-a1f2-c3481c61aad9-160830163451/85/Integrated-systems-design-project-29-320.jpg)
![25
The subsidies as outlined above provide an income to the school of 350kW x 1314hours x
£0.087/kWh + 350kW x 2336hours x £0.026/kWh = £61268.90 [5.18]
. This means the school will
actually make £11,146.40 per year by using the ground source heat pumps.
Therefore the total savings with the ground source heat pumps will be approximately £115546.40
per year.
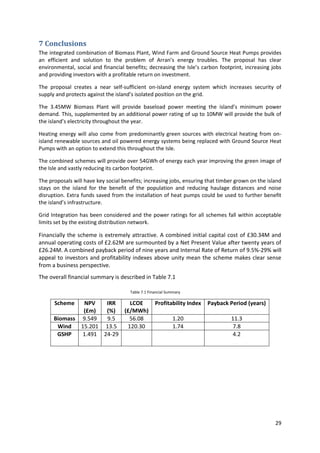
Net Present Value = £1,227,168.75
Internal Rate of Return = 24%
5.4.4 Costs and Savings in Arran Outdoor Education Centre
The capital cost was estimated using the same method as above and is predicted to be £81,000. The
operating costs of fuel and maintenance for the current oil boiler system were estimated to be
£22124 per year [5.16]
.
The costs of running the heat pump were also estimated using a COP of 4 (this has been varied in the
sensitivity analysis). The cost of electricity for AOEC is predicted to be £10249.20 per year [5.17]
. The
income through the RHI subsidy is estimated to be £11642 per year [5.18]
. This means the school
would have an overall income of £1292.84 per year.
This leads to a total saving of £23416 per year.
Net Present Value = £263,457.91
Internal Rate of Return = 29%
Figure 5.4 Net Present Values of both heat pump projects.
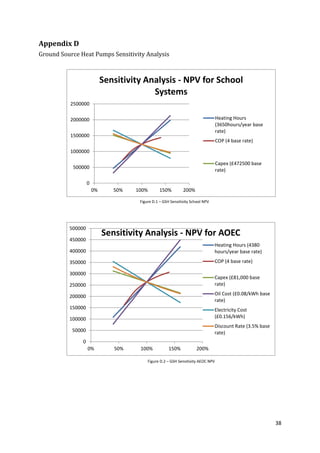
5.4.5 Sensitivity Analysis
Full sensitivity analysis was carried out looking at how the NPV and IRR vary with differences in
heating hours, COP, CAPEX, oil cost, electricity cost, and discount rate. The graphs of this analysis are
shown in Appendix D.
-1000000
-500000
0
500000
1000000
1500000
0 5 10 15 20 25
CumulitiveNetPresentValue(£)
Years
Net Present Values for Heat Pumps
Schools
AOEC](https://image.slidesharecdn.com/8af95c6b-080d-45bb-a1f2-c3481c61aad9-160830163451/85/Integrated-systems-design-project-30-320.jpg)
![26
6. Marketing
6.1 Introduction
The influence of public opinion is an important factor to ensure the proposal can go ahead, and
create positive perceptions of the suggested renewable energy solutions. A strong marketing
campaign will therefore be implemented in order to highlight the positive impact the proposal can
have for the island.
6.2 Public perceptions
The public perceptions on Arran are essential to the marketing campaign for this proposal. A survey
conducted by the Department of Energy and Climate Change (DECC) [6.1]
found that 76% of people
were supportive of using renewable energy to provide electricity and heating; 68% supported
further construction of on-shore wind farms. A YouGov poll showed similar levels of support for on-
shore wind farms with 56% in support and a 2006 poll of 127 of Arran’s residents showed 75%
supported wind farms (as previously documented in Section 3) [3.5]
The DECC poll highlighted that 64% of UK residents had not heard of/considered ground source heat
pump use. This suggests that the profitability and green credentials of the heat pump systems
should be emphasised to the public to enhance perceptions of the proposal.
It was also found that 60% of UK residents supported the use of biomass plants as a renewable
energy source. However, a recent proposal for a biomass plant on Arran had been met with
overwhelming negativity from local residents.
6.3 Campaign focus
Based on the surveys carried out it was clear that the main focus of the marketing campaign should
be:
To inform residents of the facts and benefits of using ground source heat pumps.
To continue to reinforce the positive perception residents had of wind farms, whilst
highlighting positives to those opposed.
To clearly outline the vital differences between our biomass proposal and the proposal
rejected previously by residents.
Figure 6.1: Results of 2006 survey of Arran residents,
asking their views on wind farms](https://image.slidesharecdn.com/8af95c6b-080d-45bb-a1f2-c3481c61aad9-160830163451/85/Integrated-systems-design-project-31-320.jpg)
![27
6.4 Campaign implementation
SWOT and PESTEL analyses were undertaken as an initial basis for the direction of the marketing
campaign. These can be found in Appendix E.
Security of supply is a key focus of the campaign. It will be emphasised that extreme weather
conditions, such as those experienced in March 2013 will not result in complete loss of power for the
island - if the proposal goes ahead. By installing the integrated system proposed, the dependency
on the national grid will be minimal, thus significantly reducing the islands vulnerability. Both the
Biomass Plant and Wind Farm depend on no importation from the mainland and the installation of
Ground Source Heat Pumps will significantly increase the energy efficiency of the buildings where
they are installed.
Another main focus of the marketing campaign is to take the issues highlighted by Arran Energy
Action Group (AEAG), and comprehensively define why our biomass proposal would not have the
same problems. The reason for the failure of the Northern Energy proposal was due to the level of
opposition from the AEAG. The main problems put forward by the group are outlined below,
followed by the measures taken by the proposal to appease these concerns:
Health implications: One of AEAG’s main concerns was with the health implications related to the
emissions of particulate matter. The proposed biomass plant will make use of significant scrubbers,
filters, and catalytic converters to significantly reduce any negative impact on air quality that was of
concern with the previous proposal. This will also lessen the visual impact of the emissions from the
chimneys
Visual impacts and tourism: The greatest concern with the NEDL proposal was the visual impact of
the plant. Being positioned close to the east coast, the main visibility problem focussed on the fact
that the plant and its emissions would be visible from the Holy Isle. This is a great tourist attraction,
and so the people of Arran were opposed based on their own objections and with the prospect of
reduced tourism. For this reason the starting point for our biomass plant has been to ensure it is not
visible from the Holy Isle or main populations of Arran. The location we have chosen is non-obtrusive
and should appease the public concerns.
Energy Efficiency: The AEAG was concerned with the use of excess heat from the plant – it was
viewed as inefficient and wasteful of resources. Whilst these concerns were expressed it was clear
that the plant could not be situated in a position of high visibility, which ruled out the prospect of a
CHP plant with district heating. This is because district heating schemes are only effective with plants
in close proximity (roughly 3.5km) [6.2]
to their heating destinations, mainly due to financial viability.
This would require the plant to be close to populations and with a high level of visibility. To address
this issue we have chosen a site on the south of the island and will instead use the excess heat from
the plant for pellet production; thus increasing efficiency and removing the perception of the plant
of being wasteful of resources. This allows the plant to produce more electricity with fewer
resources.
Traffic: AEAG were concerned that the biomass plant would greatly increase traffic on public roads
due to the large number of lorry loads delivering wood fuel to the site. However, the site that we
have chosen is alongside half of the feedstock reducing transport needs dramatically, as detailed in
the biomass proposal.](https://image.slidesharecdn.com/8af95c6b-080d-45bb-a1f2-c3481c61aad9-160830163451/85/Integrated-systems-design-project-32-320.jpg)
![35
0
0.5
1
1.5
2
2.5
3
3.5
40 60 80 100 120 140 160
ProfitabilityIndex
Percentage Variation (%)
Profitability Index
Discount rate
Capacity Factor
Turbine Cost
Opex Cost
Sale Price of Electricity
Wind Carbon Payback
Annual Energy Output: 25842MWh
Total Carbon Savings: Energy carbon factor for grid = 0.434[3.9]
25,842 x 0.434 = 11,215 tonnes/year
CO2 construction production: Bases = 4 x 248 = 992 tonnes
Turbines = 1189 tonnes/MW x 10MW (capacity) = 11890 tonnes
Additional (access roads, concrete production, scaled data) = 3030 tonnes
Deforestation = 13.2tonnes/hectare/year – at 7 hectares = 92.4 tonnes/year
Back-up power[3.10]
: Rated capacity = 87600 MWh/year
Back-up power generation requirement (5% capacity) = 4380 MWh/yr
Additional production requirement due to thermal efficiency reduction (10% of back-up power) =
438MWh/yr
Annual CO2 emissions for back up = 438 x 0.434 = 190 tonnes/year
Carbon Payback Period: (992+11890+3030)/(11215-92.4-190) = 1.46 years = 1 year 5.5 months
Wind Sensitivity Analysis
Table C.2- Reactive Power and Compensation
Figure C.2 – Wind Sensitivity Analysis – PI](https://image.slidesharecdn.com/8af95c6b-080d-45bb-a1f2-c3481c61aad9-160830163451/85/Integrated-systems-design-project-40-320.jpg)
![55
biomass-09.pdf
2.19 Business Electricity Prices [Last accessed: 16/02/14]
http://www.businesselectricityprices.org.uk/retail-versus-wholesale-prices/
2.20 Variable Pitch: Renewable Obligation Certificate Rates [Last accessed: 16/02/14]
http://www.variablepitch.co.uk/finance/rates/ROC/
2.21 H. Dickinson, phd business consultants, business consultants to PEBOC biomass project,
Anglesey, Wales
2.22 D. Jones, G. Hogan, ”Potential woodfuel CHP plant at Westonbirt Arboretum, Initial
feasibility study and technology assessment” , November 2006 *Last accessed on 07/02/14+
http://www.biomassenergycentre.org.uk/pls/portal/docs/PAGE/BEC_TECHNICAL/RESEARCH%2
0AND%20STUDIES/COMBINED%20HEAT%20AND%20POWER%20STUDIES/WESTONBIRT%20WO
ODFUEL%20REPORT.PDF
3. Wind
3.1 NOABL UK Wind Map
Available at rensmart.com
3.2 Arran Birding. arranbirding.co.uk
3.3 Whitelee Wind Farm: whiteleewindfarm.co.uk
3.4 Renewable Energy 4 Lecture Slides. Prof Paul Younger 2013
3.5 GE Energy: Technical Description: Wind Turbine Systems 2.5/275MW: General Specification
3.6 GE Energy: Technical Description: Wind Turbine Systems 2.5/2.75MW: Electrical Grid
Specificaitons
3.7 Green Power International Scoping Report April 2007
3.8 Direct Contact with Forestry Commission via email.
3.9 GE Energy: Technical Documentation: Wind Turbine Generator Systems, 2.5-2.75 Series:
Specifications - Site Roads and Crane Pad”, §3.2: “Turning Curves”
3.10 British Geological Survey
Available at bgs.ac.uk/data/boreholescans/home.html
3.11 Renewable Energy Solutions: Penmanshiel Wind farm Appendix 17.1 Carbon Balance
Calculations. Available: http://www.penmanshiel-
windfarm.co.uk/media/18877/Appendix%2017-1.pdf
3.12 Wind Action: A guide to calculating the carbon dioxide debt and payback time for wind farms
Available at windaction.org/posts/7149-a-guide-to-calculating-the#.Uvd6Zl_vlU
3.13 Viking Energy. Appendix A16.6: Carbon Payback Calculations
Available:www.shetland.gov.uk/planningcontrol/documents/AppendixA16.6CarbonPaybackCalc
ulations.pdf
3.14 The Economics of Wind Energy: A report by the European Wind Energy Association
3.15 International Renewable Energy Agency: Renewable Energy Technologies: Cost Analysis
Series. Volume 1: Power Sector. Issue 5/5. Wind Power. June 2012.
3.16 e-ROC: Online ROC Auction Service - www.e-roc.co.uk/trackrecord.htm
3.17 Department of Energy and Climate Change: Investing in renewable technologies = CfD
contract terms and strike prices. December 2013
3.18 HM Treasury: The Green Book. Appraisal and Evaluation in Central Government](https://image.slidesharecdn.com/8af95c6b-080d-45bb-a1f2-c3481c61aad9-160830163451/85/Integrated-systems-design-project-60-320.jpg)