Integrated Framework for Advanced Statistical Computing and Data Analytics in Multidisciplinary Applications
1.
Page 1 of10
FORM 2
THE PATENT ACT, 1970
(39 of 1970)
&
THE PATENTS RULES, 2003
COMPLETE SPECIFICATION
(See section10 and rule13)
1. TITLE OF THE INVENTION: "Integrated Framework for Advanced Statistical
Computing and Data Analytics in Multidisciplinary Applications"
2. APPLICANTS
Name Nationality Address
Vipin Mittal Indian 313, Housing Board Colony, Jind, Haryana, India
Dr. Neha Mittal Indian Assistant Professor, Department of Mathematics,
Shaheed Major Sanjeev Lather Government College
Julana, Jind, Haryana, India
Dr. Alpana Sharma Indian Assistant Professor, Department of Mathematics,
P.I.G.G.C.W. Jind, Haryana, India
Dr. Mohit Sharma Indian Assistant Professor, Department of Computer Science
& Engineering, NIILM University, Kaithal, Haryana,
India
Pinki Devi Indian Assistant Professor of Hindi, Govt. College Chhattar,
Jind, Haryana, India
Dr. Bhawana Sharma Indian Assistant Professor, Department of Computer Science,
Govt. College Chhachhrauli, Yamunanagar, Haryana,
India
3. PREAMBLE TO THE DESCRIPTION:
The following specification particularly describes the invention and the manner in which it is
to be performed.
2.
Page 2 of10
4. DESCRIPTION:
FIELD OF THE INVENTION
The present invention aims to show the "Integrated Framework for Advanced Statistical
Computing and Data Analytics in Multidisciplinary Applications".
BACKGROUND OF THE INVENTION
The rapid growth of data generation across diverse disciplines, including engineering,
healthcare, social sciences, business, and environmental studies, has led to a pressing need for
advanced methodologies and tools that can process, analyze, and derive meaningful insights
from vast amounts of data. Traditional statistical methods, while effective in limited or small-
scale scenarios, often lack the scalability, adaptability, and computational efficiency required
for modern, large-scale, and complex datasets. Additionally, these methods frequently operate
in isolation, requiring significant manual intervention to integrate with domain-specific
computational frameworks and tools.
Simultaneously, advancements in computer science, such as machine learning, artificial
intelligence, and distributed computing, have introduced powerful algorithms and
computational architectures. However, these developments are often not seamlessly integrated
with robust statistical models, leading to fragmented and inefficient analytical workflows. This
disconnect creates barriers for researchers, analysts, and practitioners who seek to combine the
strengths of both fields to address multidisciplinary challenges effectively.
Existing solutions in the field of statistical computing and data analytics are either narrowly
focused or domain-specific, limiting their applicability to broader research and operational
scenarios. Furthermore, these solutions often require specialized knowledge of programming
and software engineering, creating a steep learning curve for statisticians, scientists, and
business professionals who are not experts in computer science. As a result, the potential for
leveraging interdisciplinary approaches to solve complex problems remains largely untapped.
The advent of cloud computing, big data platforms, and high-performance computing
infrastructure has provided an unprecedented opportunity to design integrated frameworks that
can unify statistical methods with computational science. However, the lack of a cohesive
framework capable of integrating statistical modeling, computational algorithms, and domain-
specific requirements under a single, user-friendly platform continues to be a significant
limitation.
3.
Page 3 of10
This invention addresses these challenges by introducing an Integrated Framework for
Advanced Statistical Computing and Data Analytics in Multidisciplinary Applications.
The proposed framework leverages cutting-edge advancements in computer science and
statistics, offering a modular, scalable, and highly interoperable solution for data analysis. It is
designed to bridge the gap between statistical methodologies and computational tools, enabling
researchers and practitioners to harness the full potential of both disciplines.
The invention provides a novel combination of features, including:
1. Automated Model Selection and Customization: Integrating machine learning
algorithms to automate the selection, calibration, and optimization of statistical models
for a wide range of applications.
2. High-Performance Computing Integration: Utilizing parallel processing and
distributed computing to handle large-scale datasets and computationally intensive
tasks efficiently.
3. Domain-Agnostic Applicability: A modular design that supports a variety of
disciplines by providing customizable libraries and workflows tailored to specific
needs.
4. User-Friendly Interface: Simplified interfaces that lower the technical barriers for
users, enabling them to focus on problem-solving rather than the complexities of the
underlying algorithms.
5. Real-Time Data Processing: Capabilities for processing streaming data in real-time,
making it suitable for applications requiring immediate insights, such as healthcare
monitoring and financial forecasting.
By integrating these features, this invention not only enhances the efficiency and precision of
data analysis but also democratizes access to advanced analytics tools across disciplines. It
represents a significant step forward in addressing the growing demand for scalable,
interoperable, and user-centric solutions in statistical computing and data analytics.
INTERPRETATION AND VISUALIZATION
The ability to interpret and visualize data effectively is a critical component of modern
statistical computing and data analytics. Despite the advancements in statistical modeling and
computational techniques, the translation of complex analytical outputs into clear, meaningful,
4.
Page 4 of10
and actionable insights remains a significant challenge. Many existing solutions fail to provide
intuitive visualization tools that can convey sophisticated results to diverse audiences,
particularly those without a technical background.
This invention addresses the critical need for robust interpretation and visualization capabilities
as an integral part of the Integrated Framework for Advanced Statistical Computing and
Data Analytics in Multidisciplinary Applications. The framework is specifically designed to
bridge the gap between data analysis and decision-making by providing advanced yet user-
friendly tools for interpretation and visualization.
Key features of the interpretation and visualization module include:
1. Dynamic Visualization Tools:
o Interactive dashboards and visualization tools that allow users to explore data
and model outputs in real-time.
o Customizable visual elements such as charts, graphs, heatmaps, scatter plots,
and 3D representations tailored to specific use cases.
2. Context-Aware Visualizations:
o The framework dynamically adjusts visualizations based on the type of data, the
statistical model applied, and the analytical context, ensuring that outputs are
both relevant and comprehensible.
o For example, time-series data may automatically generate interactive trend
lines, while categorical data could produce hierarchical tree maps or cluster
diagrams.
3. Explainable Analytics:
o Advanced interpretability features powered by explainable artificial intelligence
(XAI) to help users understand the underlying mechanics of predictive models
and statistical computations.
o Visual overlays and annotations that highlight significant variables,
relationships, and anomalies in the data, making it easier to understand complex
interactions.
4. Integration with Natural Language Generation (NLG):
5.
Page 5 of10
o Automated generation of textual summaries that complement visualizations by
describing trends, patterns, and key takeaways in plain language.
o These summaries are context-sensitive and tailored to the user’s level of
expertise, ensuring that insights are accessible to both technical and non-
technical stakeholders.
5. Real-Time Monitoring and Alerts:
o Integration with streaming data pipelines to visualize real-time analytics,
enabling users to monitor dynamic processes such as financial markets, supply
chain operations, or healthcare monitoring systems.
o Threshold-based alerting systems that trigger visual and textual notifications
when critical events or anomalies occur.
6. Collaborative and Cross-Platform Visualization:
o The visualization module supports collaboration through shareable dashboards,
exportable reports, and cloud-based integration, making it easy for teams to
collaborate on insights.
o Cross-platform compatibility ensures that visualizations can be accessed
seamlessly on desktops, tablets, and mobile devices.
7. Multi-Layered Drill-Downs:
o Users can drill down into visualizations to explore finer levels of granularity,
such as analyzing individual data points, subgroups, or specific time intervals.
o Multi-layered visualizations allow users to toggle between summary views and
detailed analytical results.
8. Support for Multidisciplinary Applications:
o Visualizations are designed to accommodate the diverse requirements of
multidisciplinary applications, including engineering simulations, medical
imaging, environmental modeling, and business intelligence.
o For instance, heatmaps for environmental data, process flow diagrams for
engineering studies, and ROI (Return on Investment) dashboards for business
analytics can all be generated within the framework.
6.
Page 6 of10
The interpretation and visualization module of the framework serves as a pivotal bridge
between raw analytical outputs and actionable insights. By combining advanced computational
techniques with user-friendly and visually compelling tools, this invention ensures that
stakeholders at all levels can derive maximum value from data analytics. It empowers decision-
makers to make informed choices based on clear, accessible, and contextually relevant insights.
SUMMARY OF THE INVENTION
The present invention introduces an Integrated Framework for Advanced Statistical
Computing and Data Analytics in Multidisciplinary Applications, a comprehensive
solution designed to unify statistical methodologies with advanced computational tools. This
invention addresses the challenges posed by large-scale, complex datasets and the need for
seamless integration of statistical models with modern computing technologies.
The framework is modular, scalable, and domain-agnostic, enabling users from diverse fields
such as engineering, healthcare, environmental sciences, and business to perform sophisticated
data analysis with ease. It features automated model selection, high-performance computing
integration, and real-time data processing capabilities. The invention also includes a robust
interpretation and visualization module that translates complex analytical outputs into
dynamic, user-friendly visualizations and context-sensitive insights, empowering stakeholders
to make data-driven decisions efficiently.
By bridging the gap between statistical analysis and computational science, this invention
offers a revolutionary platform that enhances analytical accuracy, scalability, and usability
across multidisciplinary applications.
BRIEF DESCRIPTION OF THE DRAWINGS
The accompanying drawings illustrate various aspects of the Integrated Framework for
Advanced Statistical Computing and Data Analytics in Multidisciplinary Applications,
and are referenced throughout the description of the invention:
• Figure 1: Causal Diagram for stated hypotheses of the Integrated Framework for
Advanced Statistical Computing and Data Analytics.
• Figure 2: A high-level architectural diagram of the integrated framework, illustrating
the components of the statistical computing module, machine learning-based model
selection, real-time data processing pipeline, and visualization/interpretation module.
7.
Page 7 of10
• Figure 3: A flowchart of the data ingestion, preprocessing, and model optimization
process, highlighting key stages such as data cleaning, feature engineering, and
statistical model selection.
• Figure 4: An example of dynamic visualizations generated by the framework,
demonstrating various types of charts and graphs produced by the visualization and
interpretation module.
• Table 1: Python-based Natural Language Generation (NLG) module for an integrated
framework.
• Table 2: Table Structure for Natural Language Generation (NLG) module for an
integrated framework in the context of an integrated framework for advanced statistical
computing and data analytics.
• Table 3: Dynamic generation of insights in dashboards using Python (FastAPI for
REST).
• Table 4: Dynamic generation of insights in dashboards using Python (GraphQL).
• Table 5: Query Example with Response (FastAPI for REST).
• Table 6: Query Example with Response (GraphQL).
• Figure 5: A user interface screenshot displaying interactive dashboards and natural
language-generated summaries, providing insights into the framework’s interpretation
and visualization capabilities.
BRIEF DESCRIPTION OF THE INVENTION
The invention provides an Integrated Framework forAdvanced Statistical Computing and
Data Analytics in Multidisciplinary Applications that combines state-of-the-art statistical
methodologies with advanced computational techniques to address the challenges of modern
data analysis.
The framework includes modular components that enable automated model selection,
predictive modeling, and real-time data processing, making it adaptable to a wide range of
applications. It incorporates high-performance computing capabilities, such as parallel
processing and distributed computing, to handle large-scale and complex datasets efficiently.
8.
Page 8 of10
A key feature of the invention is its interpretation and visualization module, which generates
dynamic and interactive visualizations, contextual insights, and automated natural language
summaries. These tools make complex analytical results accessible and actionable for users
across various domains.
Designed to be scalable, domain-agnostic, and user-friendly, this invention streamlines the
process of analyzing data, enabling professionals from engineering, healthcare, business, and
other disciplines to derive actionable insights while minimizing technical barriers.
9.
Page 9 of10
5. CLAIMS
We Claim:
1. A framework for advanced data analytics, comprising: a statistical computing
module, a high-performance computational engine, and a machine learning-based
model optimization system.
2. A system for real-time data analysis, further comprising: a streaming data pipeline
and a data storage interface compatible with relational, NoSQL, and cloud
architectures.
3. A visualization and interpretation module integrated within the framework,
including: interactive visual tools, explainable analytics features, and natural language-
generated summaries.
4. A method for performing advanced statistical analysis, comprising the steps of:
ingesting, preprocessing, modeling, and visualizing data using automated workflows.
5. A multidisciplinary data analytics framework, configured to: integrate with third-
party systems via APIs and provide cross-platform accessibility through web and
mobile interfaces.
6. A scalable and customizable platform, designed to: support domain-agnostic
applications in healthcare, engineering, business intelligence, and environmental
science.
6. DATE & SIGNATURE
Dated this 26th day of January 2025.
Vipin Mittal Dr. Neha Mittal Dr. Alpana Sharma
Dr. Mohit Sharma Pinki Devi Dr. Bhawana Sharma
10.
Page 10 of10
7. ABSTRACT OF THE INVENTION
The present invention, titled "Integrated Framework for Advanced Statistical Computing
and Data Analytics in Multidisciplinary Applications," introduces a cutting-edge,
technology-driven system that integrates statistical methodologies with advanced
computational technologies to address challenges in large-scale and complex data analytics.
The framework leverages modern computing architectures, including high-performance
computing (HPC), distributed systems, and cloud-based platforms, to provide a scalable and
efficient solution for multidisciplinary applications.
The system incorporates machine learning and artificial intelligence (AI) for automated model
selection, optimization, and predictive analytics, enabling users to analyze diverse datasets with
minimal manual intervention. Real-time data processing is supported through streaming data
pipelines, ensuring immediate insights for time-sensitive applications. A robust visualization
module powered by dynamic rendering technologies and natural language generation (NLG)
translates analytical results into interactive dashboards, intuitive visual representations, and
plain-language summaries for both technical and non-technical audiences.
The framework supports modular customization, interoperability with existing tools and
platforms via API integrations, and cross-platform accessibility through web and mobile
technologies. Its domain-agnostic design makes it applicable to fields such as healthcare,
engineering, business intelligence, environmental science, and more. By combining statistical
rigor with state-of-the-art computational technologies, the invention provides a unified, user-
friendly platform that enhances analytical precision, usability, and collaboration across diverse
domains.
11.
Page 1 of11
BRIEF DESCRIPTION OF THE DRAWINGS
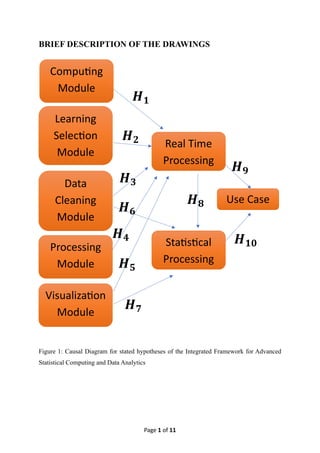
Figure 1: Causal Diagram for stated hypotheses of the Integrated Framework for Advanced
Statistical Computing and Data Analytics
Computing
Module
Learning
Selection
Module
Processing
Module
Visualization
Module
Data
Cleaning
Module
Real Time
Processing
Statistical
Processing
Use Case
𝑯𝟏
𝑯𝟐
𝑯𝟑
𝑯𝟒
𝑯𝟓
𝑯𝟔
𝑯𝟕
𝑯𝟖
𝑯𝟗
𝑯𝟏𝟎
12.
Page 2 of11
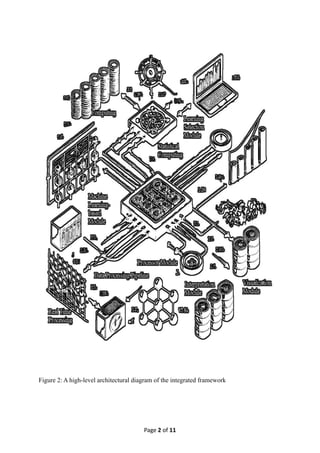
Figure 2: A high-level architectural diagram of the integrated framework
13.
Page 3 of11
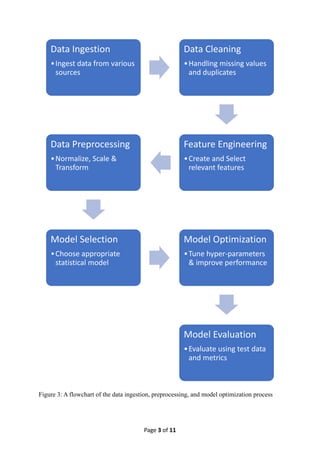
Figure 3: A flowchart of the data ingestion, preprocessing, and model optimization process
Data Ingestion
•Ingest data from various
sources
Data Cleaning
•Handling missing values
and duplicates
Feature Engineering
•Create and Select
relevant features
Data Preprocessing
•Normalize, Scale &
Transform
Model Selection
•Choose appropriate
statistical model
Model Optimization
•Tune hyper-parameters
& improve performance
Model Evaluation
•Evaluate using test data
and metrics
14.
Page 4 of11
Figure 4: An example of dynamic visualizations generated by the framework
Line Chart (Time
Series Analysis)
•Purpose: Tracking the change in a specific variable over time.
•Data: Sales data over the past year.
•Feature: Interactivity to highlight specific time periods or
trends when hovered over.
Bar Chart (Category
Comparison)
•Purpose: Comparing quantities across different categories.
•Data: Sales by product category in the last quarter.
•Feature: Dynamic filtering to select specific product categories
or time periods.
Pie Chart
(Proportional
Comparison)
•Purpose: Displaying proportions or percentages of a whole.
•Data: Market share by company for a specific year.
•Feature: Drill-down capability to show sub-categories when
clicking on each slice.
Scatter Plot
(Correlation
Analysis)
•Purpose: Showing relationships between two continuous
variables.
•Data: Customer satisfaction vs. purchase frequency.
•Feature: Tooltip with details on data points, and the ability to
zoom into a specific range.
Heat Map (Density
or Intensity
Visualization)
•Purpose: Visualizing data density or intensity over a
geographic area or matrix.
•Data: Traffic intensity across different regions of a city at
different times of day.
•Feature: Color intensity changing dynamically as the user
interacts with different times or regions.
Histogram
(Distribution of Data)
•Purpose: Understanding the distribution of data.
•Data: Age distribution of a customer base.
•Feature: Real-time re-calculation and adjustments based on
user-defined bin sizes.
Bubble Chart
(Multivariable
Analysis)
•Purpose: Showing the relationship between three variables.
•Data: Product sales, profit, and quantity sold.
•Feature: Dynamic bubble size representing sales volume, color
indicating profit, and position showing quantity sold.
Radar Chart (Multi-
dimensional
Comparison)
•Purpose: Comparing multiple variables across different
categories.
•Data: Evaluation of different departments on key performance
indicators (KPIs).
•Feature: Interactive comparison of departments by clicking on
specific KPIs to view trends.
15.
Page 5 of11
import random
def generate_summary(data, model_name, results):
"""
Generates a natural language summary for statistical results.
Parameters:
data (dict): A dictionary containing dataset details (e.g., name, size, key variables).
model_name (str): The name of the statistical or machine learning model used.
results (dict): A dictionary with analysis results (e.g., accuracy, key metrics, trends).
Returns:
str: A human-readable summary of the analysis.
"""
dataset_name = data.get("name", "the dataset")
data_size = data.get("size", "unknown size")
key_variables = ", ".join(data.get("key_variables", ["variables"]))
model = model_name
accuracy = results.get("accuracy", "N/A")
significant_factors = results.get("significant_factors", ["factors"])
trends = results.get("trends", "No trends detected.")
# Generate a dynamic summary
summary = (
f"Analysis Summary:n"
f"The analysis was conducted on {dataset_name}, which consists of {data_size} entries,
"
f"focusing on key variables such as {key_variables}. The {model} model was applied to
the data, "
f"achieving an accuracy of {accuracy}. The analysis identified significant factors
influencing the results, "
f"including {', '.join(significant_factors)}. Additionally, the data revealed the following
trends: {trends}.n"
f"These insights provide valuable information for further exploration and decision-
making."
)
return summary
# Example usage
if __name__ == "__main__":
# Input details
dataset_details = {
"name": "Customer Retention Data",
16.
Page 6 of11
"size": "10,000 records",
"key_variables": ["age", "spending score", "loyalty tier"]
}
model_used = "Random Forest Classifier"
analysis_results = {
"accuracy": "92%",
"significant_factors": ["loyalty tier", "spending score"],
"trends": "Higher loyalty tiers are strongly correlated with increased retention rates."
}
# Generate and print summary
summary = generate_summary(dataset_details, model_used, analysis_results)
print(summary)
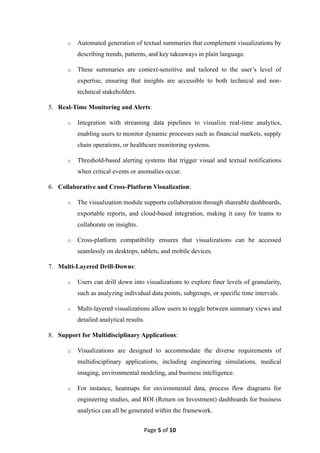
Table 1: Python-based Natural Language Generation (NLG) module for an integrated
framework
Component Description Example/Details
Input Data Raw information from
statistical analysis or
predictive modeling.
Dataset name, size, key variables,
model name, accuracy, trends,
significant factors.
Processing Steps Steps performed by the NLG
module to generate
summaries.
1. Extract key results2. Identify
significant patterns3. Convert insights
into structured sentences.
Output Data Human-readable summaries
in natural language format.
Example: "The analysis revealed that
higher loyalty tiers strongly correlate
with increased retention rates."
Key Features Highlights the primary
capabilities of the module.
- Automated summarization- Domain-
agnostic insights- Integration with
statistical models.
Statistical Models
Supported
Types of statistical or machine
learning models compatible
with the NLG module.
Regression, classification, clustering,
time-series analysis, Random Forest,
Neural Networks.
17.
Page 7 of11
Visualization
Integration
Optional integration of text
with charts or graphs for
enhanced interpretability.
Annotations on graphs, captions for
plots, or tooltips in dashboards.
Language
Customization
Ability to customize
summaries for different
audiences.
- Technical summaries for
researchers.- Simplified summaries
for non-technical stakeholders.
Use Cases Examples of practical
applications of the NLG
module.
- Business insights reporting.-
Healthcare analytics summaries.-
Engineering failure analysis reports.
API Integration Interfaces to connect with
other systems or platforms.
RESTAPI, GraphQLAPI for dynamic
generation of insights in dashboards
or third-party tools.
Output Format Formats supported for the
generated natural language
summaries.
Plain text, HTML, JSON, PDF.
Scalability Ability to adapt to varying
scales of data and user
requirements.
Works on small datasets to big data in
distributed systems.
Performance
Metrics
Evaluation criteria for the
NLG module.
Readability, accuracy of insights,
linguistic coherence, and domain
relevance.
Domain-Specific
Adaptation
Capability to specialize
language generation for
specific disciplines or
industries.
- Healthcare: "Patients in age group
40–50 show better recovery rates."-
Business: "Sales increased by 20%."
Table 2: Table Structure for Natural Language Generation (NLG) module for an integrated
framework
from fastapi import FastAPI
18.
Page 8 of11
from pydantic import BaseModel
app = FastAPI()
# Define input data model
class InsightRequest(BaseModel):
dataset_name: str
model_name: str
accuracy: float
significant_factors: list
trends: str
# Define a REST endpoint
@app.post("/generate-insight/")
async def generate_insight(request: InsightRequest):
summary = (
f"The analysis on '{request.dataset_name}' using the '{request.model_name}' model "
f"achieved an accuracy of {request.accuracy}%. Key influencing factors include: "
f"{', '.join(request.significant_factors)}. Notable trends observed: {request.trends}."
)
return {"summary": summary}
# Run the API with: uvicorn filename:app --reload
Table 3: Dynamic generation of insights in dashboards using Python (FastAPI for REST)
from fastapi import FastAPI
from starlette.graphql import GraphQLApp
import graphene
19.
Page 9 of11
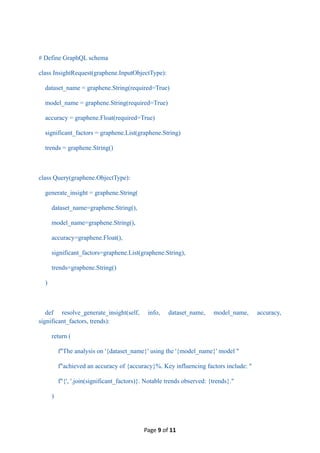
# Define GraphQL schema
class InsightRequest(graphene.InputObjectType):
dataset_name = graphene.String(required=True)
model_name = graphene.String(required=True)
accuracy = graphene.Float(required=True)
significant_factors = graphene.List(graphene.String)
trends = graphene.String()
class Query(graphene.ObjectType):
generate_insight = graphene.String(
dataset_name=graphene.String(),
model_name=graphene.String(),
accuracy=graphene.Float(),
significant_factors=graphene.List(graphene.String),
trends=graphene.String()
)
def resolve_generate_insight(self, info, dataset_name, model_name, accuracy,
significant_factors, trends):
return (
f"The analysis on '{dataset_name}' using the '{model_name}' model "
f"achieved an accuracy of {accuracy}%. Key influencing factors include: "
f"{', '.join(significant_factors)}. Notable trends observed: {trends}."
)
20.
Page 10 of11
# Create FastAPI app with GraphQL endpoint
app = FastAPI()
app.add_route("/graphql", GraphQLApp(schema=graphene.Schema(query=Query)))
# Run the API with: uvicorn filename:app --reload
Table 4: Dynamic generation of insights in dashboards using Python (GraphQL)
{
"dataset_name": "Customer Retention",
"model_name": "Random Forest",
"accuracy": 92.5,
"significant_factors": ["Loyalty Tier", "Spending Score"],
"trends": "Higher loyalty correlates with increased retention."
}
{
"summary": "The analysis on 'Customer Retention' using the 'Random Forest' model achieved
an accuracy of 92.5%. Key influencing factors include: Loyalty Tier, Spending Score. Notable
trends observed: Higher loyalty correlates with increased retention."
}
Table 5: Query Example with Response (FastAPI for REST)
query {
generateInsight(
datasetName: "Customer Retention",
21.
Page 11 of11
modelName: "Random Forest",
accuracy: 92.5,
significantFactors: ["Loyalty Tier", "Spending Score"],
trends: "Higher loyalty correlates with increased retention."
)
}
{
"data": {
"generateInsight": "The analysis on 'Customer Retention' using the 'Random Forest' model
achieved an accuracy of 92.5%. Key influencing factors include: Loyalty Tier, Spending Score.
Notable trends observed: Higher loyalty correlates with increased retention."
}
}
Table 6: Query Example with Response (GraphQL)
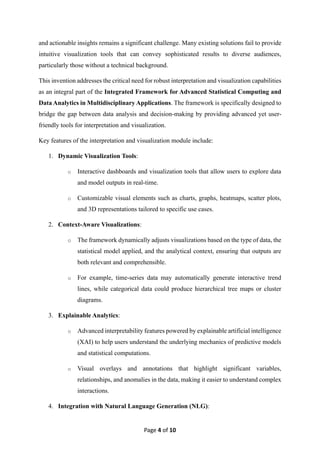
Figure 5: A user interface screenshot displaying interactive dashboards and natural language-
generated summaries


![Page 5 of 11
import random
def generate_summary(data, model_name, results):
"""
Generates a natural language summary for statistical results.
Parameters:
data (dict): A dictionary containing dataset details (e.g., name, size, key variables).
model_name (str): The name of the statistical or machine learning model used.
results (dict): A dictionary with analysis results (e.g., accuracy, key metrics, trends).
Returns:
str: A human-readable summary of the analysis.
"""
dataset_name = data.get("name", "the dataset")
data_size = data.get("size", "unknown size")
key_variables = ", ".join(data.get("key_variables", ["variables"]))
model = model_name
accuracy = results.get("accuracy", "N/A")
significant_factors = results.get("significant_factors", ["factors"])
trends = results.get("trends", "No trends detected.")
# Generate a dynamic summary
summary = (
f"Analysis Summary:n"
f"The analysis was conducted on {dataset_name}, which consists of {data_size} entries,
"
f"focusing on key variables such as {key_variables}. The {model} model was applied to
the data, "
f"achieving an accuracy of {accuracy}. The analysis identified significant factors
influencing the results, "
f"including {', '.join(significant_factors)}. Additionally, the data revealed the following
trends: {trends}.n"
f"These insights provide valuable information for further exploration and decision-
making."
)
return summary
# Example usage
if __name__ == "__main__":
# Input details
dataset_details = {
"name": "Customer Retention Data",](https://image.slidesharecdn.com/form2-250320080511-de0429cf/85/Integrated-Framework-for-Advanced-Statistical-Computing-and-Data-Analytics-in-Multidisciplinary-Applications-15-320.jpg)
![Page 6 of 11
"size": "10,000 records",
"key_variables": ["age", "spending score", "loyalty tier"]
}
model_used = "Random Forest Classifier"
analysis_results = {
"accuracy": "92%",
"significant_factors": ["loyalty tier", "spending score"],
"trends": "Higher loyalty tiers are strongly correlated with increased retention rates."
}
# Generate and print summary
summary = generate_summary(dataset_details, model_used, analysis_results)
print(summary)
Table 1: Python-based Natural Language Generation (NLG) module for an integrated
framework
Component Description Example/Details
Input Data Raw information from
statistical analysis or
predictive modeling.
Dataset name, size, key variables,
model name, accuracy, trends,
significant factors.
Processing Steps Steps performed by the NLG
module to generate
summaries.
1. Extract key results2. Identify
significant patterns3. Convert insights
into structured sentences.
Output Data Human-readable summaries
in natural language format.
Example: "The analysis revealed that
higher loyalty tiers strongly correlate
with increased retention rates."
Key Features Highlights the primary
capabilities of the module.
- Automated summarization- Domain-
agnostic insights- Integration with
statistical models.
Statistical Models
Supported
Types of statistical or machine
learning models compatible
with the NLG module.
Regression, classification, clustering,
time-series analysis, Random Forest,
Neural Networks.](https://image.slidesharecdn.com/form2-250320080511-de0429cf/85/Integrated-Framework-for-Advanced-Statistical-Computing-and-Data-Analytics-in-Multidisciplinary-Applications-16-320.jpg)
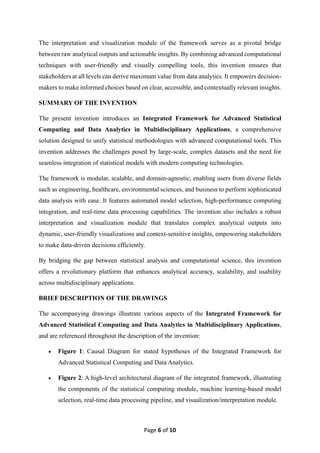
![Page 10 of 11
# Create FastAPI app with GraphQL endpoint
app = FastAPI()
app.add_route("/graphql", GraphQLApp(schema=graphene.Schema(query=Query)))
# Run the API with: uvicorn filename:app --reload
Table 4: Dynamic generation of insights in dashboards using Python (GraphQL)
{
"dataset_name": "Customer Retention",
"model_name": "Random Forest",
"accuracy": 92.5,
"significant_factors": ["Loyalty Tier", "Spending Score"],
"trends": "Higher loyalty correlates with increased retention."
}
{
"summary": "The analysis on 'Customer Retention' using the 'Random Forest' model achieved
an accuracy of 92.5%. Key influencing factors include: Loyalty Tier, Spending Score. Notable
trends observed: Higher loyalty correlates with increased retention."
}
Table 5: Query Example with Response (FastAPI for REST)
query {
generateInsight(
datasetName: "Customer Retention",](https://image.slidesharecdn.com/form2-250320080511-de0429cf/85/Integrated-Framework-for-Advanced-Statistical-Computing-and-Data-Analytics-in-Multidisciplinary-Applications-20-320.jpg)
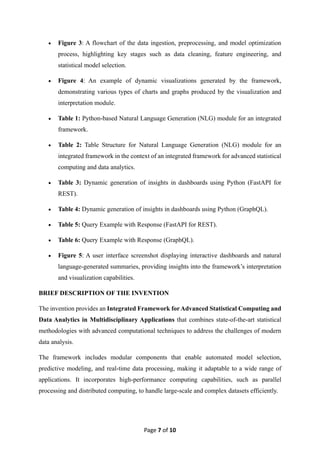
![Page 11 of 11
modelName: "Random Forest",
accuracy: 92.5,
significantFactors: ["Loyalty Tier", "Spending Score"],
trends: "Higher loyalty correlates with increased retention."
)
}
{
"data": {
"generateInsight": "The analysis on 'Customer Retention' using the 'Random Forest' model
achieved an accuracy of 92.5%. Key influencing factors include: Loyalty Tier, Spending Score.
Notable trends observed: Higher loyalty correlates with increased retention."
}
}
Table 6: Query Example with Response (GraphQL)
Figure 5: A user interface screenshot displaying interactive dashboards and natural language-
generated summaries](https://image.slidesharecdn.com/form2-250320080511-de0429cf/85/Integrated-Framework-for-Advanced-Statistical-Computing-and-Data-Analytics-in-Multidisciplinary-Applications-21-320.jpg)